Abstract
Background
Pancreatic cancer is a highly malignant tumor characterized by poor prognosis. TNM stage cannot always provide accurate prediction of prognosis, which is vital for individualized treatment. Therefore, a novel way to identify patients with poor prognosis after radical surgery is urgently needed.
Material/Methods
The nomogram was established based on a discovery cohort that included 554 patients with PDAC who had received radical surgery from 2012 to 2016. The clinicopathological data were collected. Poor prognosis was evaluated using 25 features, in which appropriate features for a prediction model were identified. A prediction model incorporating the selected features was established. The discriminative capacity was assessed by C-index, calibration by calibration plot, and clinical usefulness by decision curve. The bootstrapping approach was used to perform internal validation.
Results
Characteristics included in the nomogram were coronary artery disease and stroke history, elevated CA125, AJCC stage >II, R0 resection, operating time >6 h, poor differentiation, nerve invasion, length of stay >30 days, and postoperative complications. A C-index of 0.713 indicated good discrimination of the prediction model, and the calibration curve showed acceptable calibration. Survival analysis showed that this model had better discriminative capacity than the AJCC staging system and could distinguish relatively good prognosis from poor prognosis in patients at stage II (especially IIa) and IV.
Conclusions
Our study presents a valid and practical model to predict prognosis of pancreatic cancer patients, which contributes to individualized therapy by assisting surgeons to predict poor prognosis in patients who received radical surgery.
MeSH Keywords: Nomograms, Pancreatic Neoplasms, Prognosis
Background
Pancreatic cancer is one of the most lethal solid tumors, with extreme malignancy in the digestive system, which is the third most common cause of cancer-related death around the world [1,2]. Pancreatic duct adenocarcinoma (PDAC) accounts for more than 90% of all pancreatic cancer cases. The 5-year survival rate of pancreatic cancer remains less than 10% in the USA [3]. Accurate prediction of poor prognosis for patients with PDAC after radical surgery is of great significance and can influence treatment decisions. TNM stage has been widely accepted as a predictive parameter to indicate the prognosis of pancreatic cancer patients after radical surgery. However, TNM stage is determined mostly by anatomical features, which does not take the biological characteristics of the tumor into consideration. Previous studies have revealed several risk factors for pancreatic cancer, such as smoking, alcohol intake, obesity, and type 2 diabetes [4–7]. Although several publications have focused on the prognostic prediction of pancreatic cancer, most of these studies use data from the SEER database, which has a large sample size but limited clinicopathological parameters [8–10]. There are few studies focusing on resectable pancreatic cancer with a large sample size and abundant relevant information. Our study aimed to establish a valid and practical predicting nomogram that includes preoperative characteristics and clinicopathological features to predict the prognosis of patients with resectable PDAC.
Material and Methods
Patients
Research approval (No. 103 in 2019) was received from the local ethics committee of Ruijin Hospital affiliated to the School of Medicine, Shanghai Jiao Tong University. The ethics committee waived the need for informed consent because this was an observational retrospective study. Patients were recruited from Ruijin Hospital from 2012 to 2016. A complete assessment of medical records from the institutional database was conducted to select patients histologically diagnosed as PDAC who underwent radical surgery with curative intent. All patients were followed up until cancer-specific death, and those who died within 6 months after surgery were considered to have a poor prognosis.
The inclusion criteria were: 1) Patients with suspected pancreatic cancer between 18 and 80 years old and the tumor was evaluated as resectable or borderline resectable by a multi-disciplinary team; 2) No absolute contraindications, and physical strength score ranging from 0 to 1; 3) Histopathologically confirmed as PDAC; 4) No secondary cancer or other malignant tumors; and 5) No chemoradiotherapy was performed before surgery. The exclusion criteria were: 1) Loss to follow-up and incomplete data; 2) In-hospital death or death caused by postoperative complications within 1 month after surgery; and 3) Incomplete radical operation. Baseline clinicopathologic data, including age, sex, blood biochemical examination, tumor marker, and clinicopathological factors were obtained from medical records. For patients at stage IV with focal liver metastasis detected before surgery or newly-discovered single liver metastatic lesion discovered during surgery, radical surgery was performed if the patients or their relations insisted on surgical resection despite thorough explanation of the limited benefits of surgery.
Statistical analysis
R software was used to perform statistical analysis and visualize the results. Optimal features were selected by the least absolute shrinkage and selection operator (LASSO) method designed to reduce the dimensions of data [11,12]. Through LASSO regression, factors that were analyzed with nonzero coefficients were identified and selected [13]. The prediction model incorporating features selected using the LASSO regression model was established based on multivariable logistic regression analysis, which is used to assess the odds ratio (OR), 95% confidence interval (CI), and corresponding P value. All selected predictors with P value <0.05 were enrolled in the prediction model. The calibration of the model was assessed by calibration curves [14]. A C-index was generated to measure the discrimination capacity of the nomogram [15,16]. A validating C-index was generated from bootstrapping validation (1000 bootstrap resamples). Bootstrap resampling was performed by fitting the logistic model into a bootstrap sample, which was extracted from original sample [17]. The clinical usefulness of this nomogram was evaluated by decision curve analysis [18,19]. Area under the ROC curves (AUC) was also used to evaluate the discriminative capacity of the nomogram [20]. Risk score at 0.2–0.4 were considered as low risk, 0.4–0.7 as medium risk and 0.7–0.9 as high risk.
Results
Patients’ characteristics
A total of 554 patients were included in the study. The discovery cohort consisted of 183 patients with poor prognosis (survival less than 6 months after radical surgery) and the control group included 371 patients with relatively good prognosis (survival longer than 6 months after radical surgery). There were 347 males and 207 females, with a mean age of 62.57±9.23 years (range 32–85 years). There were 343 cases of pancreaticoduodenectomy (PD), 210 cases of distal pancreatectomy (DP), and 1 case of total pancreatectomy (TP), all of which were performed according to tumor location combined with vascular reconstruction or dissection of lymph nodes. The demographic and clinicopathological variables of enrolled patients are summarized in Supplementary Table 1 and Table 1.
Table 1.
Demographic and clinical characteristics of patients with resectable PDAC.
| Demographic characteristics | Survival <6 months (%) (n=183) | Survival >6 months (%) (n=371) | Total (%) (n=554) | |
|---|---|---|---|---|
| Sex | Male | 111 (60.66%) | 236 (63.61%) | 347 (62.64%) |
| Female | 72 (39.34%) | 135 (36.39%) | 207 (37.36%) | |
| LOS | >30 days | 41 (22.40%) | 65 (17.52%) | 106 (19.13%) |
| ≤30 days | 142 (77.60%) | 306 (82.48%) | 448 (80.87%) | |
| HTN | Yes | 66 (36.07%) | 126 (33.96%) | 192 (34.66%) |
| No | 117 (63.93%) | 245 (66.04%) | 362 (65.34%) | |
| CAD & stroke | Yes | 18 (9.84%) | 21 (5.66%) | 39 (7.04%) |
| No | 165 (90.16%) | 350 (94.34%) | 515 (92.96%) | |
| Anemia | Yes | 90 (49.18%) | 176 (47.44%) | 266 (48.01%) |
| No | 93 (50.82%) | 195 (52.56%) | 288 (51.99%) | |
| Jaundice | Yes | 74 (40.44%) | 163 (43.94%) | 237 (42.78%) |
| No | 109 (59.56%) | 208 (56.06%) | 317 (57.22%) | |
| Elevated fasting glucose | Yes | 76 (41.53%) | 154 (42.32%) | 230 (41.52%) |
| No | 107 (58.47%) | 217 (58.49%) | 324 (58.48%) | |
| Elevated CA125 | Yes | 52 (28.42%) | 58 (15.63%) | 110 (19.86%) |
| No | 131 (71.58%) | 313 (84.37%) | 444 (80.14%) | |
| Elevated CA199 | Yes | 153 (83.61%) | 289 (77.90%) | 442 (79.78%) |
| No | 30 (16.39%) | 82 (22.10%) | 112 (20.22%) | |
| R0 resection | Yes | 141 (77.05%) | 332 (89.49%) | 473 (85.38%) |
| No | 42 (22.95%) | 39 (10.51%) | 81 (14.62%) | |
| Smoking | Yes | 39 (21.31%) | 89 (23.99%) | 128 (23.10%) |
| No | 144 (78.69%) | 282 (76.01%) | 426 (76.90%) | |
| Alcohol intake | Yes | 30 (16.39%) | 54 (14.56%) | 84 (15.16%) |
| No | 153 (83.61%) | 317 (85.44%) | 470 (84.84%) | |
| ASA score | ≥2 | 62 (33.88%) | 109 (29.38%) | 171 (30.87%) |
| <2 | 121 (66.12%) | 262 (70.62%) | 383 (69.13%) | |
| Vein resection | Yes | 21 (11.48%) | 36 (9.70%) | 57 (10.29%) |
| No | 162 (88.52%) | 335 (90.30%) | 497 (89.71%) | |
| Artery resection | Yes | 9 (4.92%) | 16 (4.31%) | 25 (4.51%) |
| No | 174 (95.08%) | 355 (95.69%) | 529 (95.49%) | |
| Poor differentiation | Yes | 119 (65.03%) | 211 (56.87%) | 330 (59.57%) |
| No | 64 (34.97%) | 160 (43.13%) | 224 (40.43%) | |
| Combined organ resection | Yes | 19 (10.38%) | 12 (3.23%) | 31 (5.60%) |
| No | 164 (89.62%) | 359 (96.77%) | 523 (94.40%) | |
| OT | >6 h | 35 (19.13%) | 49 (13.21%) | 84 (15.16%) |
| ≤6 h | 148 (80.87%) | 322 (86.79%) | 470 (84.84%) | |
| Bleeding | >1000 ml | 20 (10.93%) | 25 (6.74%) | 45 (8.12%) |
| ≤1000 ml | 163 (89.07%) | 346 (93.26%) | 509 (91.88%) | |
| Operative transfusion | Yes | 109 (59.56%) | 211 (56.87%) | 320 (57.76%) |
| No | 74 (40.44%) | 160 (43.13%) | 234 (42.24%) | |
| LNR | >0.2 | 46 (25.14%) | 67 (18.06%) | 113 (20.40%) |
| ≤0.2 | 137 (74.86%) | 304 (81.94%) | 441 (79.60%) | |
| Nerve invasion | Yes | 155 (84.70%) | 282 (76.01%) | 437 (78.88%) |
| No | 28 (15.30%) | 89 (23.99%) | 117 (21.12%) | |
| AJCC stage | >II | 64 (34.97%) | 49 (13.21%) | 113 (20.40%) |
| ≤II | 119 (65.03%) | 322 (86.79%) | 441 (79.60%) | |
| Clavien-Dindo grade | >1 | 26 (14.21%) | 72 (19.41%) | 98 (17.69%) |
| ≤1 | 157 (85.79%) | 299 (80.59%) | 456 (82.31%) | |
LOS – length of stay; HTN – hypertension; CAD – coronary artery disease; ASA – American Society of Anesthesiologists; OT – operating time; LNR – lymph node ratio; AJCC – American Joint Committee on Cancer.
Feature selection
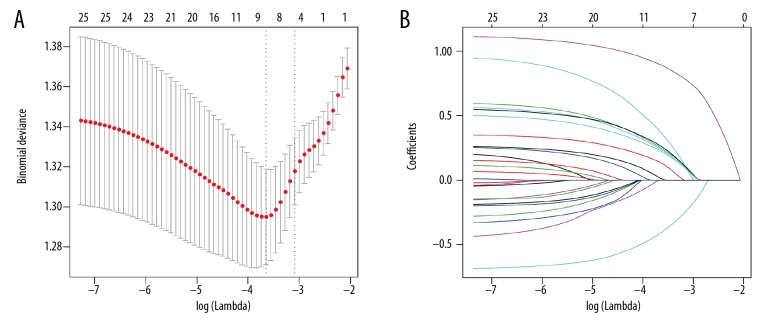
Of the demographic, laboratory examination, and clinicopathological variables, 9 potential predictors that had nonzero coefficients were identified and selected from 25 features (Figure 1A, 1B). The selected features were AJCC stage >II, coronary artery disease (CAD) and stroke history, elevated CA125, R0 resection, operating time (OT) >6 h, poor differentiation, nerve invasion, length of stay >30 days, and postoperative complications (Clavien-Dindo grade >1).
Figure 1.
Clinicopathological parameter identification and selection by LASSO regression model. (A) Five-fold cross-validation was applied to select the most suitable parameter using LASSO regression model. (B) Coefficient curves of the 25 parameters. LASSO – the least absolute shrinkage and selection operator.
Establishment of prediction model
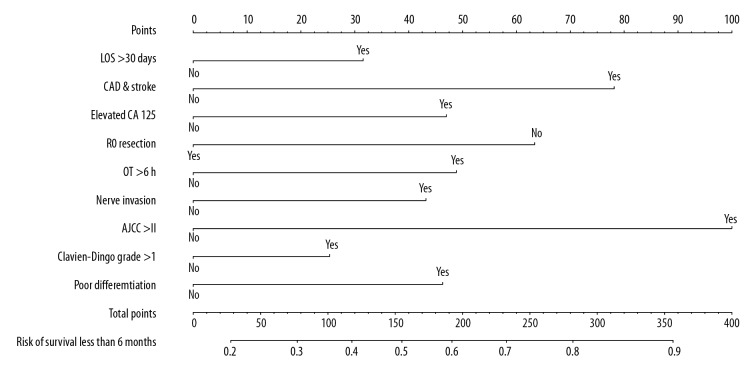
The coefficient value, OR with 95% CI, and P value of the 9 selected factors calculated by multivariate logistic regression model are listed in Table 2. A nomogram comprised of the factors above was established, which is presented in Figure 2. The specific points of each predictor are shown in Table 3.
Table 2.
Prediction factors for patients with poor prognosis after radical surgery.
| Intercept and variable | β | Odds ratio (95% CI) | P value |
|---|---|---|---|
| Intercept | −0.9994067 | 0.3680978 (0.1755997–0.7583270) | 0.00724 |
| AJCC stage >II | 1.0913924 | 2.9784183 (1.8147357–4.9552890) | 1.96e–05 |
| CAD & stroke history | 0.8529103 | 2.3464659 (1.0777371–5.3129831) | 0.03462 |
| Elevated CA125 | 0.5128306 | 1.6700116 (1.0108799–2.7670180) | 0.04535 |
| R0 resection | −0.6917549 | 0.5006966 (0.2891940–0.8576446) | 0.01234 |
| OT >6 h | 0.5332936 | 1.7045372 (1.0620359–2.7425817) | 0.02727 |
| Tumor grade low | 1.6576758 | 1.6576758 (1.1017774–2.5077881) | 0.01586 |
| Nerve invasion | 0.4715138 | 1.6024181 (0.9678093–2.6965005) | 0.07045 |
| LOS >30 days | 0.3441662 | 1.4108131 (0.8400952–2.3675593) | 0.19174 |
| Clavien-Dindo grade >1 | 1.3185691 | 1.3185691 (0.6981923–2.4884413) | 0.39198 |
P<0.05 was considered to denote statistical significance.
AJCC – American Joint Committee on Cancer; CAD – coronary artery disease; OT – operating time; LOS – length of stay.
Figure 2.
Developed of a nomogram to predict poor prognosis. The nomogram was established based on the discovery cohort, with the use of LOS >30 days, CAD and stroke history, elevated CA125, R0 resection, OT >6 h, nerve invasion, AJCC stage >II, complications Clavien-Dindo grade >1, and poor differentiation. LOS – length of stay; CAD – coronary artery disease; OT – operating time; AJCC – American Joint Committee on Cancer.
Table 3.
Points of each predictor.
| Variable | Status | Points |
|---|---|---|
| LOS >30 days | No | 0 |
| Yes | 32 | |
| CAD & stroke history | No | 0 |
| Yes | 78 | |
| Elevated CA125 | No | 0 |
| Yes | 47 | |
| R0 resection | No | 63 |
| Yes | 0 | |
| OT >6 h | No | 0 |
| Yes | 49 | |
| Nerve invasion | No | 0 |
| Yes | 43 | |
| AJCC stage >II | No | 0 |
| Yes | 100 | |
| Complications (Clavien-Dindo grade >1) | No | 0 |
| Yes | 25 | |
| Poor differentiation | No | 0 |
| Yes | 46 |
LOS – length of stay; CAD – coronary artery disease; OT – operating time; AJCC – American Joint Committee on Cancer.
Apparent performance of the nomogram to indicate poor prognosis
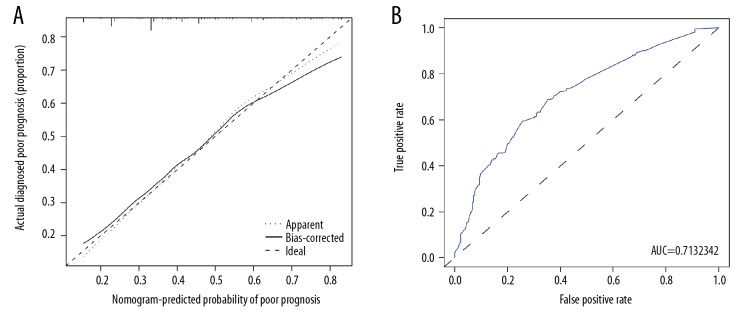
The calibration curve of the nomogram to predict poor prognosis in patients with resectable PDAC demonstrated good agreement in the discovery population (Figure 3A). A C-index of 0.713 with 95% CI ranging from 0.665 to 0.760 was generated. Through bootstrapping validation, the C-index was confirmed to be 0.689. Moreover, the AUC of the nomogram was 0.713 (95% CI 0.660–0.760) (Figure 3B). All of the above results suggested the good discriminative capacity of this model.
Figure 3.
Calibration and ROC curve of the poor prognosis prediction. (A) Calibration curves. The predicted possibility of poor prognosis is indicated by the x axis and the actual possibility of poor prognosis is indicated by the y axis. (B) ROC curves. The x axis represents the false-positive rate, while the y axis shows the true-positive rate. AUC – the area under ROC curve.
Clinical use of the nomogram
As shown in Figure 4, the decision curve suggested that if a patient and a doctor respectively showed a threshold probability of >17% and <73%, more benefit would be added than with the scheme when the nomogram was used to predict the prognosis of patients with PDAC. Moreover, based on this model to predict prognosis, net benefit was comparable with several overlaps within the range mentioned above.
Figure 4.
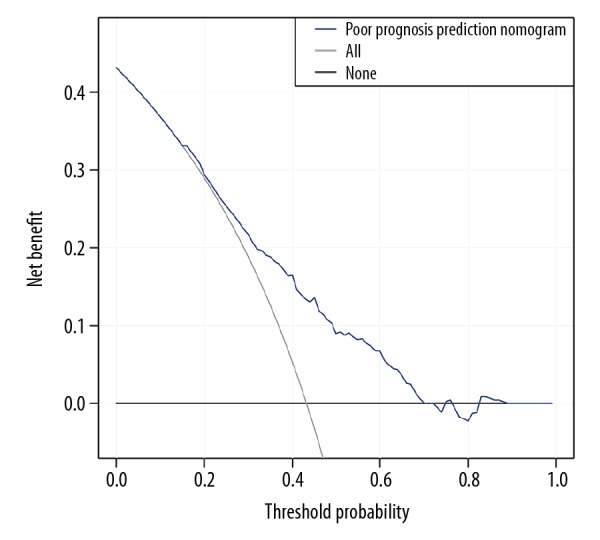
Clinical usefulness of the poor prognosis prediction nomogram. The y axis represents net benefit. The x axis shows threshold probability. The blue line displays the benefit of our nomogram. The gray line suggests that all patients have poor prognosis, while the black line indicates that no patient has poor prognosis.
Examples of the nomogram in use
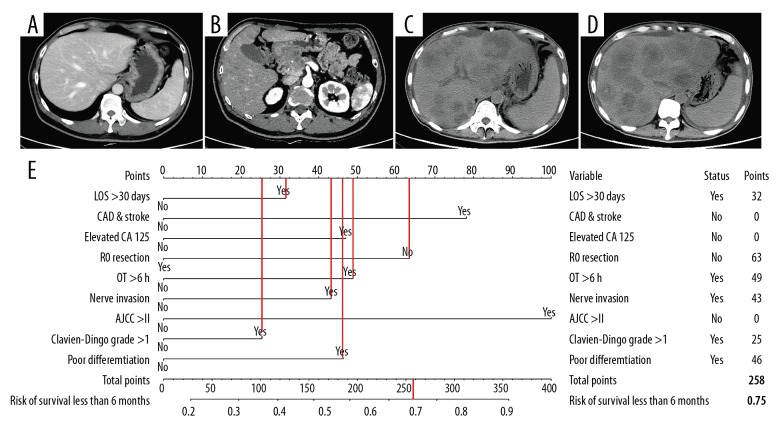
Patient 1, 35 years old, had a tumor in the head of the pancreas with presence of jaundice. Preoperative and postoperative imaging examinations are shown in Figure 5A–5D. The details of the predicted risk factors of this patient are presented in Figure 5E. The risk of poor prognosis predicted by the nomogram was more than 75%. Moreover, this patient developed liver metastasis 1 month after radical surgery and died 80 days later.
Figure 5.
An example of the nomogram in use. (A–D) Preoperative and postoperative imaging examinations. (E) Details of the predicted risk factors.
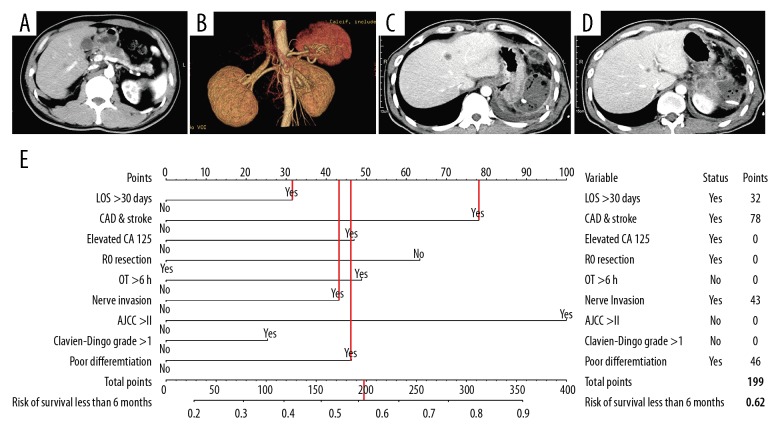
Patient 2, aged 51 years, had a tumor located in the body of the pancreas, with presence of abdominal pain. Preoperative and postoperative imaging examinations are shown in Figure 6A–6D. The details of the predicted risk factors of this patient are shown in Figure 6E. The risk of poor prognosis determined by nomogram was more than 60%. Unfortunately, although the patient’s AJCC stage was II, he developed multiple liver metastasis 2 months after radical surgery and died 111 days later.
Figure 6.
Another example of nomogram in use. (A–D) Preoperative and postoperative imaging examinations. (E) Details of the predicted risk factors.
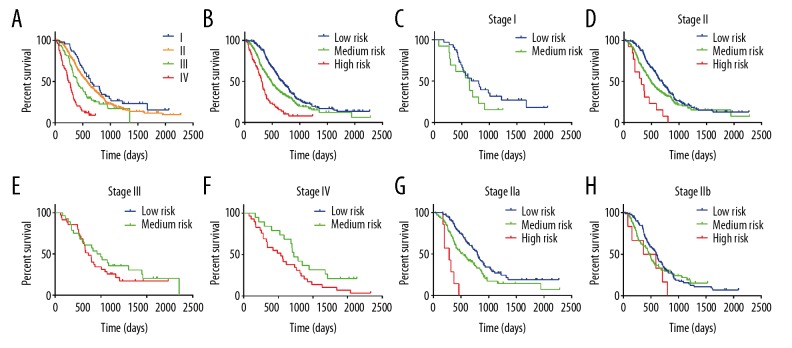
Kaplan-Meier curve analysis
TNM stage is currently used to predict the prognosis of cancer patients. According to the 8th edition AJCC staging system, we plotted survival curves stratified by different stages (Figure 7A). The result showed that patients at stage I compared with those at stage II showed no obvious difference in long-term survival (P=0.1458), almost the same as patients at stage II with stage III (P=0.0364). However, when stratified by risk group determined by our model, the survival curves showed good discrimination (Plow-medium=0.0007, Pmedium-high<0.0001) (Figure 7B). Moreover, when we applied our model in patients at different stages, we found the model showed good discriminative capacity of survival in patients at stage II (Plow-medium=0.0120, Pmedium-high<0.0051) and stage IV (P=0.0137) (Figure 7C–7F). To investigate the specific population that could potentially benefit from this model, we performed further subgroup analysis using patients at stage II. As shown in Figure 7G and 7H, the model showed excellent discrimination in patients at stage IIa (Plow-medium=0.0046, Pmedium-high<0.0007), but not in patients at stage IIb.
Figure 7.
Kaplan-Meier curve analysis. Survival curves stratified by (A) AJCC stages and (B) risk groups defined by the prediction model. (C–F) Survival curves stratified by risk groups in patients at stage I, II, III, and IV. (G–H) Survival curves of patients at stage IIa and IIb stratified by risk groups.
Discussion
Recently, using nomograms to predict prognosis or other end-points has drawn increasing attention in oncologic research. A reliable prediction model based on well-selected risk factors can increase the accuracy of prediction and contribute to clinical decision-making [21–25]. In the present study, we established and validated a practical prediction model to predict the prognosis of patients with PDAC after radical surgery, using 9 easily available variables, including AJCC stage >II, CAD and stroke history, elevated CA125, R0 resection, operating time >6 hr poor differentiation, nerve invasion, length of stay >30 days, and postoperative complications (Clavien-Dindo grade >1). The discovery cohort indicated the good discrimination and calibration of the prediction model, with a C-index of 0.713. Similarly, internal bootstrapping validation also suggested acceptable discriminative ability, with a C-index of 0.689. Survival analysis showed that this model had better discriminative capacity than the AJCC staging system and could distinguish relatively good prognosis from poor prognosis in patients at stage II (especially IIa) and IV. These results suggest that this model is a valid and practical model to predict the prognosis of pancreatic cancer patients, and can potentially contribute to individualized therapy by assisting surgeons to identify those patients with poor prognosis or patients who cannot benefit from radical surgery
The classic clinicopathological characteristics used in this nomogram, such as AJCC stage >II, R0 resection, poor differentiation, and nerve invasion, are in line with previous studies [26–29]. The importance of R0 resection for pancreatic surgery is widely acknowledged. In accordance with previously published cohort studies, tumor differentiation was recognized as an independent prognostic factor by multivariate Cox regression analysis for patients with PDAC and also for patients with periampullary after radical surgery [30–32]. A previous retrospective study using data from the SEER database suggested that with tumor differentiation included into the AJCC staging system, the present evaluation approach can offer a better survival prognostication [33]. Pancreatic cancer is neurotropic, which leads to postoperative recurrence. Perineural invasion (PNI), which may be related to tumor recurrence, has also been reported to independently predict prognosis [34]. This could be precisely confirmed by our examples mentioned above. Postoperative pathology showed perineural invasion in both patients, and metastasis eventually occurred in both patients within a short period.
Gastrointestinal malignancy, especially pancreatic cancer, is usually associated with chronic diseases such as coronary heart disease, stroke, and cerebral infarction. Advanced age is a high-risk factor for pancreatic cancer itself, and elderly patients usually also have coronary heart disease and cerebral infarction. It has been reported that chronic diseases such as diabetes are often associated with poor prognosis of pancreatic cancer [35]. In addition, patients with a history of coronary heart disease or cerebral infarction are generally in worse physical condition, which may result in worse prognosis.
Many studies on CA125 have been not only clinically relevant but also inseparable from basic research [36–38]. A Chinese team specifically conducted a series of studies on CA125 to clarify its important role in clinical practice, as well as prediction of resectability and prognosis [39–41]. Increased CA125 often indicates a high tumor burden and high degree of malignancy. A nomogram established by He et al. [32] to predict individual risk of OS and PFS in patients with periampullary adenocarcinoma after pancreatoduodenectomy included LNR as a significant predictor, which was confirmed by a recent study using SEER database to predict disease-specific survival in patients with non-metastatic ampullary carcinoma [42]. However, LNR was not incorporated into our prediction model due to the different tumor type, the larger cohort in our study, and different statistical approach. Notably, more than 6 h of operating time, more than 1 month stay in hospital, and more severe complications (Clavien-Dindo Grade >1) tend to indicate complicated surgery [43–46], and the complexity of surgery is often positively associated with tumor malignancy. Most malignant tumors can invade the important organs and blood vessels nearby, which greatly increases the difficulty of surgery and worsens the prognosis.
Two patients were selected to test the clinical usefulness of our model. The predicted possibility of poor prognosis of these 2 people were 0.75 and 0.62. Notably, these 2 patients, classified as AJCC less than stage III, which is conventionally considered to have a positive prognosis, had a poor prognosis, with 80 and 136 days of postoperative survival, indicating that additional clinicopathological parameters beyond AJCC stage should be taken into consideration when determining patient prognosis. This is why we established this prediction model with more risk factors included. In addition, this model showed good discriminative ability when applied to patients at stage II and stage IV (Figure 7D, 7F). Conventionally, stage IV with liver metastasis is definitely a contraindication of radical surgery. However, our results suggested that patients at stage IV could benefit from radical surgery, which is in accordance with some previous studies [47,48]. Interestingly, a similar result was also observed in a recently published international population-based study using the SEER database, suggesting that patients at stage III or IV with surgical resection showed higher survival estimates [49]. Therefore, through this prediction model, we can identify patients at stage IV who are more likely to have a poor prognosis. This group of patients should be asked to participate in clinical trials for possible improvement. For patients with medium risk, the prognosis has been significantly improved, with a medium survival time of more than 300 days. Through subgroup analysis of patients at stage II, our model showed good discrimination in stage IIa but not in stage IIb, possibly because patients at stage IIb are accompanied by lymphatic metastasis, and the required positive rate and examined number of lymph nodes remain controversial [50,51]. Moreover, the AJCC staging system needs to be specified and updated [52].
Our study has certain limitations that must be considered. Firstly, genomic characteristics of patients were not included into the nomogram [53,54], and precision medicine is becoming increasingly important in tumor treatment. Secondly, this was a retrospective study based on clinical data from a single center; therefore, selection bias was inevitable. Thirdly, we did not include all potential factors related to prognosis into the risk factor selection procedure because some possible characteristics were not completely recorded, such as family financial situation, patient compliance, and other conditions. Notably, adjuvant therapy is an important prognostic factor [55], but we did not include this predictor into our nomogram owing to the limited use of chemotherapy in our center, which could lead to biased conclusions. We will collect more patient cases receiving adjuvant chemotherapy in the future to perform further analysis. Finally, although our nomogram was robust, with extensive internal validation using bootstrap testing, external validation is still required. In the future, we plan to conduct prospective experiments and use data from other centers to further validate the discriminative capacity of this nomogram.
Conclusions
Our study establishes a valid and practical nomogram using easily available characteristics, which contributes to individualized treatment by assisting surgeons to identify patients at different stages who received radical surgery with poor prognosis. However, external validation to further verify the nomogram is required.
Supplementary Data
Supplementary Table 1.
Demographic and clinicopathologic characteristics of the enrolled patients.
| Variable | Number (n=554) |
|---|---|
| Age | 63 (57, 69) |
| Sex (Male) | 359 (64.82%) |
| Past history | |
| Hypertension | 192 (34.61%) |
| Cardio-cerebrovascular disease | 39 (7.04%) |
| Clinical manifestation | |
| No symptoms | 51 (9.21%) |
| Jaundice | 237 (42.78%) |
| Anemia | 266 (48.01%) |
| Laboratory tests | |
| Fasting glucose (mmol/L) | 5.9 (5.2, 7.1) |
| CA125 (u/ml) | 16.9 (10.2, 28.9) |
| CA19-9 (u/ml) | 176.4 (52.7, 560.2) |
| CEA (ng/ml) | 3.7 (2.3, 8.1) |
| Tumor location | |
| Pancreatic head | 330 (59.63%) |
| Pancreatic body/tail | 224 (40.37%) |
| Tumor size (cm) | 3 (2.5, 4) |
| Arterial invasion | 70 (12.68%) |
| Venous invasion | 127 (22.90%) |
| Neural invasion | 437 (78.78%) |
| Surgical procedure | |
| PD | 343 (61.91%) |
| DP | 210 (37.91%) |
| TP | 1 (0.18%) |
| R0 resection | 473 (85.40%) |
| Examined lymph nodes | 12 (0, 48) |
| Positive lymph nodes | 0 (0, 14) |
| LNR | 0.028 (0, 0.186) |
| T stage | |
| T1 | 95 (17.15%) |
| T2 | 289 (52.17%) |
| T3 | 90 (16.25%) |
| T4 | 80 (14.44%) |
| N stage | |
| N0 | 296 (53.43%) |
| N1 | 207 (37.36%) |
| N2 | 51 (9.21%) |
| M stage | |
| M0 | 503 (90.79%) |
| M1 | 51 (9.21%) |
| Tumor differentiation | |
| Poor | 330 (59.57%) |
| Moderate/well | 224 (40.43%) |
| Adjuvent chemotherapy (n=207) | |
| GEMOX | 99 (47.83%) |
| GEM | 55 (26.57%) |
| S1 | 29 (14.01%) |
| AG | 15 (7.25%) |
| GS | 9 (4.35%) |
PD – pancreaticoduodenectomy; DP – distal pancreatectomy; TP – total pancreatectomy.
Footnotes
Source of support: This study was supported by grants from the Shanghai Anti-Cancer Association (EYAS PROJECT; no. SACA-CY1C19)
References
- 1.Wu W, He X, Yang L, et al. Rising trends in pancreatic cancer incidence and mortality in 2000–2014. Clin Epidemiol. 2018;10:789–97. doi: 10.2147/CLEP.S160018. [DOI] [PMC free article] [PubMed] [Google Scholar]
- 2.Toesca DAS, Koong AJ, Poultsides GA, et al. Management of borderline resectable pancreatic cancer. Int J Radiat Oncol Biol Phys. 2018;100(5):1155–74. doi: 10.1016/j.ijrobp.2017.12.287. [DOI] [PubMed] [Google Scholar]
- 3.Cronin KA, Ries LA, Edwards BK. The surveillance, epidemiology, and end results (SEER) program of the National Cancer Institute. Cancer. 2014;120(Suppl 23):3755–57. doi: 10.1002/cncr.29049. [DOI] [PubMed] [Google Scholar]
- 4.Rahn S, Zimmermann V, Viol F, et al. Diabetes as risk factor for pancreatic cancer: Hyperglycemia promotes epithelial-mesenchymal-transition and stem cell properties in pancreatic ductal epithelial cells. Cancer Lett. 2018;415:129–50. doi: 10.1016/j.canlet.2017.12.004. [DOI] [PubMed] [Google Scholar]
- 5.Barone E, Corrado A, Gemignani F, Landi S. Environmental risk factors for pancreatic cancer: An update. Arch Toxicol. 2016;90(11):2617–42. doi: 10.1007/s00204-016-1821-9. [DOI] [PubMed] [Google Scholar]
- 6.Kurahara H, Maemura K, Mataki Y, et al. A therapeutic strategy for resectable pancreatic cancer based on risk factors of early recurrence. Pancreas. 2018;47(6):753–58. doi: 10.1097/MPA.0000000000001066. [DOI] [PubMed] [Google Scholar]
- 7.Pandol SJ, Apte MV, Wilson JS, et al. The burning question: Why is smoking a risk factor for pancreatic cancer? Pancreatology. 2012;12(4):344–49. doi: 10.1016/j.pan.2012.06.002. [DOI] [PMC free article] [PubMed] [Google Scholar]
- 8.Jeon CY, Pandol SJ, Wu B, et al. The association of statin use after cancer diagnosis with survival in pancreatic cancer patients: A SEER-Medicare Analysis. PLoS One. 2015;10(4):e0121783. doi: 10.1371/journal.pone.0121783. [DOI] [PMC free article] [PubMed] [Google Scholar]
- 9.Baine M, Sahak F, Lin C, et al. Marital status and survival in pancreatic cancer patients: A SEER based analysis. PLoS One. 2011;6(6):e21052. doi: 10.1371/journal.pone.0021052. [DOI] [PMC free article] [PubMed] [Google Scholar]
- 10.Song W, Miao DL, Chen L. Nomogram for predicting survival in patients with pancreatic cancer. Onco Targets Ther. 2018;11:539–45. doi: 10.2147/OTT.S154599. [DOI] [PMC free article] [PubMed] [Google Scholar]
- 11.Sauerbrei W, Royston P, Binder H. Selection of important variables and determination of functional form for continuous predictors in multivariable model building. Stat Med. 2007;26(30):5512–28. doi: 10.1002/sim.3148. [DOI] [PubMed] [Google Scholar]
- 12.Friedman JH, Hastie T, Tibshirani R. Regularization paths for generalized linear models via coordinate descent. J Stat Softw. 2010;33(1):1–22. [PMC free article] [PubMed] [Google Scholar]
- 13.Kidd AC, Mcgettrick M, Tsim S, et al. Survival prediction in mesothelioma using a scalable Lasso regression model: Instructions for use and initial performance using clinical predictors. BMJ Open Respir Res. 2018;5(1):e000240. doi: 10.1136/bmjresp-2017-000240. [DOI] [PMC free article] [PubMed] [Google Scholar]
- 14.Kramer AA, Zimmerman JE. Assessing the calibration of mortality benchmarks in critical care: The Hosmer-Lemeshow test revisited. Crit Care Med. 2007;35(9):2052–56. doi: 10.1097/01.CCM.0000275267.64078.B0. [DOI] [PubMed] [Google Scholar]
- 15.Penciana MJ, D’Agostino RB. Overall C as a measure of discrimination in survival analysis: Model specific population value and confidence interval estimation. Stat Med. 2004;23(13):2109–23. doi: 10.1002/sim.1802. [DOI] [PubMed] [Google Scholar]
- 16.Yan X, Li Z, Fan W. C-index: A weighted network node centrality measure for collaboration competence. J Informetr. 2013;7(1):223–39. [Google Scholar]
- 17.Efron B, Tibshirani R. An introduction to the bootstrap Monographs on statistics and applied probability. New York: Chapman & Hall; 1993. [Google Scholar]
- 18.Vickers AJ, Elkin EB. Decision curve analysis: A novel method for evaluating prediction models. Med Decis Making. 2006;26(6):565–74. doi: 10.1177/0272989X06295361. [DOI] [PMC free article] [PubMed] [Google Scholar]
- 19.Fitzgerald M, Saville BR, Lewis RJ. Decision curve analysis. JAMA. 2015;313(4):409–10. doi: 10.1001/jama.2015.37. [DOI] [PubMed] [Google Scholar]
- 20.Kumaravel A, Stevens T, Papachristou GI, et al. A model to predict the severity of acute pancreatitis based on serum level of amylase and body mass index. Clin Gastroenterol Hepatol. 2015;13(8):1496–501. doi: 10.1016/j.cgh.2015.03.018. [DOI] [PubMed] [Google Scholar]
- 21.Eil R, Diggs BS, Wang SJ, et al. Nomogram for predicting the benefit of neoadjuvant chemoradiotherapy for patients with esophageal cancer: A SEER-Medicare analysis. Cancer. 2014;120(4):492–98. doi: 10.1002/cncr.28447. [DOI] [PubMed] [Google Scholar]
- 22.Cao J, Yuan P, Wang L, et al. Clinical nomogram for predicting survival of esophageal cancer patients after esophagectomy. Sci Rep. 2016;6(1):26684. doi: 10.1038/srep26684. [DOI] [PMC free article] [PubMed] [Google Scholar]
- 23.Jiang S, Zhao R, Li Y, et al. Prognosis and nomogram for predicting postoperative survival of duodenal adenocarcinoma: A retrospective study in China and the SEER database. Sci Rep. 2018;8(1):7940. doi: 10.1038/s41598-018-26145-6. [DOI] [PMC free article] [PubMed] [Google Scholar]
- 24.Fang C, Wang W, Feng X, et al. Nomogram individually predicts the overall survival of patients with gastroenteropancreatic neuroendocrine neoplasms. Br J Cancer. 2017;117(10):1544–50. doi: 10.1038/bjc.2017.315. [DOI] [PMC free article] [PubMed] [Google Scholar]
- 25.Wang Y, Li J, Xia Y, et al. Prognostic nomogram for intrahepatic cholangiocarcinoma after partial hepatectomy. J Clin Oncol. 2013;31(9):1188–95. doi: 10.1200/JCO.2012.41.5984. [DOI] [PubMed] [Google Scholar]
- 26.Tummala P, Howard T, Agarwal B. Dramatic survival benefit related to R0 resection of pancreatic adenocarcinoma in patients with tumor ≤25 mm in size and ≤1 involved lymph nodes. Clin Transl Gastroenterol. 2013;4(3):e33. doi: 10.1038/ctg.2013.4. [DOI] [PMC free article] [PubMed] [Google Scholar]
- 27.White RR, Kattan MW, Haney JC, et al. Evaluation of preoperative therapy for pancreatic cancer using a prognostic nomogram. Ann Surg Oncol. 2006;13(11):1485–92. doi: 10.1245/s10434-006-9104-y. [DOI] [PubMed] [Google Scholar]
- 28.Vernerey D, Huguet F, Vienot A, et al. Prognostic nomogram and score to predict overall survival in locally advanced untreated pancreatic cancer (PROLAP) Br J Cancer. 2016;115(3):281–89. doi: 10.1038/bjc.2016.212. [DOI] [PMC free article] [PubMed] [Google Scholar]
- 29.Zhang JF, Hua R, Sun YW, et al. Influence of perineural invasion on survival and recurrence in patients with resected pancreatic cancer. Asian Pac J Cancer Prev. 2013;14(9):5133–39. doi: 10.7314/apjcp.2013.14.9.5133. [DOI] [PubMed] [Google Scholar]
- 30.Brennan MF, Kattan MW, Klimstra D, Conlon K. Prognostic nomogram for patients undergoing resection for adenocarcinoma of the pancreas. Ann Surg. 2004;240(2):293–98. doi: 10.1097/01.sla.0000133125.85489.07. [DOI] [PMC free article] [PubMed] [Google Scholar]
- 31.de Castro SM, Biere SS, Lagarde SM, et al. Validation of a nomogram for predicting survival after resection for adenocarcinoma of the pancreas. Br J Surg. 2009;96(4):417–23. doi: 10.1002/bjs.6548. [DOI] [PubMed] [Google Scholar]
- 32.He C, Mao Y, Wang J, et al. Nomograms predict long-term survival for patients with periampullary adenocarcinoma after pancreatoduodenectomy. BMC Cancer. 2018;18(1):327. doi: 10.1186/s12885-018-4240-x. [DOI] [PMC free article] [PubMed] [Google Scholar]
- 33.Wasif N, Ko CY, Farrell J, et al. Impact of tumor grade on prognosis in pancreatic cancer: Should we include grade in AJCC Staging? Ann Surg Oncol. 2010;17(9):2312–20. doi: 10.1245/s10434-010-1071-7. [DOI] [PMC free article] [PubMed] [Google Scholar]
- 34.Shimada K, Nara S, Esaki M, et al. Intrapancreatic nerve invasion as a predictor for recurrence after pancreaticoduodenectomy in patients with invasive ductal carcinoma of the pancreas. Pancreas. 2011;40(3):464–68. doi: 10.1097/MPA.0b013e31820b5d37. [DOI] [PubMed] [Google Scholar]
- 35.Dong Q, Jing W, Yang X, et al. [Type 2 diabetes mellitus is a prognostic predictor in patients with resectable pancreatic ductal adenocarcinoma]. Chinese Journal of Clinical Oncology. 2014;41:979–83. [in Chinese] [Google Scholar]
- 36.Wang Z, Tian YP. Clinical value of serum tumor markers CA19-9, CA125 and CA72-4 in the diagnosis of pancreatic carcinoma. Mol Clin Oncol. 2014;2(2):265–68. doi: 10.3892/mco.2013.226. [DOI] [PMC free article] [PubMed] [Google Scholar]
- 37.Chen SH, Hung WC, Wang P, et al. Mesothelin binding to CA125/MUC16 promotes pancreatic cancer cell motility and invasion via MMP-7 activation. Sci Rep. 2013;3:1870. doi: 10.1038/srep01870. [DOI] [PMC free article] [PubMed] [Google Scholar]
- 38.Yu X, Liang C, Qin Y, et al. Oncogenic KRAS targets MUC16/CA125 in pancreatic ductal adenocarcinoma. Mol Cancer Res. 2017;15(2):201–12. doi: 10.1158/1541-7786.MCR-16-0296. [DOI] [PubMed] [Google Scholar]
- 39.Liu L, Xiang J, Chen R, et al. The clinical utility of CA125/MUC16 in pancreatic cancer: A consensus of diagnostic, prognostic and predictive updates by the Chinese Study Group for Pancreatic Cancer (CSPAC) Int J Oncol. 2016;48(3):900–7. doi: 10.3892/ijo.2015.3316. [DOI] [PubMed] [Google Scholar]
- 40.Luo G, Xiao Z, Long J, et al. CA125 is superior to CA19-9 in predicting the resectability of pancreatic cancer. J Gastrointest Surg. 2013;17(12):2092–98. doi: 10.1007/s11605-013-2389-9. [DOI] [PubMed] [Google Scholar]
- 41.Liu L, Xu H, Wang W, et al. A preoperative serum signature of CEA+/CA125+/CA19-9 ≥1000 U/mL indicates poor outcome to pancreatectomy for pancreatic cancer. Int J Cancer. 2015;136(9):2216–27. doi: 10.1002/ijc.29242. [DOI] [PubMed] [Google Scholar]
- 42.Li HB, Zhao FQ, Zhou J. Prognostic nomogram for disease-specific survival in patients with non-metastatic ampullary carcinoma after surgery. Ann Surg Oncol. 2019;26(4):1079–85. doi: 10.1245/s10434-018-07115-8. [DOI] [PMC free article] [PubMed] [Google Scholar]
- 43.Watanabe Y, Nishihara K, Matsumoto S, et al. Effect of postoperative major complications on prognosis after pancreatectomy for pancreatic cancer: A retrospective review. Surg Today. 2017;47(5):555–67. doi: 10.1007/s00595-016-1426-1. [DOI] [PubMed] [Google Scholar]
- 44.Surlin V, Bintintan V, Petrariu FD, et al. Prognostic factors in resectable pancreatic cancer. Rev Med Chir Soc Med Nat Iasi. 2014;118(4):924–31. [PubMed] [Google Scholar]
- 45.Aziz F, Lehman EB, Reed AB. Increased duration of operating time for carotid endarterectomy is associated with increased mortality. Ann Vasc Surg. 2016;36:166–74. doi: 10.1016/j.avsg.2016.02.043. [DOI] [PubMed] [Google Scholar]
- 46.Kothari D, Struyvenberg MR, Perillo MC, et al. Extra-pancreatic complications, especially hemodialysis predict mortality and length of stay, in ICU patients admitted with acute pancreatitis. Gastroenterol Rep (Oxf) 2018;6(3):202–9. doi: 10.1093/gastro/goy005. [DOI] [PMC free article] [PubMed] [Google Scholar]
- 47.Andreou A, Knitter S, Klein F, et al. The role of hepatectomy for synchronous liver metastases from pancreatic adenocarcinoma. Surg Oncol. 2018;27:688–94. doi: 10.1016/j.suronc.2018.09.004. [DOI] [PubMed] [Google Scholar]
- 48.Shi S, Yu XJ. Time to think: Selecting patients who may benefit from synchronous resection of primary pancreatic cancer and liver metastases. World J Gastroenterol. 2018;24:3677–80. doi: 10.3748/wjg.v24.i33.3677. [DOI] [PMC free article] [PubMed] [Google Scholar]
- 49.Huang L, Jansen L, Balavarca Y, et al. Stratified survival of resected and overall pancreatic cancer patients in Europe and the USA in the early twenty-first century: A large, international population-based study. BMC Med. 2018;16(1):125. doi: 10.1186/s12916-018-1120-9. [DOI] [PMC free article] [PubMed] [Google Scholar]
- 50.Malleo G, Maggino L, Ferrone CR, et al. Number of examined lymph nodes and nodal status assessment in distal pancreatectomy for body/tail ductal adenocarcinoma. Ann Surg. 2019;270(6):1138–46. doi: 10.1097/SLA.0000000000002781. [DOI] [PubMed] [Google Scholar]
- 51.Faron M, Vuarnesson H, Boher JM, et al. How to reliably assess nodal status in distal pancreatectomy for adenocarcinoma. Pancreas. 2018;47(3):308–13. doi: 10.1097/MPA.0000000000000992. [DOI] [PubMed] [Google Scholar]
- 52.Liu L, Xu HX, He M, et al. A novel scoring system predicts postsurgical survival and adjuvant chemotherapeutic benefits in patients with pancreatic adenocarcinoma: Implications for AJCC-TNM staging. Surgery. 2018;163:1280–94. doi: 10.1016/j.surg.2018.01.017. [DOI] [PubMed] [Google Scholar]
- 53.Singh P, Srinivasan R, Wig JD. SMAD4 genetic alterations predict a worse prognosis in patients with pancreatic ductal adenocarcinoma. Pancreas. 2012;41(4):541–46. doi: 10.1097/MPA.0b013e318247d6af. [DOI] [PubMed] [Google Scholar]
- 54.Chen H, Tu H, Meng ZQ, et al. K-ras mutational status predicts poor prognosis in unresectable pancreatic cancer. Eur J Surg Oncol. 2010;36(7):657–62. doi: 10.1016/j.ejso.2010.05.014. [DOI] [PubMed] [Google Scholar]
- 55.Jin Z, Hartgers ML, Sanhueza CT, et al. Prognostic factors and benefits of adjuvant therapy after pancreatoduodenectomy for ampullary adenocarcinoma: Mayo Clinic experience. Eur J Surg Oncol. 2018;44(5):677–83. doi: 10.1016/j.ejso.2018.02.008. [DOI] [PubMed] [Google Scholar]
Associated Data
This section collects any data citations, data availability statements, or supplementary materials included in this article.
Supplementary Materials
Supplementary Table 1.
Demographic and clinicopathologic characteristics of the enrolled patients.
| Variable | Number (n=554) |
|---|---|
| Age | 63 (57, 69) |
| Sex (Male) | 359 (64.82%) |
| Past history | |
| Hypertension | 192 (34.61%) |
| Cardio-cerebrovascular disease | 39 (7.04%) |
| Clinical manifestation | |
| No symptoms | 51 (9.21%) |
| Jaundice | 237 (42.78%) |
| Anemia | 266 (48.01%) |
| Laboratory tests | |
| Fasting glucose (mmol/L) | 5.9 (5.2, 7.1) |
| CA125 (u/ml) | 16.9 (10.2, 28.9) |
| CA19-9 (u/ml) | 176.4 (52.7, 560.2) |
| CEA (ng/ml) | 3.7 (2.3, 8.1) |
| Tumor location | |
| Pancreatic head | 330 (59.63%) |
| Pancreatic body/tail | 224 (40.37%) |
| Tumor size (cm) | 3 (2.5, 4) |
| Arterial invasion | 70 (12.68%) |
| Venous invasion | 127 (22.90%) |
| Neural invasion | 437 (78.78%) |
| Surgical procedure | |
| PD | 343 (61.91%) |
| DP | 210 (37.91%) |
| TP | 1 (0.18%) |
| R0 resection | 473 (85.40%) |
| Examined lymph nodes | 12 (0, 48) |
| Positive lymph nodes | 0 (0, 14) |
| LNR | 0.028 (0, 0.186) |
| T stage | |
| T1 | 95 (17.15%) |
| T2 | 289 (52.17%) |
| T3 | 90 (16.25%) |
| T4 | 80 (14.44%) |
| N stage | |
| N0 | 296 (53.43%) |
| N1 | 207 (37.36%) |
| N2 | 51 (9.21%) |
| M stage | |
| M0 | 503 (90.79%) |
| M1 | 51 (9.21%) |
| Tumor differentiation | |
| Poor | 330 (59.57%) |
| Moderate/well | 224 (40.43%) |
| Adjuvent chemotherapy (n=207) | |
| GEMOX | 99 (47.83%) |
| GEM | 55 (26.57%) |
| S1 | 29 (14.01%) |
| AG | 15 (7.25%) |
| GS | 9 (4.35%) |
PD – pancreaticoduodenectomy; DP – distal pancreatectomy; TP – total pancreatectomy.


