

Abstract
Background
Resting-state functional MRI holds substantial potential for clinical application, but limitations exist in current understanding of how tumors exert local effects on resting-state functional MRI readings.
Purpose
To investigate the association between tumors, tumor characteristics, and changes in resting-state connectivity, to explore neurovascular uncoupling as a mechanism underlying these changes, and to evaluate seeding methodologies as a clinical tool.
Materials and Methods
Institutional review board approval was obtained for this HIPAA-compliant observational retrospective study of patients with glioma who underwent MRI and resting-state functional MRI between January 2016 and July 2017. Interhemispheric symmetry of connectivity was assessed in the hand motor region, incorporating tumor position, perfusion, grade, and connectivity generated from seed-based correlation. Statistical analysis was performed by using one-tailed t tests, Wilcoxon rank sum tests, one-way analysis of variance, Pearson correlation, and Spearman rank correlation, with significance at P < .05.
Results
Data in a total of 45 patients with glioma (mean age, 51.3 years ± 14.3 [standard deviation]) were compared with those in 10 healthy control subjects (mean age, 50.3 years ± 17.2). Patients showed loss of symmetry in measures of hand motor resting-state connectivity compared with control subjects (P < .05). Tumor distance from the ipsilateral hand motor (IHM) region correlated with the degree (R = 0.38, P = .01) and strength (R = 0.33, P = .03) of resting-state connectivity. In patients with World Health Organization grade IV glioblastomas 40 mm or less from the IHM region, loss of symmetry in strength of resting-state connectivity was correlated with tumor perfusion (R = 0.74, P < .01). In patients with gliomas 40 mm or less from the IHM region, seeding the nontumor hemisphere yielded less asymmetric hand motor resting-state connectivity than seeding the tumor hemisphere (connectivity seeded:contralateral = 1.34 nontumor vs 1.38 tumor hemisphere seeded; P = .03, false discovery rate threshold = 0.01).
Conclusion
Hand motor resting-state connectivity was less symmetrical in a tumor distance–dependent manner in patients with glioma. Differences in resting-state connectivity may be false-negative results driven by a neurovascular uncoupling mechanism. Seeding from the nontumor hemisphere may attenuate asymmetry in patients with tumors near ipsilateral hand motor cortices.
© RSNA, 2020

Summary
Resting-state functional MRI in patients with glioma showed loss of symmetry of hand motor resting-state connectivity that is related to tumor position, grade, and perfusion and that was partially corrected in some patients by specific seeding methodologies.
Key Results
■ In comparison with healthy control subjects, there was greater loss of symmetry of hand motor resting-state connectivity in patients with glioma (P < .05) in a manner related to tumor characteristics, including position, grade, and perfusion.
■ Perfusion analyses in patients with high-grade tumors close to the ipsilateral hand motor region showed a relationship between tumor perfusion and loss of symmetry of hand motor resting-state connectivity (R = 0.74, P < .01), suggesting a possible false-negative signal driven by a neurovascular uncoupling mechanism.
■ In patients with tumors close to the ipsilateral hand motor region, seeding the nontumor hemisphere when using seed-based correlational analyses attenuated loss of symmetry of hand motor resting-state connectivity when compared with seeding the tumor hemisphere (connectivity seeded:contralateral = 1.34 nontumor vs 1.38 tumor hemisphere seeded; P = .03, false discovery rate threshold = 0.01).
Introduction
Resting-state functional MRI is a technique that allows for the generation of functional MRI data while the patient is at rest (1). This technique depicts low-frequency blood oxygenation level–dependent (BOLD) signal fluctuation in the brain at rest and extracts regions with highly correlated resting-state time courses to form larger-scale “resting-state networks” that correspond to known functional networks and anatomic areas, including visual, motor, and language pathways (2,3). Resting-state functional MRI offers substantial potential as a clinical tool for the treatment of patients with brain tumors. Compared with traditional paradigm-driven functional MRI, resting-state functional MRI obviates task compliance from patients who are functionally impaired, allows the parallel assessment of functional networks in place of serial assessment across lengthy imaging sessions (2), and has been shown to more accurately identify anatomic correlates of functional regions (4,5). Resting-state functional MRI has also been successfully piloted in peri- and intraoperative settings (6–8).
BOLD functional MRI studies have shown that brain tumors exert local effects that reduce BOLD functional MRI activation, through a hypothesized uncoupling of tumor vascular responses and neural activity: “neurovascular uncoupling” (9). Neurovascular uncoupling may lead to tumor-induced false-negative results that belie true local neural activity and cause false interpretations of pseudodominance in functional cortices (10,11). Recent investigations (12–15) suggest that neurovascular uncoupling may also impact resting-state functional MRI dynamics; however, further measures are needed to better characterize these tumor effects, including larger sample sizes, measures of perfusion, and well-balanced control comparisons. Additionally, more insight is needed into how tumor pathologic features and characteristics may modulate these effects and how analytical methodologies can compensate for potential false-negative findings.
The purpose of this study was to investigate the association between tumors and tumor characteristics, such as tumor position and grade, and changes in bilateral resting-state connectivity in hand motor regions of primary motor cortices (PMCs), to explore neurovascular uncoupling as an underlying mechanism, and to evaluate seeding methodologies as tools for compensating for these changes. We hypothesized that (a) bilateral hand motor resting-state connectivity in PMCs would be less symmetrical in patients with glioma, (b) this reduction in symmetry of resting-state connectivity would be related to tumor distance from the ipsilateral hand motor (IHM) region, (c) differences in tumor perfusion could mechanistically explain this association in high-grade tumors in a manner consistent with a neurovascular uncoupling effect, and (d) this reduction in the symmetry of resting-state connectivity could be partially attenuated through variations in seeding methodology.
Materials and Methods
This observational and retrospective case-control study was approved by our institutional review board (#16-1129) and complied with Health Insurance Portability and Accountability Act regulations. The requirement to obtain written informed consent was waived.
Study Sample
Data in a total of 45 adult patients with unihemispheric gliomas with valid resting-state functional MRI studies were analyzed from a pool of 137 patients who underwent imaging protocols as part of their presurgical work-up and were recorded in a database between January 2016 and July 2017. Figure 1 shows the patient selection flowchart. Ten healthy control subjects were selected from the Nathan Kline Institute–Rockland Sample (16) on the basis of age, sex, and handedness of the overall patient sample. A summary of study group characteristics is shown in Table 1. Sample size was based on suggestions for sufficiently powered functional MRI studies ranging from more than 12 to more than 50 (17,18).
Figure 1:

Patient flowchart.
Table 1:
Study Group and Tumor Characteristics

Image Acquisition
Patients underwent resting-state functional MRI with a 3.0-T imaging unit (750 W, GE Healthcare, Chicago, Ill) and a gradient-echo echo-planar imaging sequence (repetition time msec/echo time msec, 2500/32; 64 × 64 matrix; 4-mm section thickness; 80° flip angle; 7-minute acquisitions). Images in control subjects were obtained by using a 3.0-T Magnetom imaging unit (Siemens Healthineers, Erlangen, Germany) and an echo-planar imaging sequence (2500/30; 64 × 64 matrix; 3-mm section thickness; 10-minute acquisitions). T1-weighted anatomic images for patients and control subjects were obtained with spoiled gradient-recalled and high-resolution three-dimensional magnetization-prepared rapid acquisition with gradient-echo sequences. Dynamic gadobutrol (Bayer Healthcare, Whippany, NJ) contrast material–enhanced MRI for patients was performed with a spoiled gradient-recalled sequence (4–5/1–2; matrix, 128 × 128; 25° flip angle; temporal resolution, 4–5 seconds).
Resting-State Connectivity Maps
Analysis was performed with Analysis of Functional NeuroImages (National Institute of Mental Health, Bethesda, Md [19]). Spike removal, motion correction, linear trend removal, and spatial smoothing using a Gaussian filter (6-mm full width at half maximum) were applied. Spontaneous low-frequency fluctuations (0.01–0.08 Hz) were filtered to extract functional integration. Images were read in unblinded random order by a trainee with 1 year of neuroradiology research experience (H.S.), with assistance with region of interest (ROI) placement and tumor center identification from a neuroradiologist with more than 20 years of experience (A.I.H.) and a physicist with more than 15 years of experience (K.K.P.).
The motor resting-state network was chosen because it exhibits robust symmetric connectivity in healthy individuals (1,20). Seed-based correlation analysis (SCA) was performed from the hand motor areas of left or right PMC or from the supplementary motor area. Hand motor regions were seeded with 5-voxel ROIs on the basis of anatomic landmarks (reverse-Ω sign [21]). The supplementary motor area was seeded with 4-voxel ROIs (2 voxels each side; Fig 2a).
Figure 2a:

Demonstration of analytic method. Matching anatomic reference images were derived from T1-weighted, fluid-attenuated inversion recovery, T2-weighted, and T1 postcontrast images in the axial plane, while seed-based correlation analysis (SCA) was performed on resting-state functional MRI image series. (a) Representative T2-weighted image in 39-year-old man (patient 23 in Table E1 [online]) highlights typical seed locations and distributions used for SCA. Shown are 5-voxel seed groups placed in the left and right primary motor cortices (PMCs) (anatomically localized by the hand motor reverse-Ω sign) and 4-voxel seeds placed in the supplementary motor area bilaterally. (b) Representative T1-weighted image in 59-year-old woman (patient 15) highlights typical regions of interest (delineated by the superimposed green areas) drawn in the PMCs for analysis of resting-state connectivity. (c) Representative T1-weighted image in 45-year-old man (patient 4) shows a typical resting-state connectivity map derived from SCA performed on a patient’s resting-state functional MRI image series. Red and yellow voxels = areas of moderate (red) and high (yellow) correlation with the seed voxels (thresholds for visualization were user adjusted and differed between images to best highlight connectivity).
Figure 2c:

Demonstration of analytic method. Matching anatomic reference images were derived from T1-weighted, fluid-attenuated inversion recovery, T2-weighted, and T1 postcontrast images in the axial plane, while seed-based correlation analysis (SCA) was performed on resting-state functional MRI image series. (a) Representative T2-weighted image in 39-year-old man (patient 23 in Table E1 [online]) highlights typical seed locations and distributions used for SCA. Shown are 5-voxel seed groups placed in the left and right primary motor cortices (PMCs) (anatomically localized by the hand motor reverse-Ω sign) and 4-voxel seeds placed in the supplementary motor area bilaterally. (b) Representative T1-weighted image in 59-year-old woman (patient 15) highlights typical regions of interest (delineated by the superimposed green areas) drawn in the PMCs for analysis of resting-state connectivity. (c) Representative T1-weighted image in 45-year-old man (patient 4) shows a typical resting-state connectivity map derived from SCA performed on a patient’s resting-state functional MRI image series. Red and yellow voxels = areas of moderate (red) and high (yellow) correlation with the seed voxels (thresholds for visualization were user adjusted and differed between images to best highlight connectivity).
Analysis of Tumor Associations
For the purposes of analysis, one hemisphere in each control subject was designated for comparison with a patient’s tumor hemisphere, based on the proportion of left-sided versus right-sided tumors (patients: n = 28 left sided, n = 17 right sided; control subjects: n = 6 left-sided comparison, n = 4 right-sided comparison).
Correlation maps were converted to normal distribution by using Fisher r-to-z transformation, enabling detection of regions with significant functional connectivity (P < .0001).
As a measure of the degree of supra-threshold voxel connectivity in the hand motor region, two-dimensional ROIs were drawn over the hand motor PMC (Fig 2b), and the proportion of voxels with connectivity above the threshold of significant functional connectivity relative to the total number of voxels within the ROI was obtained.
Figure 2b:
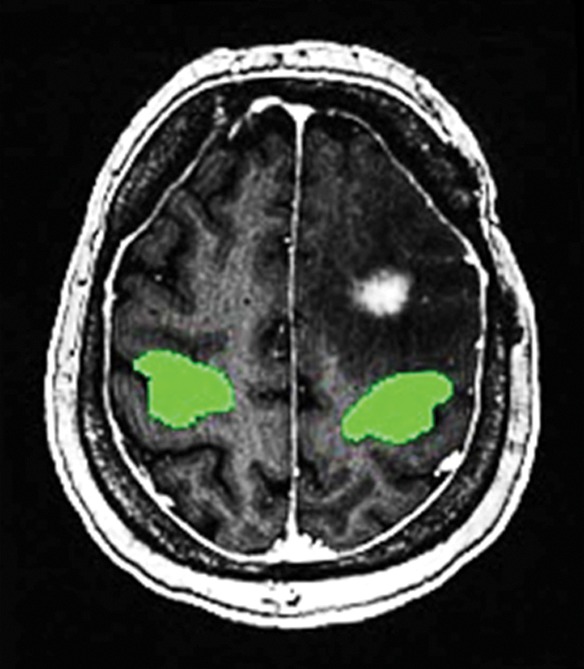
Demonstration of analytic method. Matching anatomic reference images were derived from T1-weighted, fluid-attenuated inversion recovery, T2-weighted, and T1 postcontrast images in the axial plane, while seed-based correlation analysis (SCA) was performed on resting-state functional MRI image series. (a) Representative T2-weighted image in 39-year-old man (patient 23 in Table E1 [online]) highlights typical seed locations and distributions used for SCA. Shown are 5-voxel seed groups placed in the left and right primary motor cortices (PMCs) (anatomically localized by the hand motor reverse-Ω sign) and 4-voxel seeds placed in the supplementary motor area bilaterally. (b) Representative T1-weighted image in 59-year-old woman (patient 15) highlights typical regions of interest (delineated by the superimposed green areas) drawn in the PMCs for analysis of resting-state connectivity. (c) Representative T1-weighted image in 45-year-old man (patient 4) shows a typical resting-state connectivity map derived from SCA performed on a patient’s resting-state functional MRI image series. Red and yellow voxels = areas of moderate (red) and high (yellow) correlation with the seed voxels (thresholds for visualization were user adjusted and differed between images to best highlight connectivity).
As a measure of the strength of connectivity between regions, spherical ROIs (radius, 5 mm) were placed in areas near the IHM region that were highly correlated with the seed ROI (based on the generated correlation map), and the average correlation value across all voxels in the spherical ROI was obtained.
Tumor distance was defined as the Pythagorean distance ( ) between the approximate tumor center and the center of the IHM seed ROI (all patients: median = 41 mm). Tumor center was visually approximated on the basis of the center section of enhancing tumors. Tumors with centers 40 mm or less and tumors with centers more than 40 mm from the IHM ROI were designated “near” and “far,” respectively, with distance definitions guided by the patient sample median distance and motivated by creating relatively even patient subgroup sample sizes and testing a simple threshold that could be potentially applied in clinical practice.
Ratios of supra-threshold voxel connectivity and average correlation within the anatomic or spherical ROI were taken between seeded and nonseeded hemispheres and were compared between control subjects, patients with far tumors, and patients with near tumors. On the basis of the distribution of the dependent variable, data for the patient groups in this analysis were log transformed prior to the generation of P values.
Analysis of Resting-State BOLD Time Courses
Averaged time courses were taken from the SCA seed voxels in each PMC, or from all voxels within a spherical ROI placed in a highly correlated area near each hand motor region. Time courses were cross correlated at lag time t = 0 and at the lag time when time courses were maximally correlated.
Analysis of Tumor Distance
SCA for dedicated distance analysis was derived from supplementary motor area seeding. Tumor distance was correlated with ratios of hand motor supra-threshold voxel connectivity or average correlation.
Analysis of Seeding Location
The ratio of hand motor supra-threshold voxel connectivity or average correlation between the seeded and contralateral hemisphere was calculated when seeding the tumor hemisphere and was compared with the same ratio when seeding the nontumor hemisphere.
Analysis of Tumor Perfusion
Dynamic contrast-enhanced MRI analysis was performed by using software (NordicICE; NordicNeuroLab, Bergen, Norway). The supplementary motor area was seeded, ROIs were drawn around the tumor in the image section containing the tumor center, and averages of plasma volume were measured based on the Toft pharmacokinetic model (22). Plasma volume was correlated with ratios of hand motor supra-threshold voxel connectivity or average correlation. Tumor perfusion data were not available for one patient, who was excluded from this analysis.
Statistical Analysis
Statistical analyses were performed with R 3.5.0 (R Foundation), Excel 2016 (Microsoft, Redmond, Wash), and JMP 13.0 (SAS Institute, Cary, NC) software, with statistical significance defined by P < .05. One-tailed paired t tests were performed for pairwise comparisons, while one-way analysis of variance (Kruskal-Wallis for data sets that were nonparametric and not transformed) was performed when comparing more than two groups, with Wilcoxon rank-sum analysis determining significant post hoc pairwise interactions. Time-course correlational analyses were performed by using the Pearson correlation coefficient, and other correlations were performed by using the Spearman rank correlation coefficient. To minimize the impact of multiple testing, the Benjamini-Hochberg method was used to control the false discovery rate (FDR) (23).
Results
Study Sample
This study included 45 patients (mean age, 51.3 years ± 14.3 [standard deviation]; range, 22–78 years; 27 men, 18 women) with gliomas of varying grades (n = 13 World Health Organization [WHO] grade II, n = 11 WHO grade III, n = 21 WHO grade IV) and 10 healthy control subjects (mean age, 50.3 years ± 17.2; range, 22–79 years; six men, four women). Patients were stratified by tumor distance (“far,” “near”) and pathologic nature (grade II/III, grade IV/glioblastoma multiforme [GBM]) into four distance-grade combinations (n = 14 “far,” grade II/III; n = 10 “far,” grade IV; n = 10 “near,” grade II/III; and n = 11 “near,” grade IV). All included patients had single tumors in the brain and did not have metastatic brain disease. Demographic information and tumor characteristics of patients are provided in Table 1 and Table E1 (online).
Analysis of Tumor Associations
Patients with brain tumors were found to have disruption in the bilateral symmetry of hand motor resting-state connectivity derived from SCA. In all comparisons, control subjects displayed bilateral activity that was nearly symmetrical (Fig 3). In addition, regardless of whether the seed was placed on the tumor or nontumor side, there were significant bilateral differences in hand motor supra-threshold voxel connectivity and average correlation between control subjects, patients with “far” tumors, and patients with “near” tumors (P < .05). Post hoc tests for each analysis showed significant differences in hand motor supra-threshold voxel connectivity (Fig 3a) and average correlation (Fig 3b) between control subjects and patients in both distance groups (P < .05) but not between patients with “far” tumors and patients with “near” tumors (P > .05). Quantitative data for this analysis are shown in Table 2.
Figure 3a:

Box-and-whisker plots for comparison of bilateral resting-state hand motor connectivity in control subjects and patients with glioma with “far” (>40 mm from ipsilateral primary motor cortex [PMC]) and “near” (≤40 mm from ipsilateral PMC) tumors. Plots were derived from seed-based correlation analysis (SCA) seeded from hand motor regions. Plots show ratios of (a) hand motor supra-threshold voxel connectivity and (b) hand motor average correlation between seed placement in tumor hemisphere and seed placement in nontumor hemisphere. Lower and upper limits of the box = the 1st and 3rd quartiles (respectively), central line in the box = the median, and the length of each whisker = 1.5 times the interquartile range. The ratio of hand motor supra-threshold voxel connectivity and hand motor average correlation between the seeded hemisphere and the contralateral hemisphere was significantly greater in both patients with “far” and “near” tumors than in control subjects, for SCA seeding the tumor hemisphere and seeding the nontumor hemisphere. * P < .05.
Figure 3b:

Box-and-whisker plots for comparison of bilateral resting-state hand motor connectivity in control subjects and patients with glioma with “far” (>40 mm from ipsilateral primary motor cortex [PMC]) and “near” (≤40 mm from ipsilateral PMC) tumors. Plots were derived from seed-based correlation analysis (SCA) seeded from hand motor regions. Plots show ratios of (a) hand motor supra-threshold voxel connectivity and (b) hand motor average correlation between seed placement in tumor hemisphere and seed placement in nontumor hemisphere. Lower and upper limits of the box = the 1st and 3rd quartiles (respectively), central line in the box = the median, and the length of each whisker = 1.5 times the interquartile range. The ratio of hand motor supra-threshold voxel connectivity and hand motor average correlation between the seeded hemisphere and the contralateral hemisphere was significantly greater in both patients with “far” and “near” tumors than in control subjects, for SCA seeding the tumor hemisphere and seeding the nontumor hemisphere. * P < .05.
Table 2:
Interhemispheric Ratios of Resting-State Functional MRI Connectivity in Hand Motor PMC

Analysis of Resting-State BOLD Time Courses
Analysis of resting-state BOLD time courses revealed a reduction in the correlation between the PMCs of the tumor and nontumor hemispheres of patients compared with control subjects. This finding was not dependent on distance and did not support a temporal uncoupling of bilateral connectivity.
Examination of time lags at which hand motor resting-state time courses in both hemispheres were maximally correlated showed there was no significant difference between control subjects, patients with “far” tumors, and patients with “near” tumors (P > .05 for all tests). The correlation between hand motor time courses in the tumor and nontumor hemispheres was subsequently analyzed for each patient, at a lag of t = 0 and at the lag time of maximal correlation between PMCs. After FDR correction, significant differences were found in the mean correlations of the resting-state time courses of the left- and right-hand motor regions between control subjects, patients with “far” tumors, and patients with “near” tumors (at time lag t = 0: P < .01 for all tests; at time lag of maximal correlation: P < .05 for all tests). Bilateral hand motor time courses were highly correlated in control subjects (ie, at a ratio of approximately 1), and post hoc tests showed that the resting-state time courses of the PMCs in the tumor and nontumor hemispheres were significantly less correlated in both patient groups than in control subjects (P < .005 for all tests; Fig 4). The difference between patients with “far” tumors and those with “near” tumors was not significant for all tests. Quantitative data for this analysis are shown in Table 3.
Figure 4a:

Box-and-whisker plots show cross-correlational analysis of resting-state time courses in control subjects and patients with glioma. The plots show that, for average time courses derived from (a) the 5-voxel hand motor seeds used for seed-based correlation analysis (SCA) and (b) spherical regions of interest placed in areas of high hand motor connectivity derived from supplementary motor area–seeded SCA, the correlation between the left and right primary motor cortices (PMCs) resting-state time courses was significantly reduced in patients with “far” (>40 mm from ipsilateral PMC) and “near” (≤ 40 mm from ipsilateral PMC) tumors compared with control subjects, at both a time lag of t = 0 and at the time lag where resting-state time courses were maximally correlated. Lower and upper limits of the box = the 1st and 3rd quartiles (respectively), central line in the box = the median, and the length of each whisker = 1.5 times the interquartile range. BOLD = blood oxygenation level dependent. * P < .01.
Table 3:
Interhemispheric BOLD Time-Course Correlation in Hand Motor PMC

Figure 4b:

Box-and-whisker plots show cross-correlational analysis of resting-state time courses in control subjects and patients with glioma. The plots show that, for average time courses derived from (a) the 5-voxel hand motor seeds used for seed-based correlation analysis (SCA) and (b) spherical regions of interest placed in areas of high hand motor connectivity derived from supplementary motor area–seeded SCA, the correlation between the left and right primary motor cortices (PMCs) resting-state time courses was significantly reduced in patients with “far” (>40 mm from ipsilateral PMC) and “near” (≤ 40 mm from ipsilateral PMC) tumors compared with control subjects, at both a time lag of t = 0 and at the time lag where resting-state time courses were maximally correlated. Lower and upper limits of the box = the 1st and 3rd quartiles (respectively), central line in the box = the median, and the length of each whisker = 1.5 times the interquartile range. BOLD = blood oxygenation level dependent. * P < .01.
Analysis of Tumor Distance
Tumors closer to the IHM region were correlated with a greater decrease in both the degree of supra-threshold voxel connectivity and the overall strength of resting-state connectivity in the ipsilateral PMC when seeding from a common motor input region (the supplementary motor area). In the analyses of both supra-threshold voxel connectivity and average correlation, a small but significant positive correlation was observable between the bilateral symmetry of resting-state connectivity and tumor distance from the ipsilateral PMC (Fig 5a, 5b; supra-threshold voxel connectivity: R = 0.38, P = .01, Fig 5d; average correlation: R = 0.33, P = .03, Fig 5e).
Figure 5a:

Changes in bilateral resting-state hand motor connectivity as a function of tumor distance from the ipsilateral primary motor cortex (PMC), derived from seed-based correlation analysis (SCA) seeded from the supplementary motor area. Matching anatomic reference images were derived from images from T1-weighted postcontrast MRI in the axial plane, while SCA was performed on an image series from resting-state functional MRI. (a–c) Representative images show (a) symmetrical patterns of resting-state connectivity in a 45-year-old man (patient 4) with a tumor “far” (>40 mm) from the ipsilateral hand-motor (IHM) region and (b, c) loss of symmetry of resting-state connectivity (b) and task-based blood oxygenation level–dependent functional MRI activation (c) in a 45-year-old man (patient 45) with a tumor “near” (≤40 mm from) the IHM region. Red and yellow voxels = areas of moderate (red) and high (yellow) correlation with seed voxels (thresholds for visualization were user adjusted and differed between images to best highlight connectivity). (d, e) Graphs show ratios of (d) hand-motor supra-threshold voxel connectivity and (e) average correlation between the hand motor regions of the tumor and nontumor hemispheres plotted against the distance of each patient’s tumor from the ipsilateral PMC. Tumor distance showed a positive correlation with loss of symmetry (ie, deviation of the ratio from 1) of hand motor supra-threshold voxel connectivity (R = 0.38, P = .01) and hand motor average correlation (R = 0.33, P = .03).
Figure 5b:

Changes in bilateral resting-state hand motor connectivity as a function of tumor distance from the ipsilateral primary motor cortex (PMC), derived from seed-based correlation analysis (SCA) seeded from the supplementary motor area. Matching anatomic reference images were derived from images from T1-weighted postcontrast MRI in the axial plane, while SCA was performed on an image series from resting-state functional MRI. (a–c) Representative images show (a) symmetrical patterns of resting-state connectivity in a 45-year-old man (patient 4) with a tumor “far” (>40 mm) from the ipsilateral hand-motor (IHM) region and (b, c) loss of symmetry of resting-state connectivity (b) and task-based blood oxygenation level–dependent functional MRI activation (c) in a 45-year-old man (patient 45) with a tumor “near” (≤40 mm from) the IHM region. Red and yellow voxels = areas of moderate (red) and high (yellow) correlation with seed voxels (thresholds for visualization were user adjusted and differed between images to best highlight connectivity). (d, e) Graphs show ratios of (d) hand-motor supra-threshold voxel connectivity and (e) average correlation between the hand motor regions of the tumor and nontumor hemispheres plotted against the distance of each patient’s tumor from the ipsilateral PMC. Tumor distance showed a positive correlation with loss of symmetry (ie, deviation of the ratio from 1) of hand motor supra-threshold voxel connectivity (R = 0.38, P = .01) and hand motor average correlation (R = 0.33, P = .03).
Figure 5d:

Changes in bilateral resting-state hand motor connectivity as a function of tumor distance from the ipsilateral primary motor cortex (PMC), derived from seed-based correlation analysis (SCA) seeded from the supplementary motor area. Matching anatomic reference images were derived from images from T1-weighted postcontrast MRI in the axial plane, while SCA was performed on an image series from resting-state functional MRI. (a–c) Representative images show (a) symmetrical patterns of resting-state connectivity in a 45-year-old man (patient 4) with a tumor “far” (>40 mm) from the ipsilateral hand-motor (IHM) region and (b, c) loss of symmetry of resting-state connectivity (b) and task-based blood oxygenation level–dependent functional MRI activation (c) in a 45-year-old man (patient 45) with a tumor “near” (≤40 mm from) the IHM region. Red and yellow voxels = areas of moderate (red) and high (yellow) correlation with seed voxels (thresholds for visualization were user adjusted and differed between images to best highlight connectivity). (d, e) Graphs show ratios of (d) hand-motor supra-threshold voxel connectivity and (e) average correlation between the hand motor regions of the tumor and nontumor hemispheres plotted against the distance of each patient’s tumor from the ipsilateral PMC. Tumor distance showed a positive correlation with loss of symmetry (ie, deviation of the ratio from 1) of hand motor supra-threshold voxel connectivity (R = 0.38, P = .01) and hand motor average correlation (R = 0.33, P = .03).
Figure 5e:

Changes in bilateral resting-state hand motor connectivity as a function of tumor distance from the ipsilateral primary motor cortex (PMC), derived from seed-based correlation analysis (SCA) seeded from the supplementary motor area. Matching anatomic reference images were derived from images from T1-weighted postcontrast MRI in the axial plane, while SCA was performed on an image series from resting-state functional MRI. (a–c) Representative images show (a) symmetrical patterns of resting-state connectivity in a 45-year-old man (patient 4) with a tumor “far” (>40 mm) from the ipsilateral hand-motor (IHM) region and (b, c) loss of symmetry of resting-state connectivity (b) and task-based blood oxygenation level–dependent functional MRI activation (c) in a 45-year-old man (patient 45) with a tumor “near” (≤40 mm from) the IHM region. Red and yellow voxels = areas of moderate (red) and high (yellow) correlation with seed voxels (thresholds for visualization were user adjusted and differed between images to best highlight connectivity). (d, e) Graphs show ratios of (d) hand-motor supra-threshold voxel connectivity and (e) average correlation between the hand motor regions of the tumor and nontumor hemispheres plotted against the distance of each patient’s tumor from the ipsilateral PMC. Tumor distance showed a positive correlation with loss of symmetry (ie, deviation of the ratio from 1) of hand motor supra-threshold voxel connectivity (R = 0.38, P = .01) and hand motor average correlation (R = 0.33, P = .03).
Figure 5c:

Changes in bilateral resting-state hand motor connectivity as a function of tumor distance from the ipsilateral primary motor cortex (PMC), derived from seed-based correlation analysis (SCA) seeded from the supplementary motor area. Matching anatomic reference images were derived from images from T1-weighted postcontrast MRI in the axial plane, while SCA was performed on an image series from resting-state functional MRI. (a–c) Representative images show (a) symmetrical patterns of resting-state connectivity in a 45-year-old man (patient 4) with a tumor “far” (>40 mm) from the ipsilateral hand-motor (IHM) region and (b, c) loss of symmetry of resting-state connectivity (b) and task-based blood oxygenation level–dependent functional MRI activation (c) in a 45-year-old man (patient 45) with a tumor “near” (≤40 mm from) the IHM region. Red and yellow voxels = areas of moderate (red) and high (yellow) correlation with seed voxels (thresholds for visualization were user adjusted and differed between images to best highlight connectivity). (d, e) Graphs show ratios of (d) hand-motor supra-threshold voxel connectivity and (e) average correlation between the hand motor regions of the tumor and nontumor hemispheres plotted against the distance of each patient’s tumor from the ipsilateral PMC. Tumor distance showed a positive correlation with loss of symmetry (ie, deviation of the ratio from 1) of hand motor supra-threshold voxel connectivity (R = 0.38, P = .01) and hand motor average correlation (R = 0.33, P = .03).
Analysis of Tumor Perfusion
Perfusion in high-grade tumors near the PMC was found to be correlated with reduced symmetry in the strength of hand motor resting-state connectivity. Spearman correlations between tumor perfusion and interhemispheric ratios of resting-state connectivity were nonsignificant for patient subgroups with grade II/III "far” tumors (supra-threshold voxel connectivity: R = 0.12, P = .68; average correlation: R = 0.23, P = .43), grade IV far tumors (supra-threshold voxel connectivity: R = 0.08, P = .83; average correlation: R = 0.09, P = .80), and grade II/III near tumors (supra-threshold voxel connectivity: R = 0.50, P = .17; average correlation: R = 0.43, P = .24), regardless of the measure of connectivity (Fig E1a–E1c [online]). In patients with grade IV near tumors, no significant relationship was found between tumor perfusion and ratios of supra-threshold voxel connectivity (R = 0.48, P = .13; Fig E1c [online]), while tumor perfusion and ratios of hand motor average correlation were found to be significantly inversely correlated (R = 0.74, P < .01; Fig 6).
Figure 6:

Graph shows changes in bilateral resting-state hand motor connectivity as a function of tumor perfusion, grouped by tumor grade (grade II/III glioma vs grade IV glioblastoma multiforme [GBM]). Filled circles = grade II/III gliomas, while open triangles = grade IV GBMs. All ratios were calculated between the hand motor regions of the tumor and nontumor hemispheres. In tumors “near” (≤40 mm from) the ipsilateral primary motor cortex, tumor perfusion was not significantly correlated with the ratio of hand motor average correlation in grade II/III gliomas (grade II/III gliomas: R2 = 0.19, P = .24) but was significantly correlated with the ratio of hand motor average correlation in grade IV GBMs (grade IV gliomas: R2 = 0.54, P < .01). VP = volume of tumor perfusion.
Analysis of Seeding Location
In patients with tumors “near” the PMC, seeding from the nontumor hemisphere yielded more symmetric hand motor resting-state connectivity, compared with seeding from the tumor hemisphere. In the comparison of seeding of SCA from the tumor hemisphere versus from the nontumor hemisphere, patients with tumors near the hand motor region had significant differences in the loss of symmetry of supra-threshold voxel connectivity and interhemispheric ratios of average correlation, with loss of significance after FDR correction (supra-threshold voxel connectivity: P = .046, FDR threshold = 0.02, Fig 7a; average correlation: P = .03, FDR threshold = 0.01, Fig 7b). There was no significant difference in loss of symmetry of resting-state connectivity when seeding from the tumor hemisphere compared with the nontumor hemisphere in control subjects, across all patients, or in patients with tumors “far” from the hand motor region. Quantitative data for this analysis are shown in Table 2.
Figure 7a:

Box-and-whisker plots show changes in bilateral resting-state hand motor connectivity as a function of which hemisphere is seeded for seed-based correlation analysis. Lower and upper limits of the box = the 1st and 3rd quartiles (respectively), central line in the box = the median, and the length of each whisker represents 1.5 times the interquartile range. (a) Ratios of hand motor supra-threshold voxel connectivity between the seeded and contralateral hemispheres derived from seeding of the tumor hemisphere (or the tumor-matched hemisphere, in control subjects) were not significantly different from the same ratios derived from seeding of the nontumor hemisphere (or the nontumor-matched hemisphere, in control subjects) in control subjects, in all patients, and in patients with “far” (>40 mm from ipsilateral primary motor cortex [PMC]) tumors, and were nonsignificant after false discovery rate (FDR) correction in patients with “near” (≤40 mm from ipsilateral PMC) tumors (P = .046, FDR threshold = 0.02). (b) Ratios of average correlation between the seeded and contralateral hemispheres were not significantly different when derived from seeding the tumor hemisphere (or the tumor-matched hemisphere, in control subjects) compared with seeding the nontumor hemisphere (or the nontumor-matched hemisphere, in control subjects) for control subjects, for all patients, and for patients with “far” tumors, and were nonsignificant after FDR correction in patients with “near” tumors (P = .03, FDR threshold = 0.01). * P < .05.
Figure 7b:

Box-and-whisker plots show changes in bilateral resting-state hand motor connectivity as a function of which hemisphere is seeded for seed-based correlation analysis. Lower and upper limits of the box = the 1st and 3rd quartiles (respectively), central line in the box = the median, and the length of each whisker represents 1.5 times the interquartile range. (a) Ratios of hand motor supra-threshold voxel connectivity between the seeded and contralateral hemispheres derived from seeding of the tumor hemisphere (or the tumor-matched hemisphere, in control subjects) were not significantly different from the same ratios derived from seeding of the nontumor hemisphere (or the nontumor-matched hemisphere, in control subjects) in control subjects, in all patients, and in patients with “far” (>40 mm from ipsilateral primary motor cortex [PMC]) tumors, and were nonsignificant after false discovery rate (FDR) correction in patients with “near” (≤40 mm from ipsilateral PMC) tumors (P = .046, FDR threshold = 0.02). (b) Ratios of average correlation between the seeded and contralateral hemispheres were not significantly different when derived from seeding the tumor hemisphere (or the tumor-matched hemisphere, in control subjects) compared with seeding the nontumor hemisphere (or the nontumor-matched hemisphere, in control subjects) for control subjects, for all patients, and for patients with “far” tumors, and were nonsignificant after FDR correction in patients with “near” tumors (P = .03, FDR threshold = 0.01). * P < .05.
Discussion
In this study, we investigated the association between tumors and tumor characteristics with changes in resting-state connectivity in hand motor regions. Seed-based and resting-state time course analyses demonstrated significant loss of symmetry of the degree of supra-threshold voxel connectivity and the strength of resting-state connectivity between hand motor regions in patients with glioma. This tumor-associated asymmetry of resting-state connectivity correlated with tumor distance from the ipsilateral hand motor (IHM) region across all patients and with the degree of tumor perfusion in patients with glioblastomas multiforme (GBMs) 40 mm or less from the IHM region. In patients with gliomas 40 mm or less from the IHM region, this reduction in the symmetry of resting-state connectivity may be attenuated by seeding the nontumor hemisphere during seed-based analysis.
Our findings showed a relationship between tumor pathologic nature and an apparent loss of symmetry of resting-state connectivity, consistent with findings from prior studies and contributing to a nascent body of literature that links tumor pathologic findings to apparent disruptions in bilateral resting-state networks (13,24–27). In examining the possible presence of tumor-associated temporal uncoupling of bilateral connectivity, cross-correlational analyses of hand motor resting-state time courses showed no significant differences in BOLD signal time lags between tumor and nontumor motor regions in patients with glioma.
The finding that loss of symmetry of resting-state connectivity correlates with tumor proximity to the IHM region implies a role for local tumor-mediated effects in inducing apparent reductions in resting-state connectivity in the tumor hemisphere. High degrees of aberrant angiogenesis are a hallmark of GBMs (28) and have been hypothesized to contribute to a loss of cerebrovascular autoregulation, subsequently leading to an absence of normal vasodilation during increased neural activity and a false-negative muting of functional MRI signal near the tumor (“neurovascular uncoupling” [9]). Neurovascular uncoupling has been documented in high-grade gliomas in BOLD functional MRI analyses (29,30) and at breath-hold BOLD imaging (11,31). The incorporation of dynamic contrast-enhanced MRI to measure tumor perfusion has previously been used to demonstrate neurovascular uncoupling in other modalities (29,32–34), and our findings are concordant with previous studies that have examined neurovascular uncoupling in resting-state functional MRI in smaller cohorts (12,14,15). Methodologic differences in our study included a larger sample size, inclusion of healthy control subjects, the use of dynamic contrast-enhanced MRI to measure tumor perfusion, and subset analyses of patients based on tumor grading and distance. Our results for low-grade tumors suggest that they also contribute to a distance-dependent loss in symmetry of resting-state connectivity, but through a mechanism not directly related to tumor perfusion such as neurovascular uncoupling secondary to alternative tumor-induced mechanisms such as astrocytic dysfunction and gliovascular interactions (32,33,35). While the clinical significance of resting-state functional MRI is still being actively investigated, radiologists should be wary that gliomas may cause false-negative signals in resting-state functional MRI as in task-based functional MRI. The possibility of false-negative signals and negative clinical consequences such as the unintended surgical resection of functional brain areas should be conveyed to neurosurgical colleagues.
Finally, we found that seeding from the nontumor hemisphere may partially compensate for tumor-associated loss of symmetry of resting-state connectivity and false-negative results in tumors 40 mm or less from the IHM region, regardless of hypothesized differences in driving mechanisms between low- and high-grade tumors, although significance was lost once FDR correction was applied. These results are concordant with those from small-cohort studies suggesting that variations in seeding location in SCA can significantly affect derived results (12,36). Refinement of these methods and studies with larger sample sizes may help provide personalized clinical care for patients that more accurately portrays functional activity and supports current practice at many institutions where seeding for presurgical mapping is initiated in the nontumor hemisphere.
Our study had limitations. First, resting-state connectivity maps derived from SCA are strongly affected by seed location and methods used to extract the results (36), particularly when seeding ipsilesionally, as pathologic factors such as tumor invasion may contribute to inaccurate ROI placement. We mitigated the impact of this variability by using multiple analytical approaches (including resting-state time-course analyses that were not reliant on seeding) and through localizing seed and ROI placement on the basis of a combination of anatomic correlates, hand motor task-based functional MRI results (when available), and resting-state connectivity maps. In addition, a few patients had direct tumor invasion of the PMC that distorted anatomic landmarks used for placement of hand motor ROIs. Another important limitation of our study was the use of T1-weighted dynamic contrast-enhanced MRI to determine tumor perfusion, which has been shown to be less effective in depicting neurovascular uncoupling in low-grade gliomas driven by nonangiogenic mechanisms (33) and thus cannot help definitively rule out such an effect in the grade II and III gliomas studied. Another limitation was that our results may have been affected by sample size, particularly in subgroup analyses based on distance and tumor grade (eg, patients with “near” high-grade gliomas), where significant findings were seen across a relatively small range of tumor perfusion values and would benefit from the addition of more patients with highly perfused high-grade gliomas. One particular statistical drawback was that the sample size limited our ability to adequately test three-way interactions. While this is a valid concern and findings should be replicated in larger cohorts, subgroup sample sizes were similar to or exceeded cohort sizes in many previous studies performing comparable subgroup analyses (11,13,29,37,38). In addition, an imbalance in the case-control ratio due to a low control sample—chosen because symmetric resting-state connectivity is a well-established phenomenon in healthy people (1)—meant that 1:1 matching was not performed between patients and control subjects. Another limitation was the use of a median split method to define tumor distances from the hand motor region. This method was chosen for the simplicity of potential clinical application and for even distribution of patient samples but has known statistical flaws (39,40) warranting further investigation. Finally, in an analysis based on distance calculated from the center of the tumor, tumor size or margins may confound the correlation between symmetry of connectivity and parameters such as perfusion and tumor distance. The decision to define distance from the center of the tumor was made because tumor margins are often highly irregular. Furthermore, a comparison of subgroups defined by distance remeasured from the tumor margin closest to the ipsilateral PMC, with tumors recategorized as “near” (<30 mm from ipsilateral PMC) or “far” (>30 mm from ipsilateral PMC), showed that these two methods of defining tumor distances would yield similar subgroups of patients (Fisher exact test, P < .001). A separate concordance reader study may also have utility in determining the reliability of measuring distance from the tumor edge compared with the tumor center, helping refine this method for clinical practice.
There are several techniques that can be incorporated into future studies to build on and address limitations in our study. Independent component analysis, a data-driven multivariate method that reveals patterns of functional connectivity without requiring seed placement (36,41), has previously been successfully applied to resting-state functional MRI analyses of the PMC and supplementary motor area, with some small-cohort studies suggesting neurovascular uncoupling effects that support the findings of this study (12,14,34,42). BOLD breath-hold mapping of cerebrovascular reactivity has been shown to more effectively demonstrate neurovascular uncoupling in low- and intermediate-grade gliomas (31–33), and we expect concordance with our findings using dynamic contrast-enhanced modalities. Additionally, white matter tractography techniques such as diffusion tensor imaging may help better evaluate the relation between tumor distance from white matter tracts and apparent neurovascular uncoupling effects. Finally, measurement of tumor volume and incorporation of tumor sequencing information (eg, IDH status), with a focus on angiogenic mutations such as vascular endothelial growth factor, may provide important additional information on tumor characteristics.
In conclusion, our study has demonstrated that patients with glioma exhibit alterations in motor resting-state network connectivity in a manner that is related to tumor distance from the ipsilateral hand motor region. Analysis of tumor perfusion measurements suggests that these apparent changes in resting-state connectivity may be false-negative results driven by a neurovascular uncoupling mechanism and that seeding methodology may help compensate for this phenomenon.
SUPPLEMENTAL TABLES
SUPPLEMENTAL FIGURES
Supported by the National Cancer Institute of the National Institutes of Health (R25CA020449, NIH-NIBIB 1RO1EB022720 NIH-NCI U54CA137788/U54CA132378/NIH-NCI 1 R21 CA220144-01, and NIH-NCI P30 CA008748).
The content is solely the responsibility of the authors and does not necessarily represent the official views of the National Institutes of Health.
Disclosures of Conflicts of Interest: H.S. disclosed no relevant relationships. B.V. disclosed no relevant relationships. M.E.L. disclosed no relevant relationships. M.J. disclosed no relevant relationships. J.R.F. disclosed no relevant relationships. Z.Z. disclosed no relevant relationships. A.I.H. Activities related to the present article: disclosed no relevant relationships. Activities not related to the present article: has a partnership with fMRI Consultants, a purely educational entity. Other relationships: disclosed no relevant relationships. K.K.P. disclosed no relevant relationships.
Abbreviations:
- BOLD
- blood oxygenation level dependent
- FDR
- false discovery rate
- GBM
- glioblastoma multiforme
- IHM
- ipsilateral hand motor
- PMC
- primary motor cortex
- ROI
- region of interest
- SCA
- seed-based correlation analysis
- WHO
- World Health Organization
References
- 1.Biswal B, Yetkin FZ, Haughton VM, Hyde JS. Functional connectivity in the motor cortex of resting human brain using echo-planar MRI. Magn Reson Med 1995;34(4):537–541. [DOI] [PubMed] [Google Scholar]
- 2.Lee MH, Smyser CD, Shimony JS. Resting-state fMRI: a review of methods and clinical applications. AJNR Am J Neuroradiol 2013;34(10):1866–1872. [DOI] [PMC free article] [PubMed] [Google Scholar]
- 3.Biswal BB, Mennes M, Zuo X-N, et al. Toward discovery science of human brain function. Proc Natl Acad Sci U S A 2010;107(10):4734–4739. [DOI] [PMC free article] [PubMed] [Google Scholar]
- 4.Dierker D, Roland JL, Kamran M, et al. Resting-state Functional Magnetic Resonance Imaging in Presurgical Functional Mapping: Sensorimotor Localization. Neuroimaging Clin N Am 2017;27(4):621–633. [DOI] [PMC free article] [PubMed] [Google Scholar]
- 5.Han Hao, Yan Yuxiang, Zhou Wenjing, Hong Bo. Sensorimotor network parcellation for pre-surgical patients using low-pass filtered fMRI. Conf Proc IEEE Eng Med Biol Soc 2017;2017:4479–4482. [DOI] [PubMed] [Google Scholar]
- 6.Qiu TM, Gong FY, Gong X, et al. Real-Time Motor Cortex Mapping for the Safe Resection of Glioma: An Intraoperative Resting-State fMRI Study. AJNR Am J Neuroradiol 2017;38(11):2146–2152. [DOI] [PMC free article] [PubMed] [Google Scholar]
- 7.Roder C, Charyasz-Leks E, Breitkopf M, et al. Resting-state functional MRI in an intraoperative MRI setting: proof of feasibility and correlation to clinical outcome of patients. J Neurosurg 2016;125(2):401–409. [DOI] [PubMed] [Google Scholar]
- 8.Sair HI, Agarwal S, Pillai JJ. Application of Resting State Functional MR Imaging to Presurgical Mapping: Language Mapping. Neuroimaging Clin N Am 2017;27(4):635–644. [DOI] [PubMed] [Google Scholar]
- 9.Holodny AI, Schulder M, Liu WC, Wolko J, Maldjian JA, Kalnin AJ. The effect of brain tumors on BOLD functional MR imaging activation in the adjacent motor cortex: implications for image-guided neurosurgery. AJNR Am J Neuroradiol 2000;21(8):1415–1422. [PMC free article] [PubMed] [Google Scholar]
- 10.Peck KK, Bradbury M, Petrovich N, et al. Presurgical evaluation of language using functional magnetic resonance imaging in brain tumor patients with previous surgery. Neurosurgery 2009;64(4):644–652; discussion 652–653. [DOI] [PubMed] [Google Scholar]
- 11.Iranmahboob A, Peck KK, Brennan NP, et al. Vascular reactivity maps in patients with gliomas using breath-holding BOLD fMRI. J Neuroimaging 2016;26(2):232–239. [DOI] [PMC free article] [PubMed] [Google Scholar]
- 12.Agarwal S, Sair HI, Yahyavi-Firouz-Abadi N, Airan R, Pillai JJ. Neurovascular uncoupling in resting state fMRI demonstrated in patients with primary brain gliomas. J Magn Reson Imaging 2016;43(3):620–626. [DOI] [PubMed] [Google Scholar]
- 13.Mallela AN, Peck KK, Petrovich-Brennan NM, Zhang Z, Lou W, Holodny AI. Altered Resting-State Functional Connectivity in the Hand Motor Network in Glioma Patients. Brain Connect 2016;6(8):587–595. [DOI] [PMC free article] [PubMed] [Google Scholar]
- 14.Agarwal S, Sair HI, Airan R, et al. Demonstration of brain tumor-induced neurovascular uncoupling in resting-state fMRI at ultrahigh field. Brain Connect 2016;6(4):267–272. [DOI] [PMC free article] [PubMed] [Google Scholar]
- 15.Agarwal S, Lu H, Pillai JJ. Value of Frequency Domain Resting-State Functional Magnetic Resonance Imaging Metrics Amplitude of Low-Frequency Fluctuation and Fractional Amplitude of Low-Frequency Fluctuation in the Assessment of Brain Tumor-Induced Neurovascular Uncoupling. Brain Connect 2017;7(6):382–389. [DOI] [PMC free article] [PubMed] [Google Scholar]
- 16.Nooner KB, Colcombe SJ, Tobe RH, et al. The NKI-Rockland sample: a model for accelerating the pace of discovery science in psychiatry. Front Neurosci 2012;6:152. [DOI] [PMC free article] [PubMed] [Google Scholar]
- 17.Desmond JE, Glover GH. Estimating sample size in functional MRI (fMRI) neuroimaging studies: statistical power analyses. J Neurosci Methods 2002;118(2):115–128. [DOI] [PubMed] [Google Scholar]
- 18.Yarkoni T. Big Correlations in Little Studies: Inflated fMRI Correlations Reflect Low Statistical Power-Commentary on Vul et al. (2009). Perspect Psychol Sci 2009;4(3):294–298. [DOI] [PubMed] [Google Scholar]
- 19.Cox RW. AFNI: software for analysis and visualization of functional magnetic resonance neuroimages. Comput Biomed Res 1996;29(3):162–173. [DOI] [PubMed] [Google Scholar]
- 20.van den Heuvel MP, Mandl RC, Kahn RS, Hulshoff Pol HE. Functionally linked resting-state networks reflect the underlying structural connectivity architecture of the human brain. Hum Brain Mapp 2009;30(10):3127–3141. [DOI] [PMC free article] [PubMed] [Google Scholar]
- 21.Yousry TA, Schmid UD, Alkadhi H, et al. Localization of the motor hand area to a knob on the precentral gyrus. A new landmark. Brain 1997;120(Pt 1):141–157. [DOI] [PubMed] [Google Scholar]
- 22.Tofts PS, Brix G, Buckley DL, et al. Estimating kinetic parameters from dynamic contrast-enhanced T(1)-weighted MRI of a diffusable tracer: standardized quantities and symbols. J Magn Reson Imaging 1999;10(3):223–232. [DOI] [PubMed] [Google Scholar]
- 23.Benjamini Y, Hochberg Y. Controlling the False Discovery Rate: A Practical and Powerful Approach to Multiple Testing. J R Stat Soc B 1995;57(1):289–300. [Google Scholar]
- 24.Harris RJ, Bookheimer SY, Cloughesy TF, et al. Altered functional connectivity of the default mode network in diffuse gliomas measured with pseudo-resting state fMRI. J Neurooncol 2014;116(2):373–379. [DOI] [PMC free article] [PubMed] [Google Scholar]
- 25.Niu C, Zhang M, Min Z, et al. Motor network plasticity and low-frequency oscillations abnormalities in patients with brain gliomas: a functional MRI study. PLoS One 2014;9(5):e96850 [Published correction appears in PLoS One 2014;9(8):e105134.]. [DOI] [PMC free article] [PubMed] [Google Scholar]
- 26.Wood JM, Kundu B, Utter A, et al. Impact of brain tumor location on morbidity and mortality: a retrospective functional MR imaging study. AJNR Am J Neuroradiol 2011;32(8):1420–1425. [DOI] [PMC free article] [PubMed] [Google Scholar]
- 27.Bailey PD, Zacà D, Basha MM, et al. Presurgical fMRI and DTI for the Prediction of Perioperative Motor and Language Deficits in Primary or Metastatic Brain Lesions. J Neuroimaging 2015;25(5):776–784. [DOI] [PubMed] [Google Scholar]
- 28.Hardee ME, Zagzag D. Mechanisms of glioma-associated neovascularization. Am J Pathol 2012;181(4):1126–1141. [DOI] [PMC free article] [PubMed] [Google Scholar]
- 29.Hou BL, Bradbury M, Peck KK, Petrovich NM, Gutin PH, Holodny AI. Effect of brain tumor neovasculature defined by rCBV on BOLD fMRI activation volume in the primary motor cortex. Neuroimage 2006;32(2):489–497. [DOI] [PubMed] [Google Scholar]
- 30.Jiang Z, Krainik A, David O, et al. Impaired fMRI activation in patients with primary brain tumors. Neuroimage 2010;52(2):538–548. [DOI] [PubMed] [Google Scholar]
- 31.Pillai JJ, Mikulis DJ. Cerebrovascular reactivity mapping: an evolving standard for clinical functional imaging. AJNR Am J Neuroradiol 2015;36(1):7–13. [DOI] [PMC free article] [PubMed] [Google Scholar]
- 32.Pillai JJ, Zacá D. Clinical utility of cerebrovascular reactivity mapping in patients with low grade gliomas. World J Clin Oncol 2011;2(12):397–403. [DOI] [PMC free article] [PubMed] [Google Scholar]
- 33.Pillai JJ, Zacà D. Comparison of BOLD cerebrovascular reactivity mapping and DSC MR perfusion imaging for prediction of neurovascular uncoupling potential in brain tumors. Technol Cancer Res Treat 2012;11(4):361–374. [DOI] [PubMed] [Google Scholar]
- 34.Pak RW, Hadjiabadi DH, Senarathna J, et al. Implications of neurovascular uncoupling in functional magnetic resonance imaging (fMRI) of brain tumors. J Cereb Blood Flow Metab 2017;37(11):3475–3487. [DOI] [PMC free article] [PubMed] [Google Scholar]
- 35.Zacà D, Jovicich J, Nadar SR, Voyvodic JT, Pillai JJ. Cerebrovascular reactivity mapping in patients with low grade gliomas undergoing presurgical sensorimotor mapping with BOLD fMRI. J Magn Reson Imaging 2014;40(2):383–390. [DOI] [PMC free article] [PubMed] [Google Scholar]
- 36.Ma L, Wang B, Chen X, Xiong J. Detecting functional connectivity in the resting brain: a comparison between ICA and CCA. Magn Reson Imaging 2007;25(1):47–56. [DOI] [PubMed] [Google Scholar]
- 37.Chen CM, Hou BL, Holodny AI. Effect of age and tumor grade on BOLD functional MR imaging in preoperative assessment of patients with glioma. Radiology 2008;248(3):971–978. [DOI] [PubMed] [Google Scholar]
- 38.Fraga de Abreu VH, Peck KK, Petrovich-Brennan NM, Woo KM, Holodny AI. Brain Tumors: The Influence of Tumor Type and Routine MR Imaging Characteristics at BOLD Functional MR Imaging in the Primary Motor Gyrus. Radiology 2016;281(3):876–883. [DOI] [PMC free article] [PubMed] [Google Scholar]
- 39.Altman DG, Royston P. The cost of dichotomising continuous variables. BMJ 2006;332(7549):1080. [DOI] [PMC free article] [PubMed] [Google Scholar]
- 40.Harrell FE., Jr. The 15 problems with dichotomizing continuous predictors. In: Regression modeling strategies: with applications to linear models, logistic and ordinal regression, and survival analysis. 2nd ed. New York, NY: Springer, 2014. [Google Scholar]
- 41.Kiviniemi V, Kantola JH, Jauhiainen J, Hyvärinen A, Tervonen O. Independent component analysis of nondeterministic fMRI signal sources. Neuroimage 2003;19(2 Pt 1):253–260. [DOI] [PubMed] [Google Scholar]
- 42.Yahyavi-Firouz-Abadi N, Pillai JJ, Lindquist MA, et al. Presurgical Brain Mapping of the Ventral Somatomotor Network in Patients with Brain Tumors Using Resting-State fMRI. AJNR Am J Neuroradiol 2017;38(5):1006–1012. [DOI] [PMC free article] [PubMed] [Google Scholar]
Associated Data
This section collects any data citations, data availability statements, or supplementary materials included in this article.