Abstract
Objective
To assess whether serum concentrations of the anti-inflammatory cytokine growth differentiation factor 15 (GDF-15) differ in patients with highly active multiple sclerosis (MS) vs patients with stable MS and healthy controls (HCs).
Methods
GDF-15 concentrations were measured by ELISA in serum and CSF in a cross-sectional cohort of patients with MS, patients with other inflammatory neurologic diseases (OIND), patients with noninflammatory neurologic diseases (NIND), and healthy controls (HC). Serum GDF-15 concentrations were measured in a longitudinally sampled cohort of clinically and radiologically well-characterized patients with MS and corresponding controls.
Results
Cross-sectionally measured median serum GDF-15 concentrations were significantly higher in patients with OIND (n = 42) (600 pg/mL, interquartile range [IQR] = 320–907 pg/mL) compared with HCs (n = 29) (325 pg/mL, IQR = 275–419 pg/mL; p = 0.0007), patients with NIND (n = 46) (304 pg/mL, IQR = 245–493 pg/mL; p = 0.0002), or relapsing MS (n = 42) (356 pg/mL, IQR = 246–460 pg/mL; p = 0.0002). CSF and serum concentrations of GDF-15 were correlated (r = 0.41, 95% CI = 0.25–0.56, p < 0.0001). In a longitudinally sampled cohort of patients with MS (n = 48), deeply phenotyped with quantitative clinical and MRI assessments, mean GDF-15 concentrations were significantly higher in patients with a stable disease course (405 pg/mL, SD = 202) than in patients with intermittent MRI activity (333 pg/mL, SD = 116; p = 0.02).
Conclusions
Serum GDF-15 concentrations are increased in patients with MS with a stable disease course. These data suggest that GDF-15 may serve as a biomarker for disease stability in MS.
MS is a chronic inflammatory demyelinating disease of the CNS.1 The disease course in MS is highly heterogeneous. Monitoring subclinical disease activity is a major challenge for clinicians caring for patients with MS.1 Identification of biomarkers that indicate disease activity in individual MS patients is largely an unmet need. Immune cell migration across the blood-brain barrier plays an important role in the pathogenesis of MS and depends on integrins, including lymphocyte function-associated antigen 1 (LFA-1).2 The spatially limited extension and temporal resolution of most MS lesions over time3 suggest that anti-inflammatory mechanisms counteract the proinflammatory processes during lesion evolution.
Growth differentiation factor 15 (GDF-15) is a transforming growth factor-beta–related cytokine.4 Under homeostatic conditions, GDF-15 expression is weak in most tissues and increases following injury in various tissues4 including the CNS.5 Data from animal models indicate that GDF-15 counteracts LFA-1–dependent extravasation of leukocytes into inflamed tissues, hereby limiting tissue destruction.4 In addition, inflammation-induced GDF-15 was recently shown to protect tissues against inflammatory damage by promoting a metabolic adaptation.6
In the current study, we hypothesized that increased serum GDF-15 reflects subclinical tissue injury in MS. We therefore measured GDF-15 concentrations in sera and also in the CSF of various cohorts of patients with MS, including patients with clinically stable MS with or without radiologic disease activity.
Methods
Standard protocol approvals, registrations, and patient consents
The study was approved by the Ethical Committee Northwest and Central Switzerland, University of Basel, Basel, Switzerland, and followed the tenets of the Declaration of Helsinki. Written informed consent was obtained from all participants.
Study subjects
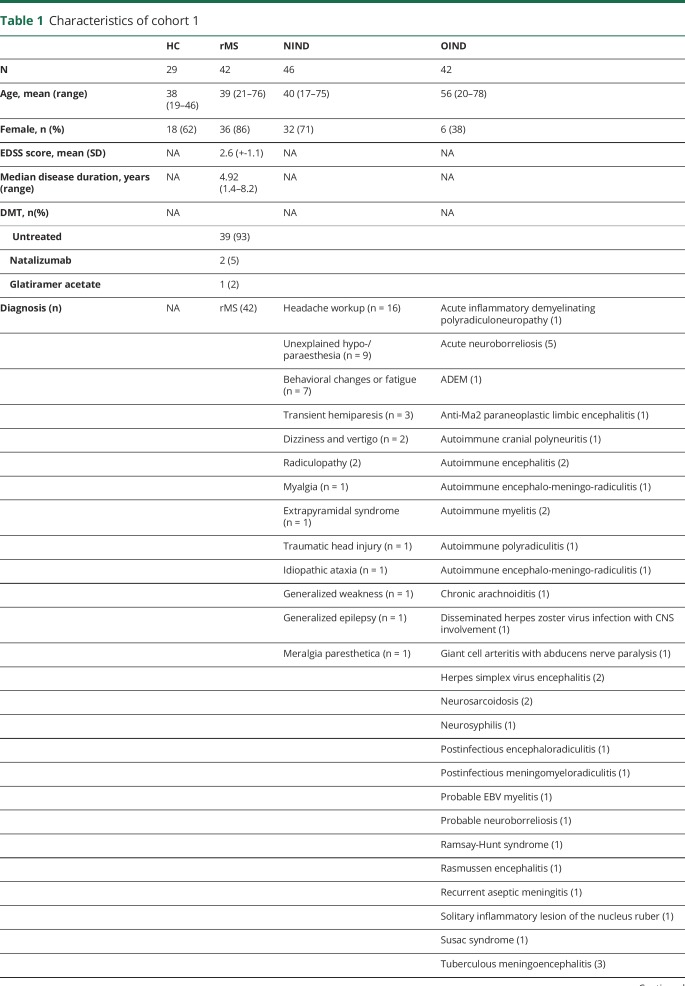
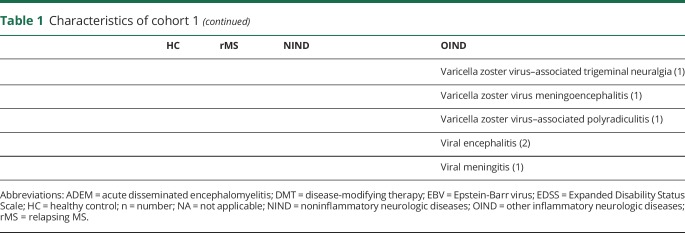
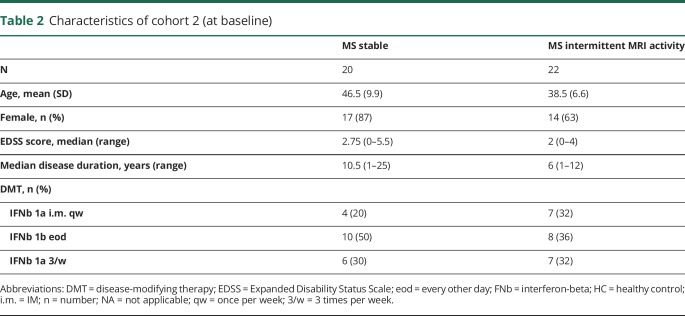
Serum and CSF concentrations of GDF-15 were measured cross-sectionally in a cohort of patients with relapsing MS (rMS) and controls during routine diagnostic workup according to international consensus guidelines at the University Hospital Basel after informed consent (table 1). Serum concentrations of GDF-15 were measured longitudinally in a cohort of patients with rMS (table 2). All subjects provided written informed consent, and the study was approved by the local ethics committee.
Table 1.
Characteristics of cohort 1
Table 2.
Characteristics of cohort 2 (at baseline)
GDF-15 measurements
GDF-15 concentrations were measured in serum with a commercially available ELISA according to the protocol of the manufacturer (DuoSet, Cat.Nr. DY957, R&D Systems).
Statistical analysis
Data were tested for normality with the D'Agostino-Pearson normality test. The Mann-Whitney test was performed in case of non-normality and/or differing variance among study groups; the unpaired t test was performed in case of normally distributed data. Non-normally distributed variables are presented as median with interquartile range (IQR). Correlation of data was calculated by Pearson R. Multivariate analyses were performed by analysis of covariance. GraphPad-Prism v7.0b was used for statistical analyses.
Data availability
The sample collection procedure of subjects of cohort 1 has been described earlier.7 Cohort 2 contained longitudinally sampled patients with rMS as part of a prospective multicenter study initiated in 2003.8 Our study included patients with rMS who were recruited at the Neurologic Clinic and Policlinic, University Hospital Basel (Switzerland), as part of a prospective multicenter study.
Results
Analytical performance of the GDF-15 assay and stability of the analyte
The mean coefficients of variation (CVs) of concentration of duplicates (intraassay variability) ranged among the different cohorts from 1.4% to 2.6%. There was no significant change in measured GDF-15 concentration in sera analyzed following 5 freeze-thaw-cycles (median % CV 4.48 [1.20–5.78]). The CV of the interassay controls ranged from 9.8% to 13.8% and thus remained well below the widely accepted CV 20% for interassay controls.
Serum concentrations of GDF-15 are increased in CNS inflammation and correlate with CSF concentrations
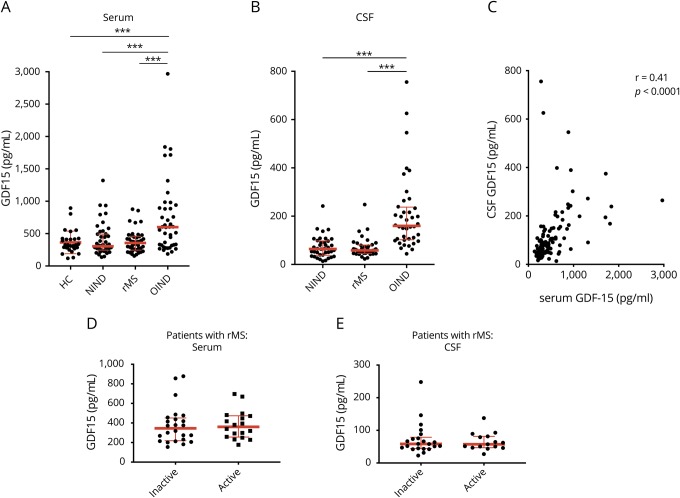
GDF-15 is well established as a biomarker for tissue damage in cardiovascular disease.9 No information is available whether GDF-15 is also increased during CNS inflammation. Using samples from cohort 1, we determined GDF-15 serum concentrations in healthy controls (HCs; n = 29), individuals with noninflammatory neurologic diseases (NIND; n = 46), patients with rMS (n = 42), and in patients with other inflammatory neurologic diseases (OIND; n = 42). The median GDF-15 concentration was significantly higher in patients with OIND (600 pg/mL, IQR = 320–907 pg/mL) compared with HCs (325 pg/mL, IQR = 275–419 pg/mL; p = 0.0007), patients with NIND (304 pg/mL, IQR = 245–493 pg/mL; p = 0.0002), or patients with rMS (356 pg/mL, IQR = 246–460 pg/mL; p = 0.0002) (figure 1A). No specific disease or disease group such as autoimmune or infectious inflammatory neurologic disorders was associated with low or very high concentrations of GDF-15 in serum or CSF in the OIND group (data not shown).
Figure 1. GDF-15 concentrations in serum and CSF of patients with MS and controls.
Concentration of GDF-15 in healthy controls, patients with NIND, patients with rMS, and patients with OIND in serum (A) and CSF (B) (median and IQRs). Correlation between serum and CSF GDF-15 concentrations in pooled patients with NIND, rMS, and OIND (C). Concentration of GDF-15 in patients with rMS with or without disease activity at the time point of sampling in serum (D) and CSF (E) (median and IQRs). ***p < 0.001. GDF-15 = growth differentiation factor 15; HC = healthy control; IQR = interquartile range; NIND = noninflammatory neurologic diseases; OIND = other inflammatory neurologic diseases; rMS = relapsing MS.
In CSF, the median GDF-15 concentrations were higher in patients with OIND (160 pg/mL, IQR = 102–238 pg/mL) compared with patients with NIND (64 pg/mL, IQR = 38–97 pg/mL; p < 0.0001) or patients with rMS (58 pg/mL, IQR = 47–80 pg/mL; p < 0.0001) (figure 1B). CSF and serum concentrations of GDF-15 were correlated (r = 0.41, 95% CI = 0.25–0.56, p < 0.0001) (figure 1C), and serum GDF-15 concentrations correlated with age in patients with NIND (r = 0.55, p = 0.0002) and rMS (r = 0.52, p = 0.0002) but not in patients with OIND (r = 0.27, p = 0.7) (data not shown). No differences were noted between patients with rMS with or without disease activity at the time point of sampling (figure 1, D and E).
Longitudinal assessment of serum GDF-15 in patients with MS
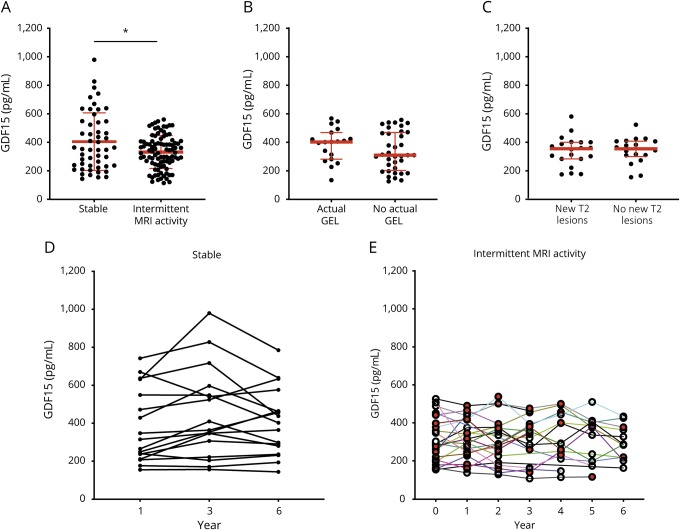
To assess the role of GDF-15 in MS in more detail, we measured the concentration of serum GDF-15 in patients treated with interferon-beta that had been sampled longitudinally and were divided into a group of patients with clinically and radiologically stable disease course (n = 20) and into a group of patients with MS with intermittent radiologic disease activity (n = 22). MRI activity was defined as intermittently occurring gadolinium-enhancing lesions (GELs) or appearance of one or more new T2 hyperintense lesion(s) in MRI in comparison to previous scans. In these patients, GDF-15 concentrations were measured annually in all available serum samples (mean observation time 4.6 years). In the control group without radiologic disease activity (mean observation time 5.9 years), GDF-15 concentrations were measured every other year (year 1, year 3, and year 6 after inclusion). In patients with stable disease course, mean GDF-15 concentrations were significantly higher (405 pg/mL, SD = 202) than in patients with intermittent MRI activity (333 pg/mL, SD = 116; p = 0.02) (figure 2A). In a linear regression analysis, slopes of GDF-15 values in relation to age differed among patient subgroups (p = 0.001), indicating that age is not a cofounder of the observed differences. GDF-15 concentrations correlated in stable patients (r = 0.72, p < 0.0001) but not in patients with GEL (r = −0.001, p = 0.98) or new T2 lesions (r = −0.36, p = 0.08) with age (data not shown). In patients with GEL or T2 lesions, no difference was noted between time points with actual GEL or new T2 lesions compared with time points without GEL or new T2 lesions, respectively (figure 2, B and C). No correlation was found between serum GDF-15 concentrations and the number of GELs (data not shown). Figure 2, D and E illustrate longitudinal changes of GDF-15 concentrations in stable patients and patients with intermittent T2 or GEL activity in MRI.
Figure 2. Longitudinal measurements of serum GDF-15 concentrations in patients with MS.
Concentrations of GDF-15 in patients treated with interferon-beta with a continuously stable disease course (stable) and patients with intermittent MRI activity during a median follow-up of 5.9 years (A) (mean + SD). GDF-15 serum concentrations of patients with T2 activity at time points with or without new T2 lesions (B) and patients with intermittent GEL with actual GEL and at time points without GEL (C) (median and IQR). Longitudinal changes of GDF-15 concentrations in stable patients (D) and patients with intermittent MRI activity (E) (red symbols indicate time points with MRI activity). *p < 0.05. GDF-15 = growth differentiation factor 15; GEL = gadolinium-enhancing lesion; SD = standard deviation.
Discussion
Several cytokines and chemokines have been proposed as biomarkers for inflammatory disease activity in MS. In the current study, we found increased concentrations of the cytokine GDF-15 in acute inflammatory CNS disorders. However, we could not confirm our initial hypothesis that increased serum concentrations of GDF-15 are associated with inflammatory disease activity in MS. On the contrary, in longitudinally sampled, well-characterized patient groups, we observed higher GDF-15 concentrations in those patients with MS with no clinical or imaging signs of acute or recent inflammatory disease activity. Increased GDF-15 concentrations may reflect an endogenous anti-inflammatory mechanism in patients with stable disease, counteracting evolving inflammatory lesions in their early stage while being still below the threshold for detection in MRI. Our data suggest that GDF-15 is not involved in the pathogenesis of MS. Alternatively, nonincreased concentrations in patients with active MS may relate to increased GDF-15 consumption during inflammation or less effective counterregulation due to impaired production of GDF-15. The mechanisms resulting in changes of serum GDF-15 in neuroinflammation remain to be determined.
Three-fold higher concentrations of GDF-15 in serum compared with CSF are compatible with an endothelial or subendothelial source of GDF-15 production.10 GDF-15 is known to inhibit LFA-1–dependent adhesion of immune cells to endothelial cells9 and would thus locally counteract immune cell infiltration into the CNS.
Pending further elucidation of the mechanism underlying our observation, our data suggest that elevated GDF-15 may serve as an indicator for disease stability in general or for a favorable response to disease-modifying treatments in a subgroup of patients with MS. With the advent of more and more effective treatments with different mechanisms of action, biomarkers allowing to better characterize inflammatory diseases activity are urgently needed. Our data suggest that GDF-15 deserves being further explored as a biomarker for stable disease or even response to treatment.
Glossary
- CV
coefficient of variation
- GDF-15
growth differentiation factor 15
- GEL
gadolinium-enhancing lesion
- HC
healthy control
- IQR
interquartile range
- LFA-1
lymphocyte function-associated antigen 1
- NIND
noninflammatory neurologic diseases
- OIND
other inflammatory neurologic diseases
- rMS
relapsing MS
Appendix. Authors
Study funding
This study was supported by the Swiss Multiple Sclerosis Society. AA was supported by the Goldschmidt-Jacobson Foundation. MM is supported by the Swiss National Science Foundation (PZ00P3_179662).
Disclosure
L. Kappos's institution (University Hospital Basel) has received in the last 3 years and used exclusively for research support: steering committee, advisory board, and consultancy fees (Actelion, Addex, Bayer HealthCare, Biogen Idec, Biotica, Genzyme, Lilly, Merck, Mitsubishi, Novartis, Ono Pharma, Pfizer, Receptos, Sanofi, Santhera, Siemens, Teva, UCB, and XenoPort); speaker fees (Bayer HealthCare, Biogen Idec, Merck, Novartis, Sanofi, and Teva); support of educational activities (Bayer HealthCare, Biogen Idec, CSL Behring, Genzyme, Merck, Novartis, Sanofi, and Teva); license fees (Neurostatus products); and grants (Bayer HealthCare, Biogen, Merck, Novartis, Roche, Swiss Multiple Sclerosis Society, the Swiss National Research Foundation, the European Union, and Roche Research Foundations). J. Kuhle received speaker fees, research support, travel support, and/or served on advisory boards of ECTRIMS, Swiss Multiple Sclerosis Society, Swiss National Research Foundation (320030_160221), University of Basel, Bayer, Biogen, Genzyme, Merck, Novartis, Roche, and Teva. M. Mehling has received during the last 3 years institutional research support as compensation for serving as a member of advisory boards or steering committees, or as a consultant or speaker, from the following companies: Actelion, Biogen, Genzyme, Merck, and Novartis. Y. Naegelin's employer, the University Hospital Basel received payments for lecturing from Celgene GmbH and Teva Pharma AG that were exclusively used for research support, not related to this study. J. Oechtering has received travel grants from Bayer, Biogen, and Novartis and served on a scientific advisory board for Roche, not related to this work. J. Wischhusen received speaker fees, research support, travel support, company shares, and/or served on advisory boards of Novartis, Roche, Bristol-Myers Squibb, Daiichi Sankyo, CatalYm GmbH, and Inoviem SA. A. Amstad, M. Coray, C. Frick, C. Barro, and M. Amman report no disclosures. Go to Neurology.org/NN for full disclosures.
References
- 1.Reich DS, Lucchinetti CF, Calabresi PA. Multiple sclerosis . N Engl J Med 2018;378:169–180. [DOI] [PMC free article] [PubMed] [Google Scholar]
- 2.Azcutia V, Bassil R, Herter JM, et al. Defects in CD4+ T cell LFA-1 integrin-dependent adhesion and proliferation protect Cd47-/- mice from EAE . J Leukoc Biol 2017;101:493–505. [DOI] [PMC free article] [PubMed] [Google Scholar]
- 3.He J, Grossman RI, Ge Y, Mannon LJ. Enhancing patterns in multiple sclerosis: evolution and persistence . AJNR Am J Neuroradiol 2001;22:664–669. [PMC free article] [PubMed] [Google Scholar]
- 4.Kempf T, Zarbock A, Widera C, et al. GDF-15 is an inhibitor of leukocyte integrin activation required for survival after myocardial infarction in mice . Nat Med 2011;17:581–588. [DOI] [PubMed] [Google Scholar]
- 5.Schober A, Böttner M, Strelau J, et al. Expression of growth differentiation factor-15/macrophage inhibitory cytokine-1 (GDF-15/MIC-1) in the perinatal, adult, and injured rat brain . J Comp Neurol 2001;439:32–45. [DOI] [PubMed] [Google Scholar]
- 6.Luan HH, Wang A, Hilliard BK, et al. GDF15 is an inflammation-induced central mediator of tissue tolerance . Cell 2019;178:1231–1244.e11. [DOI] [PMC free article] [PubMed] [Google Scholar]
- 7.Kuhle J, Leppert D, Petzold A, et al. Neurofilament heavy chain in CSF correlates with relapses and disability in multiple sclerosis . Neurology 2011;76:1206–1213. [DOI] [PubMed] [Google Scholar]
- 8.Baranzini SE, Wang J, Gibson RA, et al. Genome-wide association analysis of susceptibility and clinical phenotype in multiple sclerosis . Hum Mol Genet 2009;18:767–778. [DOI] [PMC free article] [PubMed] [Google Scholar]
- 9.Wollert KC, Kempf T, Wallentin L. Growth differentiation factor 15 as a biomarker in cardiovascular disease . Clin Chem 2017;63:140–151. [DOI] [PubMed] [Google Scholar]
- 10.Reiber H. Proteins in cerebrospinal fluid and blood: barriers, CSF flow rate and source-related dynamics . Restor Neurol Neurosci 2003;21:79–96. [PubMed] [Google Scholar]
Associated Data
This section collects any data citations, data availability statements, or supplementary materials included in this article.
Data Availability Statement
The sample collection procedure of subjects of cohort 1 has been described earlier.7 Cohort 2 contained longitudinally sampled patients with rMS as part of a prospective multicenter study initiated in 2003.8 Our study included patients with rMS who were recruited at the Neurologic Clinic and Policlinic, University Hospital Basel (Switzerland), as part of a prospective multicenter study.


