

Abstract
Temporal trends in plasma concentrations of per- and polyfluoroalkyl substances (PFAS) in free-ranging bottlenose dolphins (Tursiops truncatus) inhabiting two geographic areas: Indian River Lagoon, Florida over the years 2003–2015 and the waters surrounding Charleston, South Carolina over 2003–2013, were examined. Nine PFAS met the inclusion criteria for analysis based on percent of values below level of detection and sampling years. Proportionate percentiles parametric quantile regression assuming lognormal distributions was used to estimate the average ratio of PFAS concentrations per year for each chemical. Plasma concentrations decreased over time for perfluorodecanoate (PFDA), perfluorohexane sulfonate (PFHxS), perfluorooctanoate (PFOA), perfluorooctane sulfonate (PFOS), and perfluoroundecanoate (PFUnDA) in both locations. Perfluorononanoate (PFNA) decreased with time in Indian River Lagoon dolphins. Perfluorododecanoate (PFDoDA) concentrations significantly increased over time among female Indian River Lagoon dolphins. Regulation and phaseout of specific PFAS groups may have led to the decreasing levels of those PFAS and increasing levels of other replacement PFAS.
Keywords: perfluoroalkyl substances, PFOS, PFOA, persistent organic pollutants, bottlenose dolphins, Tursiops truncatus
INTRODUCTION
Per- and polyfluoroalkyl substances (PFAS) are fluorinated chemicals that have oleophobic, hydrophobic, and thermostable properties, making them useful in products such as firefighting foams, paints, textiles, and lubricants.1 PFAS can be released directly from manufacturing or from sources that contain the compound or its derivatives.2,3 They can also occur through degradation of precursors such as those found in fluorotelomer-based products.2,4 Two major categories of PFAS include perfluoroalkyl carboxylic acids [CnF2n+1COOH (PFCA)] and perfluoroalkyl sulfonic acids [(CnF2n+1SO3H (PFSA)].4 Long-chain PFAS, which include PFCAs with eight carbons or greater and PFSAs with six carbons or greater, were the main types of PFAS used until their phasing out by manufacturers starting in 2000 with a major producer, 3M.4,5
Perfluorooctane sulfonate (PFOS), a long-chain PFSA, and perfluorooctanoate (PFOA), a long-chain PFCA, have received attention due to concerns about their health and environmental impacts such as their tendency to accumulate in animal and human tissue, persistence in the environment, and concerns about potential health effects5−8 (e.g., developmental, reproductive, and hepatic).6 In 2009, PFOS was listed as a persistent organic pollutant (POP) under the Stockholm Convention,9 and a decision was recently made in 2019 to list PFOA.10 Perfluorohexane sulfonate (PFHxS), a PFSA, is a current POP candidate.11 POP criteria include bioaccumulation, persistence, long-range transport, and evidence of, or the potential for, adverse effects on health or the environment.12 Even with PFOS restrictions, acceptable purposes remain and production continues in some parts of the world.13,14 The phasing out of these compounds has led to replacement with short-chain PFAS, such as perfluorobutane sulfonate (PFBS) and other fluorinated alternatives,15,4 but information on properties and potential health and environmental impacts of replacement substances is limited and gaps remain.15,6
Numerous PFAS have been detected globally in the environment,6 human blood,6,16 and wildlife including fish and marine mammals.16 Research on the presence and distribution of replacement PFAS is limited, but short-chain PFAS [e.g., PFBS, perfluorobutanoate (PFBA), perfluoroethylcyclohexane sulfonate (PFECHS)] have been detected in marine mammals and water samples from different locations.15,17 Previous studies by the Bottlenose Dolphin Health and Risk Assessment (HERA) Project have reported concentrations of a series of PFAS in the plasma of free-ranging bottlenose dolphins from the United States East Coast.18,19 Concentrations reported previously in dolphins from the Charleston area, South Carolina were some of the highest found in the wildlife.16,17 Associations found between PFAS concentrations and immunological and hematological parameters in the plasma of bottlenose dolphins from the water surrounding Charleston, SC suggested possible immune, kidney, liver, and hematopoietic effects.20 However, other contaminants, such as polybrominated diphenyl ethers, polychlorinated biphenyls, and pesticides, were identified in Charleston dolphins, which might have contributed to the health effects seen.20−22
Because of the changes in PFAS manufacturing that have occurred, the potential health effects of PFAS, and the importance of understanding trends of these chemicals in the environment, it is relevant to study the exposures of bottlenose dolphins through time. This study aimed to examine the temporal trends of the plasma levels of PFAS among bottlenose dolphins at the two U.S. locations using the data collected and analyzed by that long-term biomonitoring project.
MATERIALS AND METHODS
Sample Collection
Blood samples were collected during capture-release studies from the Bottlenose Dolphin Health and Risk Assessment Project (HERA) for PFAS analysis. Details of the blood collection for PFAS analyses are described earlier.18 Briefly, blood was drawn from the fluke vein of free-ranging bottlenose dolphins and centrifuged immediately after sampling, and plasma samples were placed in liquid nitrogen dewar and then kept frozen at −20 °C until analysis.
All methods used for dolphin capture and sample collection were conducted under National Marine Fisheries Service Research Permit Nos. 998–1678 and 14352–02 issued to G. Bossart and Institutional Animal Care and Use Committee protocol number A10–13 issued by Indian River Lagoon Atlantic University. Samples were collected from a total of 135 individual Indian River Lagoon dolphins during June and/or July of years 2003–2006, 2010–2012, and 2015 and a total of 91 individual Charleston dolphins in August of years 2003–2005 and 2013. Eleven Indian River Lagoon dolphins and 10 Charleston dolphins had a repeat capture and sampling in a second year. Age was determined by examination of dentine layers from an extracted tooth.23 If the tooth was extracted in a different year than the plasma sample for a given dolphin, then approximate age at the time of the sample was calculated using the difference in the tooth extraction and plasma sample dates.
Chemical Analysis
Chemical analyses for PFAS in plasma of bottlenose dolphins have been described earlier.18,25 Briefly, an ion-pair liquid–liquid extraction was used to extract PFAS from plasma. Determination of the concentrations of a series of PFAS was performed using high-performance liquid chromatography (HPLC) with electrospray tandem mass spectrometry (MS/MS).18 Plasma samples were spiked with isotopically labeled PFCAs and PFSAs, and an isotope dilution method was used for quantification. HPLC-MS/MS was operated in negative electrospray ionization mode.25 A list of analytes and limits of detection (LODs) are provided in Table S1.
Data Analysis
PFAS excluded from statistical analysis were those compounds with >30% of their values below the limit of detection (LOD), and those with concentrations available from only one sampling year, or two sampling years in succession (e.g., 2003 and 2004), because the focus of the analysis in this paper is on longer time trends. Values below the LODs were replaced with the LOD/sqrt2. Only those PFAS that met the criteria for analysis for both Charleston and Indian River Lagoon dolphins were included in this paper. The PFAS that met the criteria for analysis for both Charleston and Indian River Lagoon dolphins included perfluorodecanoate (PFDA), perfluorododecanoate (PFDoDA), perfluorodecane sulfonate (PFDS), perfluoroheptanoate (PFHpA), PFHxS, perfluorononanoate (PFNA), PFOA, PFOS, and perfluoroundecanoate (PFUnDA). Perfluorotridecanoate (PFTriA) and perfluorooctane sulfonamide (PFOSA) had <30% of samples below the LODs for Charleston, but not Indian River Lagoon dolphins. Concentrations of PFDS and PFHpA were not analyzed in 2003 for Indian River Lagoon dolphins or 2004 for both locations. PFTriA concentrations were not analyzed in 2004 for Charleston dolphins.
The statistical analysis accounted for the skewed distribution of biomarkers across a population of dolphins within each year and considered the change over time on the multiplicative scale since the contaminant concentrations differed substantially between locations within each year. We used proportionate percentile parametric quantile regression assuming lognormal distributions to estimate the average ratio of PFAS concentrations per year for each chemical.26,27 This approach to time trends analysis estimates the same scalar to be multiplied by each quantile of 1 year’s chemical distribution to arrive at the next year’s chemical distribution; this allows for interpretable results such as “concentrations increased 10% per year on average” to describe a percentile ratio of 1.1 per year. Percentile ratios per year above 1 indicate increasing PFAS concentrations with time, and ratios per year below 1 indicate decreasing PFAS concentrations over time. Robust standard errors were used to account for dependent observations from the few dolphins contributing multiple observations. Although there are gaps in the years sampled within the study period for both locations, we chose a parametric regression modeling method appropriate for skewed data, and the extrapolated trend is the average change observed over this period as best supported by the available data.
Analysis included stratification by location and sex to compare trends. Analysis also included restriction to adult dolphins (≥10 years for males and ≥6 years for females) stratified by location. Due to the small number and limited sample years for strata of some of the PFAS, juvenile dolphins were not analyzed separately. Distribution summaries for PFAS concentrations were also calculated, by location, across all years. This included geometric means, medians, 25th and 75th percentiles, and minimum and maximum values for each PFAS. As a sensitivity analysis for the shape of the temporal trend, we parameterized the change across years using piecewise linear splines with a knot at 2005, rather than coding the year as a single linear predictor. This analysis results in two ratios per year for each chemical and location: a ratio per year for 2003–2005 for both Charleston and Indian River Lagoon dolphins and another ratio per year for 2005–2013 in Charleston dolphins and 2005–2015 in Indian River Lagoon dolphins. This allows for different trends for the two time periods; the main analysis assumes any trends remained constant over the entire study period. The results of the two analyses were compared to determine if the conclusions differed under the assumptions of each analysis.
All statistical analysis was implemented using Stata/SE 16.0. Figures 2 and S1–S8 were generated using Stata/SE 16.0 and Figures 1, S9 and S10 were generated using SAS University Edition/SAS 9.4M6 (SAS Institute Inc, Cary, NC).
Figure 2.
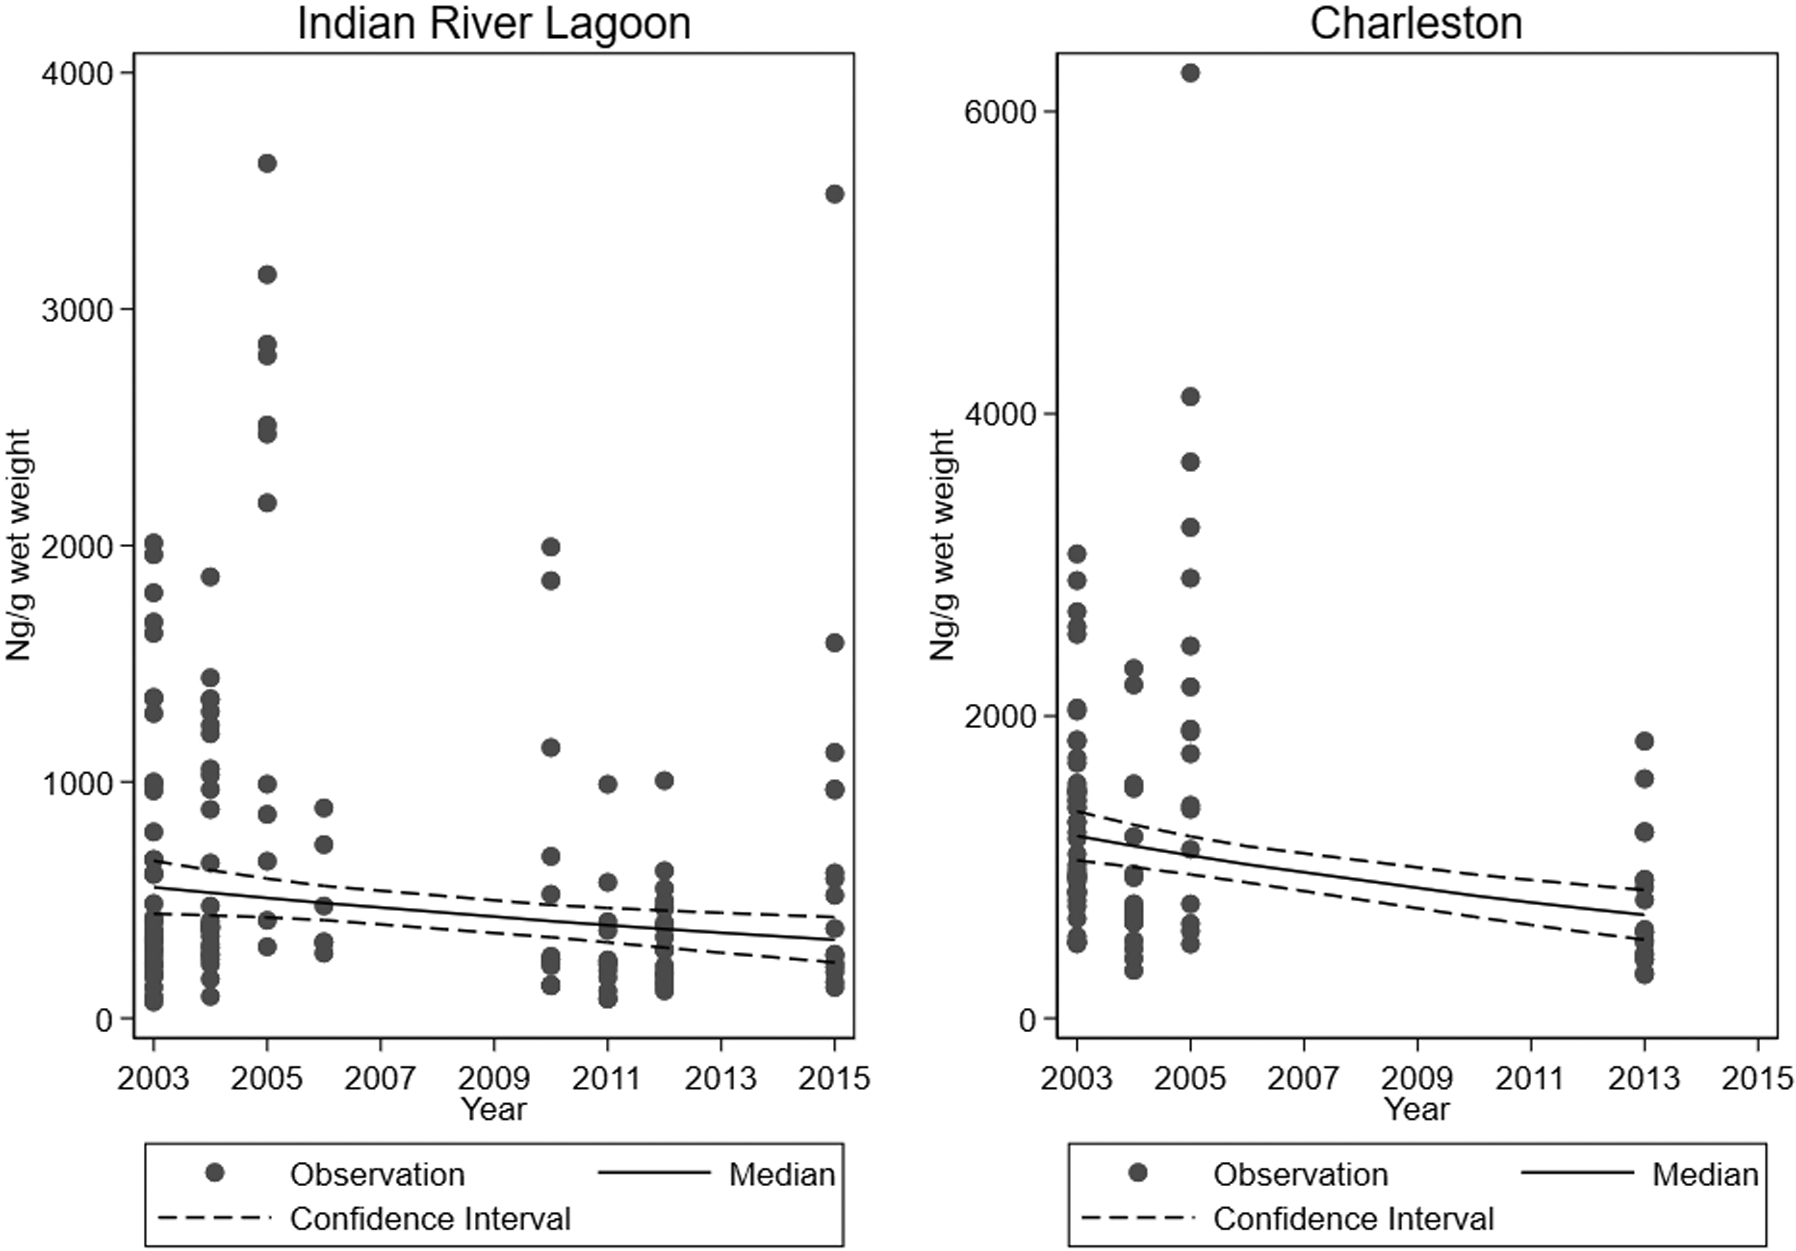
Concentrations of PFOS in plasma, with estimated population medians and 95% confidence intervals, by year, in bottlenose dolphins (Tursiops truncatus) from Charleston, SC and Indian River Lagoon, FL.
Figure 1.
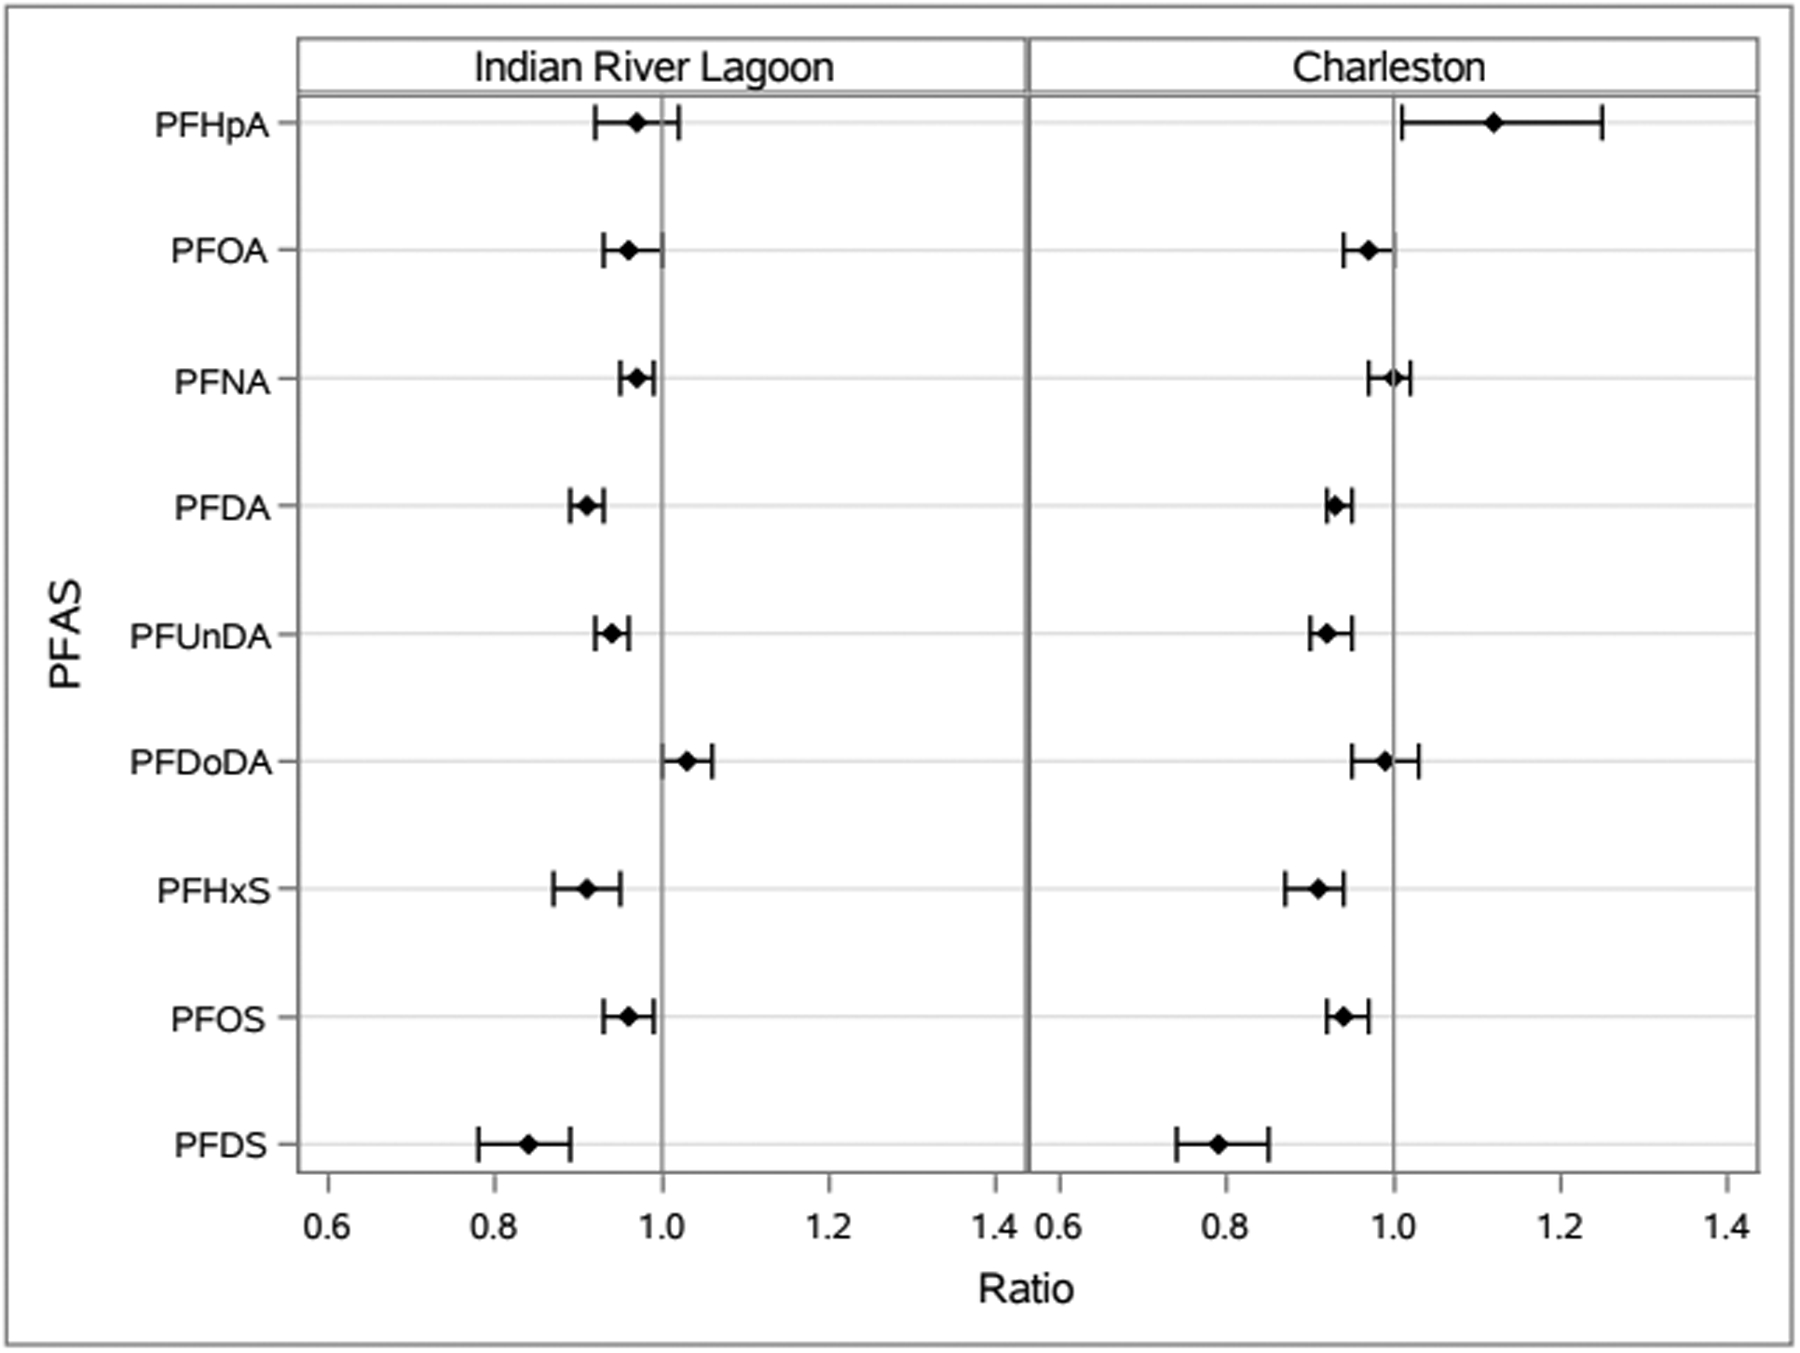
Relative concentrations of plasma per- and polyfluoroalkyl substances (PFAS) per increasing year, with 95% confidence intervals, among bottlenose dolphins (Tursiops truncatus) sampled from Charleston, SC and Indian River Lagoon, FL stratified by location.
RESULTS AND DISCUSSION
Demographics and Predominant PFAS
Among Indian River Lagoon dolphins with known sex, 74% (n = 106) were male and 26% (n = 37) were female. Among Charleston dolphins with known sex, 61% (n = 60) were male and 39% (n = 39) female. Among Indian River Lagoon dolphin observations with known age, 71% (n = 85) were categorized as adults and 29% (n = 34) as juveniles. Two Indian River Lagoon dolphins with known age (both 6 years) did not have data recorded on their sex and could not be categorized as adult or juvenile. The median age was 11 years for Indian River Lagoon dolphins across all capture years. Among Charleston observations with known age, 76% (n = 63) were classified as adults and 24% (n = 20) as juveniles, with a median age of 15 years across all capture years. The distributions of PFAS in each dolphin population across all years are presented in Table 1 and by year in Tables S2 and S3 of the Supporting Information. Measurement of PFAS indicated that, for both Charleston and Indian River Lagoon dolphins, PFOS was the dominant compound with concentrations (ng/g wet weight) higher than other measured PFAS, with medians (25th percentile, 75th percentile) of 960 (660, 1550) for Charleston dolphins and 390 (247, 968) for Indian River Lagoon dolphins across all years. Among Indian River Lagoon dolphins, PFHxS had the second highest average concentration (ng/g wet weight) of the PFAS, with a median (25th percentile, 75th percentile) of 19.7 (10.2, 61.7). Among Charleston dolphins, PFDA had the second highest average concentration (ng/g wet weight) with a median (25th percentile, 75th percentile) of 109 (73.9, 196). Plasma concentrations represent a portion of the overall body burden of PFAS in bottlenose dolphins; one study found that plasma concentrations were much higher than concentrations in urine, feces, or blubber tissue compartments among dolphins sampled from Indian River Lagoon and Charleston.28 Similar to this current study, which found PFOS as the predominant PFAS in dolphin plasma from both locations, PFOS has been identified as a predominant PFAS in other studies of marine mammals.29−32 Long-chain PFSAs and PFCAs such as those identified in both Charleston and Indian River Lagoon bottlenose dolphins in this study have been found in marine mammals around the world, and the short-chain PFCA, PFHpA, has also been identified.17,29,30,32
Table 1.
Summary of demographics and median, 25th and 75th percentiles (p25, p75), geometric mean (GM), and range of per- and polyfluoroalkyl substances (PFAS) plasma concentrations (ng/g wet weight), in bottlenose dolphins (Tursiops truncatus) from Charleston, SC and Indian River Lagoon, FL.
| PFAS | Carbon Chain Length | N | Male N | Female N | Age (Min, Max) | Age N | Median | p25, p75 | GM | Min, Max |
|---|---|---|---|---|---|---|---|---|---|---|
| Indian River Lagoon, FL | ||||||||||
| PFCAs | ||||||||||
| PFHpA | 7 | 78 | 65 | 10 | 4.5, 26 | 62 | 0.7 | 0.6, 1.0 | 0.8 | 0.1, 26.6 |
| PFOA | 8 | 146 | 106 | 37 | 2.5, 26 | 121 | 5.7 | 3.8, 10.7 | 6.4 | 0.2, 70.3 |
| PFNA | 9 | 146 | 106 | 37 | 2.5, 26 | 121 | 8.9 | 6.1, 12.5 | 8.9 | 0.3, 65.6 |
| PFDA | 10 | 146 | 106 | 37 | 2.5, 26 | 121 | 9.0 | 4.8, 16.3 | 9.2 | 2.1, 138 |
| PFUnDA | 11 | 146 | 106 | 37 | 2.5, 26 | 121 | 7.8 | 5.8, 11.0 | 8.5 | 1.8, 73.8 |
| PFDoDA | 12 | 146 | 106 | 37 | 2.5, 26 | 121 | 1.3 | 0.8, 2.4 | 1.2 | 0.2, 14.0 |
| PFSAs | ||||||||||
| PFHxS | 6 | 146 | 106 | 37 | 2.5, 26 | 121 | 19.7 | 10.2, 61.7 | 25.1 | 2.3, 757 |
| PFOS | 8 | 146 | 106 | 37 | 2.5, 26 | 121 | 390 | 247, 968 | 462 | 69.2, 3620 |
| PFDS | 10 | 78 | 65 | 10 | 4.5, 26 | 62 | 1.5 | 1.1, 3.2 | 2.2 | 0.9, 51.0 |
| Charleston, SC | ||||||||||
| PFCAs | ||||||||||
| PFHpA | 7 | 38 | 20 | 16 | 2.5, 33 | 31 | 5.1 | 0.6, 10.3 | 3.9 | 0.6, 95.2 |
| PFOA | 8 | 101 | 60 | 39 | 2.5, 33 | 83 | 31.5 | 19.0, 54.7 | 31.3 | 0.2, 561 |
| PFNA | 9 | 101 | 60 | 39 | 2.5, 33 | 83 | 64.9 | 41.6, 90.0 | 63.9 | 11.2, 561 |
| PFDA | 10 | 101 | 60 | 39 | 2.5, 33 | 83 | 109 | 73.9, 196 | 123 | 40.7, 667 |
| PFUnDA | 11 | 101 | 60 | 39 | 2.5, 33 | 83 | 55.1 | 30.9, 94.4 | 57.0 | 10.2, 583 |
| PFDoDA | 12 | 101 | 60 | 39 | 2.5, 33 | 83 | 7.8 | 4.7, 14.6 | 7.6 | 0.2, 135 |
| PFSAs | ||||||||||
| PFHxS | 6 | 101 | 60 | 39 | 2.5, 33 | 83 | 34.2 | 14.2, 60.3 | 32.2 | 4.1, 471 |
| PFOS | 8 | 101 | 60 | 39 | 2.5, 33 | 83 | 960 | 660, 1550 | 1050 | 288, 6260 |
| PFDS | 10 | 38 | 20 | 16 | 2.5, 33 | 31 | 11.5 | 3.9, 25.4 | 12.5 | 2.0, 267 |
The median concentrations of PFAS differed by location, with higher concentrations for all PFAS in Charleston dolphins compared to Indian River Lagoon dolphins, when considering all capture years combined. Median concentrations remained higher for most PFAS in Charleston compared to Indian River Lagoon dolphins when considering individual years, although after 2005, sample years differed between locations. In a previous study, Charleston dolphins were found to have significantly higher concentrations of most PFAS analyzed compared to Indian River Lagoon dolphins.19 The findings resulted in a study of estuarine sediment concentrations in Charleston Harbor and tributaries, which found that concentrations in Charleston were higher than other U.S. urban areas studied.17,33 The predominant PFAS found in the sediment was PFOS followed by PFDA and then PFOA.33
Charleston is an industrialized region containing an airport, naval weapons station, and a previously active naval base,34 whereas the Indian River Lagoon has residential, commercial, and agricultural areas.35 These differences might help explain the higher concentrations of PFAS in Charleston. Facilities that produce fluoropolymers or use them in their production are sources of PFAS contamination.4 Additionally, studies have found military and civilian airport fire training areas contaminated with PFAS.36,37
PFSAs Trends
The results of this long-term study suggest similar decreasing temporal trends in concentrations of the PFSAs analyzed (PFDS, PFHxS, and PFOS) in dolphins from Charleston, SC and Indian River Lagoon, FL during the studied years. In the main analysis that included all ages and males and females combined, statistically significant average percentage decreases per year were seen for all PFSA concentrations analyzed (PFDS, PFHxS, and PFOS) for both locations (Figure 1, Table S4). The greatest average percentage decrease was seen for PFDS for dolphins from both Indian River Lagoon [−16% (95% CI: −22%, −11%)] and Charleston [−21% (95% CI: −26%, −15%)] followed by PFHxS and then PFOS. However, the PFDS trend models are limited by smaller sample sizes and fewer earlier years of analysis than the other perfluoroalkyl sulfonic acids, so PFDS trend estimates may be less reliable than for the other PFAS.
When considering PFSAs in the piecewise linear splines analysis (Table S6), PFHxS and PFDS concentrations in Charleston dolphins were found to be significantly increasing from 2003–2005 and decreasing from 2005–2013; PFOS concentrations were not significantly trending for 2003–2005 and were significantly decreasing from 2005–2013. For Indian River Lagoon dolphins, PFHxS and PFOS concentrations were not significantly trending from 2003–2005 and were significantly decreasing from 2005–2015. Due to small sample sizes, results for 2003–2005 generally had wide confidence intervals. Supporting these findings of decreasing trends from 2005 and later, the median concentrations for PFDS, PFHxS, and PFOS were greatest in 2005 and then decreased among both Charleston and Indian River Lagoon dolphins (Tables S2 and S3). The peaks in 2005 are reflected in the scatterplots (Figure 2 and Figures S1–S8). However, prior to 2005, PFDS was not analyzed in plasma of Indian River Lagoon dolphins and was only analyzed in the plasma of two Charleston dolphins in 2003 and none on 2004. The peak concentrations in 2005 might indicate phasing out of PFOS and related chemicals; however, this phase out started in 2000,5 which suggests that sources may have remained stable or increasing in the environment before beginning to decline, even after manufacturing stopped. This might have resulted from the continued use of already manufactured products. Median PFOS concentrations (ng/g wet weight) in Indian River Lagoon dolphins seemed to decline rapidly from 2005 (2330) to 2006 (399). Reasons for this are unclear, but speculatively could include rapid elimination kinetics in bottlenose dolphins, a topic which warrants further study, or a change in the local dolphin population such as through migration.
In 2005, Indian River Lagoon dolphins had a higher median concentration of PFOS (2330 ng/g wet weight) than Charleston dolphins (1890 ng/g wet weight). In other sample years, and for all years combined, median concentrations were higher in Charleston than Indian River Lagoon dolphins. The higher median PFOS concentrations for Indian River Lagoon dolphins compared to Charleston dolphins in 2005 could be due sampling variability in the limited number (n = 12) of Indian River Lagoon dolphins sampled that year. In addition, there may have been a greater percentage increase in PFOS concentrations from 2003 to 2005 for Indian River Lagoon dolphins compared to Charleston dolphins as suggested by the linear splines analysis, although results were not significant and estimation precision-limited [25% increase (95% CI: −2%, +60%) for Indian River Lagoon dolphins; 11% increase (95% CI: −7%, +33%) for Charleston dolphins].
Even though the concentrations of these PFSAs may have initially been increasing or stable, both the main analysis and the sensitivity analysis suggest that concentrations of these PFSAs were decreasing over time in both locations in more recent years. Similar to our results, PFOS concentrations were found to have decreased over time in some North American and European marine mammals in studies of trends including the early 2000s or later, such as in northern sea otters (Enhydra lutris kenyoni) from south-central Alaska,38 harbor seals (Phoca vitulina) from Central Bay San Francisco, CA,39 and polar bears (Ursus maritimus) from Norway.40 While PFOS decreased among harbor seals from Central Bay San Francisco (2004–2011), harbor seals from the South Bay San Francisco did not show a decrease until the most recent sampling year, 2014.39 In contrast, PFOS concentrations increased over time among beluga whales (Delphinapterus leucas) from Alaska (1989–2006),43 and in 2011 among beluga whales from Hendrickson Island, NT (1984–2013);41 concentrations in beluga whales from Pangnirtung, NU (1982–2010)41 may have been increasing or stable over time. Among marine mammals in Asia, no significant trends were found for Indo-Pacific humpback dolphins (Sousa chinensis) or finless porpoises (Neophocaena phocaenoides) from the South China Sea (2002– 2014)29 or Indo-Pacific humpback dolphins in the Pearl River Estuary, China (2004–2016).42 In addition, the median liver concentrations of dolphins from the Pearl River Estuary were found to be the highest reported worldwide among cetaceans.42 Taken together, these studies suggest differences in PFOS trends by location.
The findings of the present study are consistent with the possibility that regulation of PFOS and related compounds may have resulted in decreasing concentrations of those PFAS in dolphins. However, although PFOS concentrations were found decreasing over time at both locations in this study, analyses of whole fish and fillets collected from the Charleston Harbor and tributaries in 2014 showed that PFOS was the predominant PFAS and that, in 83% of whole fish sampled, PFOS levels exceeded guidelines for protecting the wildlife.24 Despite the decrease in PFOS over time, PFOS exposure may remain a concern for dolphins in the Charleston Harbor area.
PFCAs Trends
Concentrations of several PFCAs were also found to be significantly decreasing in bottlenose dolphins from both locations during the studied years including PFDA, PFOA, and PFUnDA when considering the main analysis that included all ages and both males and females. A slight significantly decreasing trend in PFNA concentrations was also seen among Indian River Lagoon dolphins, but not Charleston dolphins. Among the Charleston dolphins, the median and geometric mean concentrations for PFDA and PFUnDA were greatest in 2005 and then decreased from 2005 to 2013 (Table S2). PFOA concentrations among Charleston dolphins did not differ much in terms of median or geometric mean between 2003 and 2005; however, the median and geometric mean concentrations were lower in 2013 than 2005. The scatterplot for PFOA reflects the maximum concentration (561 ng/g wet weight), which appears as an outlier in 2005, and the lower concentrations in 2013. Although the trend was not significant for Charleston dolphins, median and geometric mean concentrations for PFNA peaked in 2005 followed by lower concentrations in 2013. The highest median concentration for PFDA was seen in 2003 for Indian River Lagoon dolphins, while the highest geometric mean concentration was seen in 2005, with lower concentrations in later years. PFUnDA concentrations were similar from 2003– 2005 for Indian River Lagoon dolphins, although slightly higher geometric mean and median concentrations were seen in 2005 followed by lower concentrations in 2006 and subsequent years. The median and geometric mean concentrations for PFOA and PFNA peaked in 2005 and then decreased in subsequent years among Indian River Lagoon dolphins.
PFDoDA was not significantly trending for either location in the main analysis. The analysis found a nonsignificant increase among Indian River Lagoon dolphins and nonsignificant decrease among Charleston dolphins. PFDoDA concentrations did not show much change in median or geometric mean concentrations over time for Charleston dolphins. For Indian River Lagoon dolphins, the PFDoDA median and geometric mean concentrations were highest in 2012 and lowest in 2005, although the maximum concentration among individual dolphins for PFDoDA was seen in 2005. PFHpA was found significantly increasing in Charleston dolphins, but not Indian River Lagoon dolphins in the main analysis. However, the PFHpA results are limited by the smaller sample sizes and fewer earlier years of analysis than the other PFCAs, so the trend estimates may be less reliable than for other compounds. For PFHpA among Charleston dolphins, geometric mean concentrations were higher in 2005 than 2003, and both geometric mean and median concentrations were higher in 2013 than 2005. Average PFHpA concentrations for Indian River Lagoon dolphins did not show much variation across the years.
When considering the piecewise linear splines analysis for the PFCAs, a notable difference from the main analysis among the Indian River Lagoon dolphins was the significant annual percentage decrease from 2003 to 2005 [−31% (95% CI: −49%, −5%)] and the significant annual percentage increase from 2005 to 2015 [+11% (95% CI: +3% +18%)] for PFDoDA. PFDoDA was not found to be significantly trending in the main analysis that looked at 2003–2015 combined; however, it was found significantly increasing for female Indian River Lagoon dolphins [+9% (95% CI: +4%, +16%)]. The sensitivity analysis might further support increasing concentrations of PFDoDA over time, at least in more recent years. However, due to the lower median and geometric mean concentrations in 2015 compared to 2012 for PFDoDA, it is possible if PFDoDA was increasing over time, this was only until 2012 and not from 2012–2015. Other than PFDoDA, the sensitivity analysis results for PFCAs among Indian River Lagoon dolphins suggest similar findings to the main analysis that most of the remaining PFCAs were significantly decreasing over time. The trends for 2003–2005 were not significant, though, suggesting that concentrations may not have started decreasing until 2005 or later. One exception was PFNA for which no significant trend was found despite the slightly decreasing trend found in the main analysis.
Among Charleston dolphins, in the sensitivity analysis, PFNA and PFUnDA concentrations were found significantly increasing from 2003 to 2005 and significantly decreasing from 2005 to 2013. PFDA concentrations were not significantly trending from 2003 to 2005 but were significantly decreasing from 2005 to 2013. While PFOA was significantly decreasing in the main analysis, the decrease was not significant in the sensitivity analysis. For PFHpA, concentrations were found significantly increasing from 2003 to 2005 and not significantly trending in later years. However, for PFHpA, there were only two dolphins in 2003 and none in 2004, which is a limitation of the analysis for years 2003–2005. The results of the sensitivity analysis for PFCAs among Charleston dolphins suggest that some of the PFAS shown to decrease in the main analysis may not have been consistently decreasing across all years from 2003–2013 but that, overall, they were still decreasing or remaining stable over time in more recent years. The decrease in PFCAs in both locations could be a result of the phaseout of PFOA and related chemicals by eight major manufacturers starting in 2006.44
Some other studies reported similar findings for long-chain PFCAs. For example, concentrations of total PFCAs (sum of PFOA, PFNA, PFDA, PFUnDA, and PFDoDA) were found to be decreasing in beluga whales from Sanikiluaq, NU (2003–2013) and Hendrickson Island, NT (1984–2013) in the Canadian Arctic.41 Also, a recent study of Indo-Pacific humpback dolphins from the Pearl River Estuary, China (2004–2016) found that certain PFCAs (PFNA, PFHpA, PFOA, and PFDA) peaked in 2011 before decreasing, and PFUnDA was found consistently decreasing.42 In contrast, some studies found increasing trends in PFCAs among marine mammals17 such as total PFCAs (sum of PFOA, PFNA, PFDA, PFUnDA, and PFDoDA) in beluga whales from Pangnirtung, NU (1982–2010)41 and PFNA, PFDA, PFUnDA, and PFTriA among North Atlantic pilot whales (Globicephala melas) (1986–2013) from the Faroe Islands.45 However, differences in the range of years studied, with some studies spanning earlier years than others, mean that the trends must be compared while considering the time frame of the study.
Differences observed in the temporal trends of specific PFCAs in Charleston and Indian River Lagoon dolphins may indicate different potential sources and/or environmental changes. The possible increase in PFHpA concentrations in Charleston dolphins, but not Indian River Lagoon dolphins, and the higher median concentration across all years in Charleston versus Indian River Lagoon dolphins (5.1 vs 0.7 ng/g wet weight) raises the question of whether there is a local source or sources of this chemical resulting in higher concentrations in the waters around Charleston, SC. As discussed, PFAS contamination could occur because Charleston is an industrialized region containing an airport, naval weapons station, and a previously active naval base.34 One study found associations between PFHpA levels in U.S. drinking water and military fire training areas, so these could potentially be contributing sources.46 PFHpA is a short chain PFCA, and if PFHpA concentrations are increasing, then it could represent new or increased production of this chemical. A 2012 study of estuarine sediment in Charleston Harbor and its tributaries found that 77% of the samples were above the quantification limit for PFHpA, with a mean of 0.04 ng/g wet weight (range of <0.01–0.06 ng/g wet weight) in samples from the Charleston Harbor sediment.33 This suggests that local PFHpA sources might exist, but it was not a predominant PFAS found in the sediment.33 While research on trends of short-chain PFAS in marine mammals is limited, PFBS, a short-chain PFSA, was shown to have increased from 2002 to 2014 in Pacific humpback dolphins from the South China Sea.29 This supports a shift toward increasing concentrations of shorter-chain PFAS in marine mammals close to source areas. Further studies on sources and locations could help reveal the patterns of the exposures and why, for PFHpA, there was an overall median increase despite the lower maximum concentrations in 2013 compared to 2005 among Charleston dolphins.
The significantly increasing trend for PFDoDA among Indian River Lagoon female dolphins and for 2005–2015 in the sensitivity analysis could indicate possible sources of this chemical near the waters of Indian River Lagoon, FL. The Indian River Lagoon is surrounded by residential, commercial, and agricultural areas and is continuing to develop.35 Known point source pollutants from wastewater treatment plants have been regulated in the Indian River Lagoon starting with the Indian River Lagoon Act in 1990.35 Nonpoint source pollution, which is pollution that cannot be traced back to a single point of origin (e.g., stormwater discharge), has been a concern for the Indian River Lagoon and may continue to be a growing problem with the continued development.35 PFAS could reach the lagoon as stormwater runoff when water containing contaminants is released from agricultural and residential sources;35 for example, contaminated products, which can include household consumer products,47 are potential sources of PFAS.2
PFDoDA is a long-chain PFCA, and therefore has more potential for bioaccumulation than shorter-chain PFAS.48 There is limited research on the health effects of PFDoDA, and according to a recent draft for public comment of a report by the Agency for Toxic Substances and Disease Registry, no minimal risk levels have been developed for this PFAS.6 The risk of bioaccumulation and lack of information about safe levels make the possibility of a local source a concern. The concentrations of PFDoDA levels in Indian River Lagoon dolphins are lower than those measured in Charleston dolphins, though, and low relative to concentrations of other PFAS measured in Indian River Lagoon dolphins. In addition, median and geometric mean concentrations were lower in 2015 than 2012. As a result of the uncertainty of risk and source, continued monitoring may be important to determine if a source of exposure remains for Indian River Lagoon dolphins.
Sex, Age, and Other Factors
When the temporal trend analyses were stratified by sex, female dolphins had smaller sample sizes and, therefore, wider confidence intervals than males for all compounds from both locations. Among Indian River Lagoon dolphins, PFDA, PFNA, PFOA, PFUnDA, PFDS, PFHxS, and PFOS were significantly decreasing for male dolphins and PFUnDA was significantly decreasing for female dolphins (Table S7 and Figure S9). PFDoDA was the only PFAS found significantly increasing among female dolphins from Indian River Lagoon for the sex-location stratified analysis. For most of the PFAS, the average percent decrease per year was similar among male and female Indian River Lagoon dolphins or the percent decrease was slightly greater in males than females, although the percentages were not significant for most PFAS among females.
Among Charleston dolphins, PFDA, PFUnDA, PFDS, PFHxS, and PFOS were found significantly decreasing for both male and female dolphins and PFOA significantly decreasing for male dolphins. There were no significantly increasing PFAS found in either male or female Charleston dolphins in this sex-location stratified analysis. For most PFAS, the average annual percentage changes were similar for Charleston males and females or the percentage decrease was greater for females (for PFNA, PFOA, PFDA, and PFDS), although there were overlapping confidence intervals for the male and female results. In contrast, for PFHxS, the annual percentage decrease was slightly less for females than males among Charleston dolphins. For PFHpA, results suggested a nonsignificant increasing trend for both male and female dolphins in Charleston with a smaller annual percentage increase among females. Of those PFAS with a greater percentage decrease seen in females, only PFDA and PFDS were significant for both males and females, and PFOA was significant for males only. The differences were generally small between males and females; however, there was a greater difference in the percentage decrease seen for PFDS: 17% (95% CI: −24%, −11%) for males and 26% (95% CI: −32%, −19%) for females. The small sample size for PFDS is a limitation of this analysis though.
These findings by sex were similar to another study of concentrations of PFAS in bottlenose dolphins inhabiting these locations, in which adult female dolphins from Charleston, SC were found to have lower total PFAS concentrations and lower concentrations of certain individual PFAS (PFDA, PFHxS, PFNA, and PFOS) than adult males,19 supporting the differences in the trends seen by sex. However, adult dolphins inhabiting the Indian River Lagoon, FL were not found to have patterns of concentrations by sex in that study; only PFNA levels were significantly higher among adult males than females.19 The slightly greater decrease over time for some of the PFAS in female versus male dolphins could reflect differences in excretion by females due to offloading to their young, although it is unclear why this was found more often in Charleston dolphins. Transfer of PFAS from bottlenose dolphin mothers to offspring is supported by a study of bottlenose dolphins in Sarasota Bay, FL that detected PFAS in milk and found that female dolphins who had not been observed with calves had significantly greater concentrations of PFAS than those observed with one calf;49 other studies of marine mammals including killer whales (Orcinus orca)50 and melon-headed whales (Peponocephala electra)51 also found evidence of maternal transfer of PFAS. In this current study, the parity of the female bottlenose dolphins was not known. One possible reason for the differences between locations in the decrease in PFAS among females compared to males could be differences in parity and the proportion of females in the sample who had had offspring. Additionally, because of small sample sizes, the analysis could not be stratified by sex and age combined, so both adult and juvenile dolphins were included in the trends by sex which is a limitation.
Regarding age, results from the present study were similar for most PFAS trends between adult dolphins and dolphins of all ages (Table S8 and Figure S10), suggesting that age may not have had a major effect on trends of these PFAS during the study period, although when considering age distribution, the percentage of adults was greater than juveniles for both locations among dolphins with known ages. However, the average percentage increase of PFHpA concentrations was greater among adult Charleston dolphins [21% (95% CI: +7%, +37%)] than Charleston dolphins of all ages [12% (95% CI: +1%, +25%)]. This could indicate differences by age, but the analysis was limited by the small sample sizes, preventing direct comparisons between trends of juvenile and adult dolphins.
Several studies have shown differences in PFAS concentrations in marine mammals by age. Decreased concentrations of certain PFAS with increased age were found in previous studies of bottlenose dolphins from Charleston, SC, Indian River Lagoon, FL,18,19 and sexually immature calves had higher concentrations than their mothers among bottlenose dolphins from Sarasota Bay, FL.49 Decreasing concentrations of PFAS with increasing age has also been suggested by a study that found higher plasma concentrations of PFHxS, PFOS, PFDoDA, PFUnDA, and PFTriA in hooded seal pups than their mothers, although PFDA and PFNA concentrations were higher in mothers than pups.52 However, an increase in PFOS concentrations with age was found in marine tucuxi dolphins (Sotalia guianensis) after exclusion of a 1 year old calf from analysis,53 and a study of harbor porpoises found no differences in concentrations by age.54 Maternal transfer could be one reason for differences seen by age among some marine mammals. In regards to life history stage, a study of harbor porpoises found differences by stage, for example, neonates, suckling juveniles, and lactating females were found to have the highest PFOS levels.55 Taken together, these previous studies suggest that differences in PFAS exposures or kinetics by age may exist for some marine mammals, possibly related to life history stage. Because of possible differences by age, further trend analysis of PFAS concentrations among bottlenose dolphins considering age, and the potential interactions with life history stage, and sex could be informative.
Several other factors could also influence the PFAS concentrations in bottlenose dolphins and the geographic differences and temporal changes seen. Diet can influence concentrations among marine mammals; diet was a main factor predicting PFAS concentrations in female polar bears in a recent study.56 PFAS concentrations were found to differ by species of fish captured from Charleston Harbor and tributaries,24 so which fish species are consumed by bottlenose dolphins might influence exposure within the same location or between locations. Migratory patterns might also influence PFAS concentrations in the dolphins and changes over time because dolphins may move to, or from, areas where PFAS exposure is more or less likely. Bottlenose dolphins generally have high site fidelity,57 but a recent study found possible seasonal migration in dolphins around the Charleston area.58 Seasonal abundance estimates were highest in the summer,58 which is when dolphins in the present study were captured. Dolphin condition could affect PFAS plasma concentrations because processes like starvation or fasting might remobilize stored PFAS from blubber.17 Environmental changes might also influence differences by location or over time.
CONCLUSIONS
Despite the exceptions noted, stable or decreasing concentrations for most of the PFAS analyzed could indicate effective reduction or maintenance of concentrations in the environment. Increases in other PFAS such as PFHpA in Charleston dolphins may indicate an increase in the production of shorter-chain PFAS. Short-chain PFSAs were not measured in the present study. Additionally, there are other short-chain fluorinated alternatives not analyzed in this study, including perfluoroalkyl ether carboxylic acids and sulfonic acids, which have been identified as contaminants, such as in waters in North Carolina.59,60 Although bioaccumulation decreases with decreasing chain length, there is limited information on potential health and environmental impacts of replacement substances.15 In addition to the sample size limitations mentioned previously, the slightly different capture years and range between the locations and the gaps in the years with available data within the study time period were limitations of this study. Samples were only collected from dolphins until 2013 in Charleston, SC and until 2015 in Indian River Lagoon, FL. This could influence the different results seen by location.
Differences in PFAS concentrations seen between Charleston and Indian River Lagoon may indicate different potential sources of the PFAS in these locations. Future research should include source tracking of PFAS, such as PFHpA in Charleston, SC to determine if local sources exist. Additionally, because of the limitations of small sample size and fewer sample years for PFHpA and PFDS, further analysis that includes more years and a larger sample size could be completed to see if the findings can be replicated. The distribution, accumulation, fate, and trends for shorter-chain PFAS (C3–C5) and longer-chain PFAS (>C15) should be investigated in future studies.
In summary, results of this study suggest that plasma concentrations of most of the PFAS in this study were stable or decreasing over time, which could indicate effective reduction or maintenance in the environment resulting from regulation and phaseout. However, other PFAS concentrations may be increasing such as PFDoDA among female Indian River Lagoon dolphins and PFHpA concentrations among Charleston dolphins, although the analysis was limited by the small sample size and, for PFHpA among Charleston dolphins, fewer sample years. This study adds to the understanding of trends in PFAS among dolphins in urban U.S. environments. Because bottlenose dolphins serve as sentinel species, they may reflect environmental exposure trends, making the results relevant to understanding exposures and risks to other species.57
Supplementary Material
ACKNOWLEDGMENTS
We would like to thank Amila O. De Silva, Canada Centre for Inland Waters, and her laboratory for completing a portion of the dolphin plasma PFAS analysis for this study. We would also like to thank Environment Canada’s Laboratories and the Wadsworth Center for PFAS analysis of dolphin plasma samples.
Footnotes
Supporting Information
(Table S1) Per- and polyfluoroalkyl substances (PFAS) group, abbreviation, full name, and limit of detection (LOD) for sample years 2012–2013 and 2015; (Table S2) summary of median, geometric mean (GM), and range of per- and polyfluoroalkyl substances (PFAS) plasma concentrations (ng/g wet weight), by year, in bottlenose dolphins (Tursiops truncatus) from Charleston, SC; (Table S3) summary of median, geometric mean (GM), and range of per- and polyfluoroalkyl substances (PFAS) plasma concentrations (ng/g wet weight), by year, in bottlenose dolphins (Tursiops truncatus) from Indian River Lagoon, FL; (Table S4) temporal trend (% change per year) and 95% confidence intervals of concentrations of plasma per- and polyfluoroalkyl substances (PFAS) among bottlenose dolphins (Tursiops truncatus) sampled from Charleston, SC and Indian River Lagoon, FL, stratified by location; (Table S5) temporal trend (% change per year) and 95% confidence intervals of concentrations of plasma per- and polyfluoroalkyl substances (PFAS) among bottlenose dolphins (Tursiops truncatus) sampled from Charleston, SC and Indian River Lagoon, FL, combined; (Table S6) temporal trend (% change per year) and 95% confidence intervals of concentrations of plasma per- and polyfluoroalkyl substances (PFAS) among bottlenose dolphins (Tursiops truncatus) sampled from Charleston, SC and Indian River Lagoon, FL, stratified by location, using piecewise linear splines with a knot at 2005; (Table S7) temporal trend (% change per year) and 95% confidence intervals of concentrations of plasma per- and polyfluoroalkyl substances (PFAS) among bottlenose dolphins (Tursiops truncatus) sampled from Charleston, SC and Indian River Lagoon, FL, stratified by location and sex; (Table S8) temporal trend (% change per year) and 95% confidence intervals of concentrations of plasma per- and polyfluoroalkyl substances (PFAS) among bottlenose dolphins (Tursiops truncatus) sampled from Charleston, SC and Indian River Lagoon, FL, stratified by location for adult dolphins (classified as ≥10 years old for males and ≥6 years old for females); (Figures S1–S8) concentrations of per- and polyfluoroalkyl substances (PFAS) in plasma, with estimated population medians and 95% confidence intervals, by year, in bottlenose dolphins (Tursiops truncatus) from Charleston, SC and Indian River Lagoon, FL; (Figure S9) relative concentrations of plasma per- and polyfluoroalkyl substances (PFAS) per increasing year, with 95% confidence intervals, among bottlenose dolphins (Tursiops truncatus) sampled from Charleston, SC and Indian River Lagoon, FL stratified by location and sex; and (Figure S10) relative concentrations of plasma per- and polyfluoroalkyl substances (PFAS) per increasing year, with 95% confidence intervals, among bottlenose dolphins (Tursiops truncatus) sampled from Charleston, SC and Indian River Lagoon, FL stratified by location, for adult dolphins (classified as ≥10 years old for males and ≥6 years old for females).
REFERENCES
- (1).Lindstrom AB; Strynar MJ; Libelo EL Polyfluorinated Compounds: Past, Present, and Future. Environ. Sci. Technol 2011, 45, 7954–7961. [DOI] [PubMed] [Google Scholar]
- (2).Prevedouros K; Cousins IT; Buck RC; Korzeniowski SH Sources, fate and transport of perfluorocarboxylates. Environ. Sci. Technol 2006, 40, 32–44. [DOI] [PubMed] [Google Scholar]
- (3).Wang Z; Cousins IT; Scheringer M; Buck RC; Hungerbuhler K Global emission inventories for C4–C14 perfluoroalkyl carboxylic acid (PFCA) homologues from 1951 to 2030, part II: the remaining pieces of the puzzle. Environ. Int 2014, 69, 166–176. [DOI] [PubMed] [Google Scholar]
- (4).Buck RC; Franklin J; Berger U; Conder JM; Cousins IT; de Voogt P; Jensen AA; Kannan K; Mabury SA; van Leeuwen SPJ Perfluoroalkyl and polyfluoroalkyl substances in the environment: terminology, classification, and origins. Integr. Environ. Assess. Manage 2011, 7, 513–541. [DOI] [PMC free article] [PubMed] [Google Scholar]
- (5).Environmental Protection Agency US. EPA and 3M Announce Phase-out of PFOS, 2000. https://archive.epa.gov/epapages/newsroom_archive/newsreleases/33aa946e6cb11f35852568e1005246b4.html (accessed July 12, 2019).
- (6).Agency for Toxic Substances and Disease Registry Toxicological profile for Perfluoroalkyls (Draft for Public Comment); U.S. Department of Health and Human Services, Public Health Service: Atlanta, GA., 2018. [Google Scholar]
- (7).United Nations Environment Programme. Report of the Persistent Organic Pollutants Review Committee on the work of its second meeting, Addendum: Risk profile on perfluorooctane sulfonate; UNEP/POPS/POPRC.2/17/Add.5; 2006. http://chm.pops.int/TheConvention/POPsReviewCommittee/ReportsandDecisions/tabid/3309/Default.aspx (accessed March 9, 2019).
- (8).United Nations Environment Programme Recommendation by the Persistent Organic Pollutants Review Committee to list perfluorooctanoic acid (PFOA), its salts and PFOA-related compounds in Annex A to the Convention and draft text of the proposed amendment; UNEP/POPS/COP.9/14; 2019. http://chm.pops.int/TheConvention/ConferenceoftheParties/Meetings/COP9/tabid/7521/Default.aspx (accessed November 4, 2019).
- (9).United Nations Environment Programme. Listing of perfluorooctane sulfonic acid, its salts and perfluorooctane sulfonyl fluoride; UNEP/POPS/COP.4/SC-4/17; 2009. http://chm.pops.int/TheConvention/ConferenceoftheParties/Meetings/COP4/COP4Documents/tabid/531/Default.aspx (accessed March 9, 2019).
- (10).United Nations Environment Programme. Listing of perfluorooctanoic acid (PFOA), its salts and PFOA-related compounds; UNEP/POP/COP.9/SC-9/12; 2019. http://chm.pops.int/TheConvention/ConferenceoftheParties/Meetings/COP9/tabid/7521/Default.aspx (accessed November 4, 2019).
- (11).United Nations Environment Programme. Proposal to list perfluorohexane sulfonic acid (CAS No: 355–46–4, PFHxS), its salts and PFHxS-related compounds in Annexes A, B and/or C to the Stockholm Convention on Persistent Organic Pollutants; UNEP/POPS/POPRC.13/4; 2017. http://chm.pops.int/TheConvention/POPsReviewCommittee/Meetings/POPRC13/MeetingDocuments/tabid/6024/Default.aspx (accessed March 9, 2019).
- (12).United Nations Environment Programme. Stockholm Convention on Persistant Organic Pollutants (POPS), Texts and Annexes, Revised in 2017; 2018. http://chm.pops.int/TheConvention/Overview/TextoftheConvention/tabid/2232/Default.aspx (accessed November 4, 2019).
- (13).United Nations Environment Programme. Report of the Persistent Organic Pollutants Review Committee on the work of its sixth meeting-Addendum: Guidance on alternatives to perfluorooctane sulfonate and its derivatives; UNEP/POPS/POPRC.6/13/Add.3; 2010. http://chm.pops.int/TheConvention/POPsReviewCommittee/ReportsandDecisions/tabid/3309/Default.aspx (accessed March 9, 2019).
- (14).United Nations Environment Programme. Register of Acceptable Purposes on PFOS, its salts and PFOSF pursuant to paragraph 1 of part III of annex B of the Stockholm Convention. http://chm.pops.int/Implementation/Exemptions/AcceptablePurposes/AcceptablePurposesPFOSandPFOSF/tabid/794/Default.aspx (accessed November 5, 2019).
- (15).Wang Z; Cousins IT; Scheringer M; Hungerbühler K Fluorinated alternatives to long-chain perfluoroalkyl carboxylic acids (PFCAs), perfluoroalkane sulfonic acids (PFSAs) and their potential precursors. Environ. Int 2013, 60, 242–248. [DOI] [PubMed] [Google Scholar]
- (16).Houde M; Martin JW; Letcher RJ; Solomon KR; Muir DCG Biological monitoring of polyfluoroalkyl substances: A review. Environ. Sci. Technol 2006, 40, 3463–3473. [DOI] [PubMed] [Google Scholar]
- (17).Fair PA; Houde M Poly- and Perfluoroalkyl Substances in Marine Mammals. In Marine Mammal Ecotoxicology: Impacts of multiple stressors on population health, Elsevier/Academic Press Book: London: 2018; pp117–138. [Google Scholar]
- (18).Houde M; Wells RS; Fair PA; Bossart GD; Hohn AA; Rowles TK; Sweeney JC; Solomon KR; Muir DCG Polyfluoroalkyl Compounds in Free-Ranging Bottlenose Dolphins (Tursiops truncatus) from the Gulf of Mexico and the Atlantic Ocean. Environ. Sci. Technol 2005, 39, 6591–6598. [DOI] [PubMed] [Google Scholar]
- (19).Fair PA; Houde M; Hulsey TC; Bossart GD; Adams J; Balthis L; Muir DCG Assessment of perfluorinated compounds (PFCs) in plasma of bottlenose dolphins from two southeast US estuarine areas: Relationship with age, sex and geographic locations. Mar. Pollut. Bull 2012, 64, 66–74. [DOI] [PubMed] [Google Scholar]
- (20).Fair PA; Romano T; Schaefer AM; Reif JS; Bossart GD; Houde M; Muir D; Adams J; Rice C; Hulsey TC; Peden-Adams M Associations between perfluoroalkyl compounds and immune and clinical chemistry parameters in highly exposed bottlenose dolphins (Tursiops truncatus). Environ. Toxicol. Chem 2013, 32, 736–746. [DOI] [PubMed] [Google Scholar]
- (21).Fair PA; Adams J; Mitchum G; Hulsey TC; Reif JS; Houde M; Muir D; Wirth E; Wetzel D; Zolman E; McFee W; Bossart GD Contaminant blubber burdens in Atlantic bottlenose dolphins (Tursiops truncatus) from two southeastern US estuarine areas: concentrations and patterns of PCBs, pesticides, PBDEs, PFCs, and PAHs. Sci. Total Environ 2010, 408, 1577–1597. [DOI] [PubMed] [Google Scholar]
- (22).Fair PA; Mitchum G; Hulsey TC; Adams J; Zolman E; McFee W; Wirth E; Bossart GD Polybrominated diphenyl ethers (PBDEs) in blubber of free-ranging bottlenose dolphins (Tursiops truncatus) from two southeast Atlantic estuarine areas. Arch. Environ. Contam. Toxicol 2007, 53, 483–494. [DOI] [PubMed] [Google Scholar]
- (23).Hohn AA; Scott MD; Wells RS; Sweeney JC; Irvine AB Growth layers in teeth from known-age, free-ranging bottlenose dolphins. Mar. Mammal. Sci 1989, 5, 315–342. [Google Scholar]
- (24).Fair PA; Wolf B; White ND; Arnott SA; Kannan K; Karthikraj R; Vena JE Perfluoroalkyl substances (PFASs) in edible fish species from Charleston Harbor and tributaries, South Carolina, United States: Exposure and risk assessment. Environ. Res 2019, 171, 266–277. [DOI] [PMC free article] [PubMed] [Google Scholar]
- (25).De Silva AO; Spencer C; Ho KCD; Al Tarhuni M; Go C; Houde M; de Solla SR; Lavoie RA; King LE; Muir DCG; Fair PA; Wells RS; Bossart GD Perfluoroalkylphosphinic Acids in Northern Pike (Esox lucius), Double-Crested Cormorants (Phalacrocorax auritus), and Bottlenose Dolphins (Tursiops truncatus) in Relation to Other Perfluoroalkyl Acids. Environ. Sci. Technol 2016, 50, 10903–10913. [DOI] [PubMed] [Google Scholar]
- (26).Gribble MO; Bartell SM; Kannan K; Wu Q; Fair PA; Kamen DL Longitudinal measures of perfluoroalkyl substances (PFAS) in serum of Gullah African Americans in South Carolina: 2003–2013. Environ. Res 2015, 143, 82–88. [DOI] [PMC free article] [PubMed] [Google Scholar]
- (27).Reiner JL; Becker PR; Gribble MO; Lynch JM; Moors AJ; Ness J; Peterson D; Pugh RS; Ragland T; Rimmer C; Rhoderick J; Schantz MM; Trevillian J; Kucklick JR Organohalogen Contaminants and Vitamins in Northern Fur Seals (Callorhinus ursinus) Collected During Subsistence Hunts in Alaska. Arch. Environ. Contam. Toxicol 2016, 70, 96–105. [DOI] [PMC free article] [PubMed] [Google Scholar]
- (28).Fair PA; Muir DCG; Small J; Sturman S; Adams J; Houde M; Bossart GD Tissue Distribution of Perfluoroalkyl Compounds In Bottlenose Dolphins (Tursiops truncatus) from Southeast Coastal USA. Organohalogen Compd 2007, 69, 849. [Google Scholar]
- (29).Lam JCW; Lyu J; Kwok KY; Lam PKS Perfluoroalkyl Substances (PFASs) in Marine Mammals from the South China Sea and Their Temporal Changes 2002–2014: Concern for Alternatives of PFOS? Environ. Sci. Technol 2016, 50, 6728–6736. [DOI] [PubMed] [Google Scholar]
- (30).Greaves AK; Letcher RJ; Sonne C; Dietz R; Born EW Tissue-Specific Concentrations and Patterns of Perfluoroalkyl Carboxylates and Sulfonates in East Greenland Polar Bears. Environ. Sci. Technol 2012, 46, 11575–11583. [DOI] [PubMed] [Google Scholar]
- (31).Huber S; Ahrens L; Bårdsen B-J; Siebert U; Bustnes JO; Vikingsson GA; Ebinghaus R; Herzke D Temporal trends and spatial differences of perfluoroalkylated substances in livers of harbor porpoise (Phocoena phocoena) populations from Northern Europe, 1991–2008. Sci. Total Environ 2012, 419, 216–224. [DOI] [PubMed] [Google Scholar]
- (32).Houde M; De Silva AO; Muir DCG; Letcher RJ Monitoring of perfluorinated compounds in aquatic biota: an updated review. Environ. Sci. Technol 2011, 45, 7962–7973. [DOI] [PubMed] [Google Scholar]
- (33).White ND; Balthis L; Kannan K; De Silva AO; Wu Q; French KM; Daugomah J; Spencer C; Fair PA Elevated levels of perfluoroalkyl substances in estuarine sediments of Charleston, SC. Sci.Total Environ 2015, 521–522, 79–89. [DOI] [PubMed] [Google Scholar]
- (34).U.S. Department of Defense Joint Base Charleston. https://www.jbcharleston.jb.mil/About-Us/ (accessed December 23, 2018).
- (35).Indian River Lagoon National Estuary Program and St. Johns River Water Management District. Indian River Lagoon: An Introduction to a National Treasure; 2007. https://www.epa.gov/nep/state-bayreport-indian-river-lagoon (accessed October 13, 2019).
- (36).Ahrens L; Norström K; Viktor T; Cousins AP; Josefsson S Stockholm Arlanda Airport as a source of per- and polyfluoroalkyl substances to water, sediment and fish. Chemosphere 2015, 129, 33–38. [DOI] [PubMed] [Google Scholar]
- (37).Moody CA; Hebert GN; Strauss SH; Field JA Occurrence and persistence of perfluorooctanesulfonate and other perfluorinated surfactants in groundwater at a fire-training area at Wurtsmith Air Force Base, Michigan, USA. J. Environ. Monit 2003, 5, 341–345. [DOI] [PubMed] [Google Scholar]
- (38).Hart K; Gill VA; Kannan K Temporal trends (1992–2007) of perfluorinated chemicals in Northern Sea Otters (Enhydra lutris kenyoni) from South-Central Alaska. Arch. Environ. Contam. Toxicol 2009, 56, 607–614. [DOI] [PubMed] [Google Scholar]
- (39).Sedlak MD; Benskin JP; Wong A; Grace R; Greig DJ Per- and polyfluoroalkyl substances (PFASs) in San Francisco Bay wildlife: Temporal trends, exposure pathways, and notable presence of precursor compounds. Chemosphere 2017, 185, 1217–1226. [DOI] [PubMed] [Google Scholar]
- (40).Bytingsvik J; van Leeuwen SPJ; Hamers T; Swart K; Aars J; Lie E; Nilsen EME; Wiig Ø; Derocher AE; Jenssen BM Perfluoroalkyl substances in polar bear mother-cub pairs: a comparative study based on plasma levels from 1998 and 2008. Environ. Int 2012, 49, 92–99. [DOI] [PubMed] [Google Scholar]
- (41).Smythe TA; Loseto LL; Bignert A; Rosenberg B; Budakowski W; Halldorson T; Pleskach K; Tomy GT Temporal trends of brominated and fluorinated contaminants in Canadian Arctic beluga (Delphinapterus leucas). Arct. Sci 2018, 4, 388–404. [Google Scholar]
- (42).Gui D; Zhang M; Zhang T; Zhang B; Lin W; Sun X; Yu X; Liu W; Wu Y Bioaccumulation behavior and spatiotemporal trends of per- and polyfluoroalkyl substances in Indo-Pacific humpback dolphins from the Pearl River Estuary, China. Sci. Total Environ 2019, 658, 1029–1038. [DOI] [PubMed] [Google Scholar]
- (43).Reiner JL; O’Connell SG; Moors AJ; Kucklick JR; Becker PR; Keller JM Spatial and temporal trends of perfluorinated compounds in Beluga Whales (Delphinapterus leucas) from Alaska. Environ. Sci. Technol 2011, 45, 8129–8136. [DOI] [PubMed] [Google Scholar]
- (44).Environmental Protection Agency US. Fact Sheet: 2010/2015 PFOA Stewardship Program. https://www.epa.gov/assessing-andmanaging-chemicals-under-tsca/fact-sheet-20102015-pfoastewardship-program (accessed October 13, 2019). [Google Scholar]
- (45).Dassuncao C; Hu XC; Zhang X; Bossi R; Dam M; Mikkelsen B; Sunderland EM Temporal Shifts in Poly- and Perfluoroalkyl Substances (PFASs) in North Atlantic Pilot Whales Indicate Large Contribution of Atmospheric Precursors. Environ. Sci. Technol 2017, 51, 4512–4521. [DOI] [PMC free article] [PubMed] [Google Scholar]
- (46).Hu XC; Andrews DQ; Lindstrom AB; Bruton TA; Schaider LA; Grandjean P; Lohmann R; Carignan CC; Blum A; Balan SA; Higgins CP; Sunderland EM Detection of Poly- and Perfluoroalkyl Substances (PFASs) in U.S. Drinking Water Linked to Industrial Sites, Military Fire Training Areas, and Wastewater Treatment Plants. Environ. Sci. Technol. Lett 2016, 3, 344–350. [DOI] [PMC free article] [PubMed] [Google Scholar]
- (47).Fiedler S; Pfister G; Schramm K-W Poly- and perfluorinated compounds in household consumer products. Toxicol. Environ. Chem 2010, 92, 1801–1811. [Google Scholar]
- (48).Conder JM; Hoke RA; De Wolf W; Russell MH; Buck RC Are PFCAs bioaccumulative? A critical review and comparison with regulatory criteria and persistent lipophilic compounds. Environ. Sci. Technol 2008, 42, 995–1003. [DOI] [PubMed] [Google Scholar]
- (49).Houde M; Balmer BC; Brandsma S; Wells RS; Rowles TK; Solomon KR; Muir DCG Perfluoroalkyl compounds in relation to life-history and reproductive parameters in bottlenose dolphins (Tursiops truncatus) from Sarasota Bay, Florida, U.S.A. Environ. Toxicol. Chem 2006, 25, 2405–2412. [DOI] [PubMed] [Google Scholar]
- (50).Gebbink WA; Bossi R; Riget FF; Rosing-Asvid A; Sonne C; Dietz R Observation of emerging per- and polyfluoroalkyl substances (PFASs) in Greenland marine mammals. Chemosphere 2016, 144, 2384–2391. [DOI] [PubMed] [Google Scholar]
- (51).Hart K; Kannan K; Isobe T; Takahashi S; Yamada TK; Miyazaki N; Tanabe S Time trends and transplacental transfer of perfluorinated compounds in melon-headed whales stranded along the Japanese coast in 1982, 2001/2002, and 2006. Environ. Sci. Technol 2008, 42, 7132–7337. [DOI] [PubMed] [Google Scholar]
- (52).Grønnestad R; Villanger GD; Polder A; Kovacs KM; Lydersen C; Jenssen BM; Borgå K Maternal transfer of perfluoroalkyl substances in hooded seals. Environ. Toxicol. Chem 2017, 36, 763–770. [DOI] [PubMed] [Google Scholar]
- (53).Dorneles PR; Lailson-Brito J; Azevedo AF; Meyer J; Vidal LG; Fragoso AB; Torres JP; Malm O; Blust R; Das K High accumulation of perfluorooctane sulfonate (PFOS) in marine tucuxi dolphins (Sotalia guianensis) from the Brazilian coast. Environ. Sci. Technol 2008, 42, 5368–5373. [DOI] [PubMed] [Google Scholar]
- (54).Van de Vijver KI; Holsbeek L; Das K; Blust R; Joiris C; De Coen W Occurrence of perfluorooctane sulfonate and other perfluorinated alkylated substances in harbor porpoises from the Black Sea. Environ. Sci. Technol 2007, 41, 315–320. [DOI] [PubMed] [Google Scholar]
- (55).Galatius A; Dietz R; Riget FF; Sonne C; Kinze CC; Lockyer C; Bossi R Temporal and life history related trends of perfluorochemicals in harbor porpoises from the Danish North Sea. Mar. Pollut. Bull 2011, 62, 1476–1483. [DOI] [PubMed] [Google Scholar]
- (56).Tartu S; Bourgeon S; Aars J; Andersen M; Lone K; Jenssen BM; Polder A; Thiemann GW; Torget V; Welker JM; Routti H Diet and metabolic state are the main factors determining concentrations of perfluoroalkyl substances in female polar bears from Svalbard. Environ. Pollut 2017, 146–158. [DOI] [PubMed] [Google Scholar]
- (57).Bossart GD Marine mammals as sentinel species for oceans and human health. Vet. Pathol 2011, 48, 676–690. [DOI] [PubMed] [Google Scholar]
- (58).Taylor Anna R; Schacke John H; Speakman Todd R; Castleberry Steven B; Chandler Richard B Factors related to common bottlenose dolphin (Tursiops truncatus) seasonal migration along South Carolina and Georgia coasts, USA. Animal Migration 2016, 3 (1), 14–26. [Google Scholar]
- (59).Strynar M; Dagnino S; McMahen R; Liang S; Lindstrom A; Andersen E; McMillan L; Thurman M; Ferrer I; Ball C Identification of Novel Perfluoroalkyl Ether Carboxylic Acids (PFECAs) and Sulfonic Acids (PFESAs) in Natural Waters Using Accurate Mass Time-of-Flight Mass Spectrometry (TOFMS). Environ. Sci. Technol 2015, 49, 11622–11630. [DOI] [PubMed] [Google Scholar]
- (60).Sun M; Arevalo E; Strynar M; Lindstrom A; Richardson M; Kearns B; Pickett A; Smith C; Knappe DRU Legacy and Emerging Perfluoroalkyl Substances Are Important Drinking Water Contaminants in the Cape Fear River Watershed of North Carolina. Environ. Sci. Technol. Lett 2016, 3, 415–419. [Google Scholar]
Associated Data
This section collects any data citations, data availability statements, or supplementary materials included in this article.