

Abstract
BACKGROUND AND PURPOSE:
The efficacy of deep brain stimulation in treating movement disorders depends critically on electrode localization, which is conventionally described by using coordinates relative to the midcommissural point. This approach requires manual measurement and lacks spatial normalization of anatomic variances. Normalization is based on intersubject spatial alignment (coregistration) of corresponding brain structures by using different geometric transformations. Here, we have devised and evaluated a scheme for automated subcortical optimization of coregistration (ASOC), which maximizes patient-to-atlas normalization accuracy of postoperative structural MR imaging into the standard Montreal Neurologic Institute (MNI) space for the basal ganglia.
MATERIALS AND METHODS:
Postoperative T2-weighted MR imaging data from 39 patients with Parkinson disease and 32 patients with dystonia were globally normalized, representing the standard registration (control). The global transformations were regionally refined by 2 successive linear registration stages (RSs) (ASOC-1 and 2), focusing progressively on the basal ganglia with 2 anatomically selective brain masks, which specify the reference volume (weighted cost function). Accuracy of the RSs was quantified by spatial dispersion of 16 anatomic landmarks and their root-mean-square errors (RMSEs) with respect to predefined MNI-based reference points. The effects of CSF volume, age, and sex on RMSEs were calculated.
RESULTS:
Mean RMSEs differed significantly (P < .001) between the global control (4.2 ± 2.0 mm), ASOC-1 (1.92 ± 1.02 mm), and ASOC-2 (1.29 ± 0.78 mm).
CONCLUSIONS:
The present method improves the registration accuracy of postoperative structural MR imaging data into MNI space within the basal ganglia, allowing automated normalization with increased precision at stereotactic targets, and enables lead-contact localization in MNI coordinates for quantitative group analysis.
The therapeutic efficacy of deep brain stimulation (DBS) and the occurrence of side effects are dependent on the localization of the electrode. Various targets have been described to be effective in different neurologic disorders, for example, the subthalamic nucleus (STN) and adjacent structures in Parkinson disease (PD)1,2 and the internal pallidum (GPi) in dystonia.3 Yet, optimal precise target localization remains controversial. Assessment of localizations on postoperative structural MR imaging data in their specific anatomic context requires spatial normalization to transform individual anatomic variability4–6 by geometric alignment of corresponding structures across patients (patient-to-patient) or to a standard (patient-to-atlas). Commonly, the position of the electrode is indirectly reported in coordinates along the 3 axes relative to the midcommissural point (MCP) between the anterior commissure (AC) and posterior commissure (PC)1,6–11 and is normalized by the individual distance from the AC to the PC in relation to a standard atlas ACPC distance.
However, this normalization method disregards the individual mediolateral and dorsoventral dimensions, despite the substantial variability of the GPi12,13 and the STN8,9,14,15 with respect to the MCP.16,17 For instance, the AC can vary in diameter from 3 to 8 mm,18 and the inter-rater ambiguity in manual selection leads to considerable variations in assessment of the target STN and GPi.6 These inconsistencies erroneously scale distances along all 3 axes by misjudging the ACPC distance, on which this normalization is based.
Several groups have derived electrode positions from postoperative MR imaging data with respect to the MCP and transferred them to figures of histologic stereotactic atlases.1,2,19–23 To improve concordance of outlines of the patient's MR imaging−based nuclei with the atlas nuclei, some studies have applied manual atlas deformations.1,23 However, manual assessment of the nuclear outlines is prone to limited inter-rater reliability.5 Another approach24 is based on the manual definition of reliably identifiable landmarks to transform MR imaging data into the stereotactic Atlas of the Human Brain.25 Nevertheless, an automatic approach would reduce the effort necessary on the part of the expert and avoid inaccuracies that can arise from manual assessment of anatomic landmarks. Recently, automated registration of atlas MR imaging data of a brain specimen and the corresponding histologic section to individual MR imaging (atlas-to-patient) was shown to be robust and accurate.26–28 These methods permit registration of MR imaging data with a specific atlas space, which is based on a few individuals (postmortem print atlases) with detailed but individual anatomic measures. However, a more standardized population-based stereotactic space would be advantageous to account for broad anatomic variety4,5 and enable quantitative reference to points within anatomic structures or substructures.
In this study, we investigated the accuracy and variance of regionally optimized automated linear registration of postoperative structural T2-weighted MR imaging data into the standardized population-based Montreal Neurologic Institute (MNI) stereotactic space (patient-to-atlas), which is based on 152 individuals (MNI-152). MNI space is a widely accepted reference system provided by the International Consortium of Brain Mapping5,29 and provides a degree of structural normality, allowing direct comparison of MNI localizations in quantitative group analysis.
Materials and Methods
Patients and MR Imaging Data Acquisition
The primary end point of this study was the cross-subject accuracy of anatomic localization in the basal ganglia of MR imaging data of patients with uni- or bilaterally implanted DBS electrodes compared among conventional versus 2 optimized registration approaches. This registration scheme was optimized and evaluated on the postoperative T2-weighted MR imaging data of 39 patients with PD (median age, 66 years; range, 42–77 years; 17 men) and 32 patients with dystonia (median age, 46 years; range, 17–72 years; 26 men).
These MR imaging data ensured realistic conditions such as geometric distortions and signal-intensity loss due to the susceptibility artifacts of the electrode. Because these artifacts may affect the level of accuracy of registration methods, healthy controls were not included in this study. Patients with different degrees of cerebral atrophy and ventricular enlargement were explicitly included to achieve a representative sample. Exclusion criteria included strong motion artifacts or a low signal intensity–to-noise ratio.
MR imaging was performed on a 1.5T scanner (NT Intera; Philips Medical Systems, Best, the Netherlands) within 5 days after implantation of electrodes, and sections were obtained in both the coronal and transverse planes. DBS patients are subject to limitations of the specific absorption rate (SAR) specified by the manufacturer of electrodes (www.medtronic.com; electrode model 3387 and 3389; <0.1 W/kg) to minimize the risk of hazardous interactions of the electromagnetic field with implanted DBS devices. SAR specifications were followed by using a transmit-receive head coil and a dedicated T2-weighted fast spin-echo (FSE) sequence in a low SAR mode with the following parameters: TR/TE, 3500/138 ms; echo-train length, 8; excitations, 3; flip angle, 90°; section thickness, 2 mm; section gap, 0.2 mm; FOV, 260 mm (in-plane resolution 0.51 × 0.51 mm); matrix size, 384 interpolated to 512; total acquisition time, 10 minutes 41 seconds; Philips software Version 11.1 level 4. The present T2-weighted FSE sequence was preferred to other MR imaging sequences applied in DBS-treated patients30 due to an improved contrast-to-noise ratio of the targeted nuclear structures, particularly the STN. This sequence was similarly used for the stereotactic planning routine.
Image Preprocessing and Global Normalization
Postoperative MR imaging data were processed by using the Software Library31 from the Oxford Centre for Functional MR Imaging of the Brain (FMRIB, http://www.fmrib.ox.ac.uk). Initially, brain tissue was segmented from nonbrain tissue to provide skull-stripped MR imaging data.
Skull-stripped MR imaging data were spatially normalized in 1 conventional global and 2 subsequent reference mask−guided registration stages (RSs), applying linear transformations with the Linear Image Registration Tool (FMRIB),29 which preserves the proportions (ratios of distances) of structures among one another along parallel lines.
Linear coregistration to the MNI-152 T2 average brain template5 by using the 4 standard transformations: scale, rotation, translation, and shear along all 3 axes (affine transform) provided the basic global transformation matrices. This global registration represented the control group and served as a starting point for the optimized RSs. All registrations within this study apply the mutual information similarity metric, which measures the statistical mutual dependence of image intensities between the individual MR imaging and the reference template,32 to obtain the best match of alignment.
Estimation of the volume of ventricular CSF (VCSF) was performed by using the cross-sectional Structural Image Evaluation tool, which accurately and robustly33 differentiates MR imaging data into different tissue types (gray matter, white matter, CSF) and produces a partial volume map providing the proportion of a certain tissue type present in each voxel. Segmented horizontal data were visually inspected and superimposed on the original MR imaging data to control for obvious inaccuracies, and no manual editing was considered necessary. Non-normalized VCSF volumes were calculated by summing up the VCSF partial volume values by multiplication of their mean value by their volume in voxels. Normalized values of VCSF were derived by multiplication of the measured non-normalized VCSF volumes by the 3 scales of the global transformation matrix.
Automated Subcortical Optimization of MR Imaging−Atlas Coregistration
To account for cerebral atrophy and ventricular enlargement, frequently seen in patients with PD,34 we created a subcortical brain mask in MNI-152 1-mm stereotactic space, which comprises a broad structural variety of subcortical anatomic structures (Fig 1A). The subcortical brain mask specifies the region of the MNI-152 T1 1-mm brain template, which is applied as a structural reference (weighted cost function) in the first stage of automated subcortical optimization of coregistration (ASOC-1). This first regionally optimized registration step uses the transformations of scale, rotation, and translation along 3 axes (9 df). The search for optimal alignments in ASOC-1 was initialized with the transformation matrices from the global registration.
Fig 1.

Brain masks for regionally optimized coregistration to the Montreal Neurologic Institute (MNI) stereotactic space and definition of reference points for assessment of registration accuracy. A and B, The subcortical brain mask (blue) covers a broad subcortical structural variety, including enlarged ventricles (automated subcortical optimization of coregistration 1[ASOC-1]). The stereotactic mask (yellow) closely encompasses the basal ganglia and focuses specifically on dorsoventral levels of the targets subthalamic nucleus (STN) and internal pallidum (GPi). 3D visualizations of the volume of both brain masks are displayed. C and D, The 16 reference points are defined in T1-weighted MNI based high-resolution stereotactic space (C) and are shown in a patient's normalized T2-weighted MR imaging example (D). They are presented in horizontal planes inferior to the anterior commissure (AC) at 0 mm (upper-left), 2 mm (upper-right), 4 mm (lower-left), and 8.5 mm (lower-right). acn indicates anterior cutting site of the caudate nucleus caput; ap, anterior pole of the putamen; pcn, posterior cutting site of the caudate nucleus caput and lateral ventricle, ac, anterior commissure; mp, medial pole of the internal pallidum, arn, anterior pole of the red nucleus; pp, posterior pole of the putamen; pc, posterior commissure; mb, mamillary body at intersection with the pars tecta fornicis.
For the second RS of ASOC (ASOC-2), the MNI-152 1-mm T1 template5 was interpolated (3D windowed Sinc) in a novel stereotactic volume with identical MNI coordinates but increased spatial resolution with a voxel size of 0.22 × 0.22 × 0.5 mm3. Although its lateral and anteroposterior extents entirely composed the basal ganglia (Fig 1 B), its axial extents ranged from 13 mm superior to 22 mm inferior with respect to the AC, aiming at stereotactic target levels.
In comparison with the native space of MR imaging data, the increased spatial resolution of this volume provides a denser 3D grid of voxels, which better approximates irregular positions of geometrically transformed voxels of the original MR imaging data. This stereotactic volume allows more precise mapping in the interpolation of the skull-stripped MR imaging data after the final RS (ASOC-2), with a minimal loss of quality, and facilitates referencing the locations more accurately.
A stereotactic brain mask was developed in the stereotactic volume, which precisely encompasses the margins of the basal ganglia but omits the lateral ventricles. The axial extents of this mask were restricted to 7 mm above to 18 mm below the intercommissural axis (Fig 1B). The stereotactic brain mask specifies the region of the stereotactic volume, which is applied as a structural reference (weighted cost function) in ASOC-2. ASOC-2 was initialized with the transformation matrices from ASOC-1 as start transformations and used similar registration properties of 9 df, including scale, rotation, and translation. The resulting matrices from ASOC-2 allowed direct transformation and resampling of the genuine skull-stripped MR imaging data into the stereotactic volume by using 3D-windowed sinc interpolation.
Evaluation of Coregistration Accuracy
Assessment of the accuracy of the different RSs was based on 16 anatomically defined reference points (Table 1 and Fig 1C), which verify both interior landmarks close to stereotactic targets (eg, the anterior pole of the red nucleus referring to the STN35) and landmarks at the outlines of the nuclei to detect translational and scaling errors. They were based on high-contrast boundaries of anatomic structures to minimize rater-dependent manual error24,36 and were defined on the axial planes in the high-resolution stereotactic volume (Fig 1C). The pars tecta of the fornices and their transition into the mamillary bodies run nearly horizontal and appear as a small but clearly identifiable structure on axial T2-weighted MR imaging (arrow on Fig 1D). This transition provides a distinctive boundary along the dorsoventral axis and indicates, together with the commissures, dorsoventral displacement of the RSs along this axis.
Table 1:
Definition of reference points and accuracy of RSs*
| Reference Points/Landmark Label | Conditions of Measurement | Side | MNI Coordinates |
Global RS |
ASOC-2 |
||||
|---|---|---|---|---|---|---|---|---|---|
| X | Y | Z | RMSE | SD | RMSE | SD | |||
| AC | Sagittal: superior limit; axial: center | 0.33 | 2.52 | −3 | 3.52 | 1.74 | 1.26 | 0.70 | |
| PC | Sagittal: center; axial: center | 0.33 | −25.6 | −2.5 | 3.91 | 1.65 | 0.93 | 0.72 | |
| Anterior cutting site of caudate nucleus caput and lat. ventricle | Axial: at the axial level of the superior limit of AC | Right | 14.37 | 24.6 | −3 | 4.59 | 2.26 | 1.00 | 0.59 |
| Left | −13.9 | 23.7 | −3 | 4.33 | 2.36 | 0.97 | 0.59 | ||
| Posterior cutting site of caudate nucleus caput and lat. ventricle | Axial: at the axial level of the superior limit of AC | Right | 5.3 | 11.4 | −3 | 4.74 | 2.21 | 1.78 | 0.96 |
| Left | −4.63 | 10.3 | −3 | 4.39 | 2.15 | 1.93 | 1.08 | ||
| Anterior pole of putamen | Axial: 2 mm inferior to the superior limit of AC | Right | 20.85 | 20.2 | −5 | 4.56 | 1.97 | 1.31 | 0.71 |
| Left | −20.4 | 19.6 | −5 | 4.25 | 2.22 | 1.33 | 0.77 | ||
| Posterior pole of putamen | Axial: 2 mm inferior to the superior limit of AC | Right | 33.17 | −19.1 | −5 | 5.07 | 1.71 | 1.4 | 0.66 |
| Left | −31.6 | −19.7 | −5 | 4.96 | 2.21 | 1.62 | 0.78 | ||
| Medial pole of internal pallidum | Axial: 2 mm inferior to the superior limit of AC | Right | 10.49 | −0.94 | −5 | 4.20 | 1.84 | 1.24 | 0.62 |
| Left | −10.7 | −2.24 | −5 | 3.79 | 1.98 | 1.42 | 0.55 | ||
| Most anterior pole of red nucleus | Axial: at the level of the most anterior part | Right | 5.52 | −14.3 | −7 | 3.79 | 1.81 | 0.84 | 0.56 |
| Left | −4.85 | −14.6 | −7 | 4.04 | 1.77 | 0.89 | 0.48 | ||
| Mamillary body at intersection with the pars tecta fornicis | Axial: center of the mamillary bodies | Right | 2.93 | −8.93 | −11.5 | 3.50 | 1.73 | 1.40 | 0.86 |
| Left | −2.04 | −8.93 | −11.5 | 3.39 | 1.74 | 1.29 | 0.75 | ||
Note:—MNI indicates Montreal Neurologic Institute; RMSE, root-mean-square error; lat., lateral; RS, registration stage; ASOC-2, automated subcortical optimization of coregistration 2; AC, anterior commissure; PC, posterior commissure.
Anatomic definition of reference points in MNI-152—based coordinates are specified in the high-resolution stereotactic volume. Additionally, the results of the assessment of registration accuracy (mean RMSE) and SD are presented. Note that the midsaggital plane in the high-resolution stereotactic volume is lateralized exactly at 0.33 mm at the x-axis. This subtle shift explains the apparent asymmetries of the lateral extents of the reference points.
Particular emphasis was placed to consistently localize specific edges or centers (specified in Table 1) in the measurement of landmarks for all 71 patients within the stereotactic volume in an effort to minimize rater-dependent error.
Linear transformations, including translations in each RS, were represented by 4 × 4 matrices of floating-point numbers by using 6 decimal digits of precision and were inverted, resulting in inverse transformation matrices back to original MR imaging data. Because the matrix products of inverse matrices of 1 RS by transformation matrices of another RS facilitate accurate forward and backward mapping of positions between RSs, coordinates of the measured 16 landmarks per patient were transformed to their identical corresponding localizations in all other RSs, with 6 decimal digits of precision in all 3 planes.
This process assures robustness in comparison of the accuracy of the RSs among each other, because the rater-dependent error in assessing the landmarks primarily affects the absolute registration error instead of the relative error between RSs.
Spatial dispersion toward the predefined reference point was quantified with the root-mean-square difference error (RMSE), which describes the shortest distance between 2 points.
Comparison of RSs
The accuracy of RSs was validated by the mean and SD (μ ± σ) of the RMSE of the RSs. Additionally, the effects of RS, age, sex, VCSF volume, and disorder on the RMSE were evaluated in a general linear model (GLM) by using the Bonferroni adjustment for multiple comparisons of marginal means, significant at the .05 level. In addition to this complete model, the GLM was calculated separately at each RS (Table 2).
Table 2:
Results of different effects on registration accuracy*
| Effect Type | Effect | Global Stage GLM |
ASOC-1 GLM |
ASOC-2 GLM |
Complete GLM (all stages) |
||||
|---|---|---|---|---|---|---|---|---|---|
| Effect Signif. | Effect Size | Effect Signif. | Effect Size | Effect Signif. | Effect Size | Effect Signif. | Effect Size | ||
| Repeated within-patient effects | Landmark | .235 | .019 | 0.175 | 0.021 | .288 | .018 | .428 | 0.015 |
| Registration stage | .002‡ | 0.092 | |||||||
| Between-patient effects | Disorder | .589 | .005 | 0.148 | 0.032 | .882 | .000 | .918 | 0.000 |
| Sex | .014† | .09 | 0.385 | 0.011 | .198 | .025 | .019† | 0.080 | |
| Covariates | Age | .074 | .048 | 0.386 | 0.011 | .167 | .028 | .089 | 0.043 |
| VCSF | .555 | .005 | 0.001† | 0.146 | .262 | .019 | .575 | 0.005 | |
Note:—Signif. indicates significance; VSCF, ventricular CSF; GLM, general linear model.
Effects of different variables on RMSE were calculated in a GLM, both separately at each RS and as a complete model. They are presented with their effect size (partial η2) and significance at the 95% confidence interval.
Significant at the .05 level.
Significant at the .01 level.
Results
Registration Accuracy of the RSs
The overall mean RMSE of the global affine RS averages at 4.20 ± 2.01 mm. In comparison, the mean RMSE is progressively reduced (Figs 2 and 3) at ASOC-1 (1.92 ± 1.02 mm, P < .001) and ASOC-2 (1.29 ± 0.78 mm, P < .001). Similarly, the effect of the RS is significant in the complete GLM (P = .002, Table 2).
Fig 2.

Accuracy of registration stages (RSs) measured by spatial dispersion of landmarks with respect to reference points. Boxplots of the root-mean-square errors (RMSEs) of 16 landmarks for all 71 patients are shown for each RS. The median RMSE of the global affine RS (control) more than doubles that of ASOC-1 (subcortical mask). The second optimization stage, ASOC-2, achieves the lowest median RMSE and interquartile range. Asterisks indicate that the mean difference is significant at the .001 level.
Fig 3.
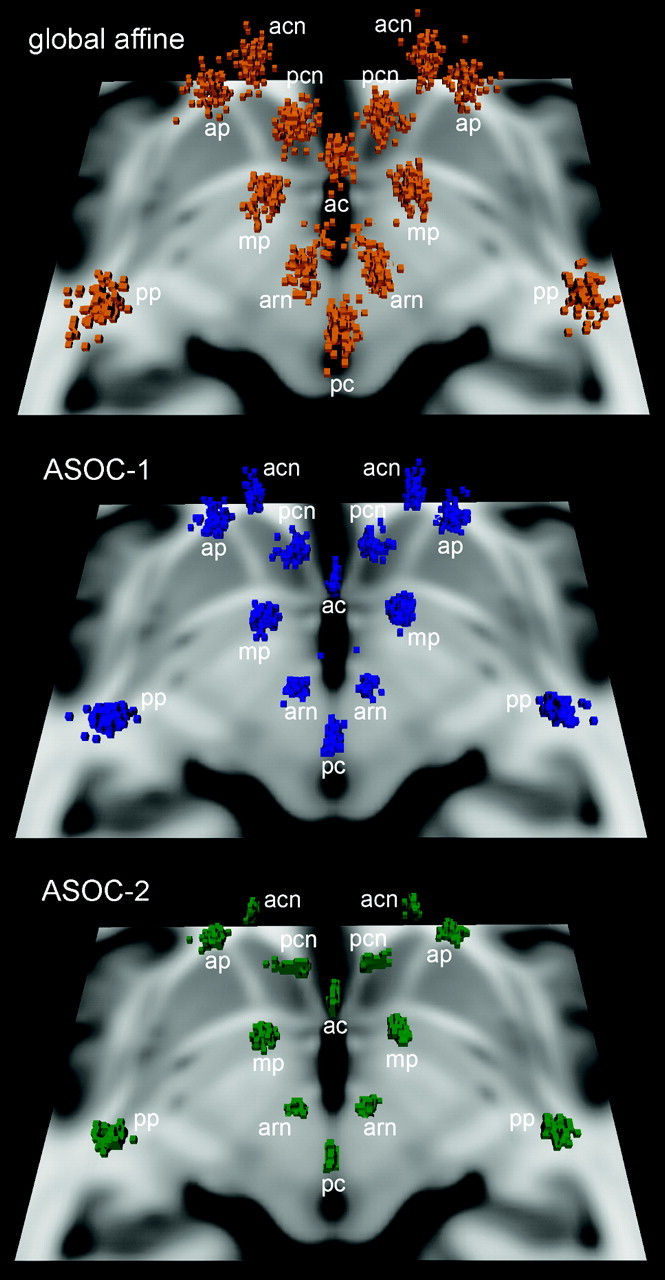
Spatial distributions of landmarks in all 71 patients at the 3 RSs. The scatterplots visualize a reduced dispersion at ASOC-1 and, in particular, at ASOC-2 in comparison with the standard global affine method. The shown horizontal section of the T1-weighted MNI-152 brain at 4 mm inferior to the ACPC provides orientation to the superiorly located landmarks, AC, PC, and the red nucleus, and caudate- and putamen-based landmarks (See also Fig. 1).
In comparison with other landmarks, mean RMSEs in ASOC-2 were increased at the posterior putamen and the posterior caudate caput and were decreased at landmarks close to the midsagittal line, such as the red nucleus (Table 1). In the global RS, augmented RMSEs were observed at the anteroventral caudate caput, whereas the RMSEs of both mamillary bodies and the AC were diminished (Table 1).
Registration Accuracy in Regard to Disease and Sex
Sex-specific RMSE differences were significant, with pronounced effect sizes in the complete and global GLM (Table 2; increased in the global stage, RMSE of 4.56 ± 2.18 mm in men versus 3.63 ± 1.59 mm in women). These differences occurred primarily in dystonia (RMSE of 4.73 ± 2.19 mm in male and 3.32 ± 1.43 mm in female patients with dystonia; 4.44 ± 2.17 mm in men versus 3.99 ± 1.70 mm in women with PD). RMSE was decreased at other RSs to 1.98 ± 1.08 mm versus 1.80 ± 0.91 mm in ASOC-1 and 1.34 ± 0.81 mm versus 1.21 ± 0.74 mm in ASOC-2 in men and women, respectively.
In general, no disease-specific differences were observed in the GLM, which compensates for confounders such as the increased prevalence of higher VCSF volume in PD. However, the raw data reflect a mean RMSE of 4.07 ± 2.00 mm versus 4.29 ± 2.04 mm in the global RS, 1.72 ± 0.87 mm versus 2.06 ± 0.34 mm in ASOC-1, and 1.23 ± 0.75 mm versus 1.33 ± 0.81 mm in ASOC-2 in patients with dystonia versus those with PD, respectively. Specifically, in ASOC-2, most increased differences at single landmarks were obtained at the left posterior caudate caput with an RMSE increase of 0.39 mm in PD. The side difference between the increased RMSE at the left versus right posterior caudate caput in ASOC-2 was significant (paired t test, P = .033) in patients with PD only. In patients with PD, the left anterior putamen appeared with RMSE increases of 0.51 mm in ASOC-1 and 0.46 mm at the global RS.
Registration Accuracy Regarding the Age and Volume of VCSF
Regarding the effect of age on RMSE, a positive significant correlation (Pearson, 2-tailed) can be demonstrated for the global RS (r = 0.14, P < .001), ASOC-1 (r = 0.109, P < .001), and ASOC-2 (r = 0.092, P = .002). However, the complete GLM revealed the confounding correlation of VCSF volume with RMSE and age and demonstrated a trend of the pure effect of age on RMSE (P = .089, Table 2). Overall, the VCSF volume significantly correlated (r = 0.267, P = .025) with patient age at implantation of DBS electrodes, but no differences were found in subgroups of patients with PD (r = 0.18; P = .27) and dystonia (r = 0.047; P = .808).
There was a significant correlation between RMSE and VCSF volume (Pearson, 2-tailed) in ASOC-1 (r = 0.228, P < .001), confirmed by the GLM (P = .001, Table 2). This correlation factor was decreased in ASOC-2 (r = 0.091, P = .002). In the global RS, this relation is insignificant (r = 0.013, P = .668) over the entire variety of VCSF volumes in all patients but significant in patients presenting a VCSF volume of ≤60,000 mm3 (r = 0.182, P < .001, Fig 4).
Fig 4.

Performance of registration accuracy against ventricular CSF (VCSF) volume at each RS. Single RMSEs of all patients at all landmarks are shown for each RS (dots). The Lowess regression lines of the mean RMSEs (solid curve) and the interval of the standard error of the mean RMSEs (area) reveal the dependency of RSs on VCSF volume.
Discussion
The present study demonstrates improved normalization accuracy of T2-weighted MR imaging data of DBS-treated patients between consecutive regionally focused linear RSs. Automated normalization of individual structural MR imaging data is difficult in an anatomically heterogeneous group of patients with chronic neurodegenerative disorders,37–39 and this problem is also reflected by VCSF volumes varying up to threefold (36,787–110,899 mm3). The accuracy of the global RS remained stable at different VCSF volumes, indicating the robustness of this method. However, the mean error level of the global RS exceeded that of ASOC-1 by >100%. The accuracy of ASOC-1 negatively correlated with VCSF volume because the subcortical mask is composed to normalize a broad subcortical structural variety and included the lateral ventricles (Fig 4). This correlation was reduced in ASOC-2 due to the focal design of the stereotactic mask, which aimed at matching nuclear borders to those of the MNI standard. Thus, ASOC-2 benefited from improvements in ASOC-1, entailing a further reduced RMSE and decreased interference with the VCSF volume. This benefit reinforces the importance of omitting neighboring structures with high variability in the design of brain masks.
Normalization accuracy as assessed by average RMSE of ASOC-2 is similar to an RMSE of 1.22 ± 0.39 mm, reported for automated coregistration for the brain stem.40 However, RMSEs in ASOC-2 varied between the reference points, ranging from landmarks with marginal mediolateral errors (eg, AC, PC, red nucleus) to more variable structures (eg, putamen- and caudate-based landmarks) with increased mediolateral errors. The closest reference to STN within this study was the red nucleus−based landmark, which demonstrated an RMSE of <1 mm. The red nucleus has been described as a consistent and more accurate fiducial marker for targeting the optimal region of the STN than the conventional indirect MCP-based method.35,41 For the GPi, the medial pallidal pole constituted the closest landmark to the actual target point in patients with dystonia. However, the precision and reliability in assessing the medial pallidal pole in the applied T2-weighted imaging sequence depends on the quality of the MR imaging acquisition and may be limited in cases with a low contrast-to-noise ratio of the GPi. Nevertheless, verification of RMSE of the neighboring putamen-based landmarks showed very similar results in a range of 1.3–1.6 mm. These will rather overestimate the registration error at GPi because of the increased lateral extent and, therefore, increase the mediolateral error of the putamen in comparison with the GPi.
One prerequisite for structural MR imaging−based validation of localizations is its concordance with histologic verification, which has been reported to be within a 1-mm range.1 Each electrode contact produced an ellipsoid-shaped magnetic susceptibility distortion artifact, which was shown to be generated symmetrically around the contact,42 and allowed precise localization of lead contacts with respect to the geometric center of the artifact.7,23,42 Furthermore, T2-weighted MR imaging is susceptible to significant geometric distortions43 due to static-field inhomogeneities and gradient field nonlinearity, which exhibit a spheric symmetry within 1 section (barrel aberration), may lead to “nonflat” sections (bow tie effect), and occur along the section-selection direction (“potato chip” effect).43,44 Most important though, these distortions increase in size from the center to the periphery of the image data.43,45 In the central region including the basal ganglia, distortions were quantified in a coronal 2D spin-echo T2-weighted sequence, with a reduced bandwidth for improved visibility of the STN of <0.5 mm, which can be further reduced by using a correction method based on the deformation field from a phantom.43
Linear registration is preferred to nonlinear approaches to preserve individual structural collinearity (ie, maintenance of proportions of structures). This preserves the shape of the artifacts of the electrode, which is integrated with the surrounding structures in a geometrically linear way. In comparison, the risk of local misregistration, particularly at the critical artifacts site, with missing structural information is increased for nonlinear approaches and may lead to distorted image data.
Regional linear registration is a trade-off between regional and local accuracy in patients with a limited match of standard basal ganglia proportions, representing a methodologic caveat of this approach. In contrast, size and position variations will be accommodated by scale, translation, and rotation along all axes. Hence, the RMSE is a composite error, which reflects not only the misalignment of landmarks by registration but also the degree of local proportional structural variability. The absolute mean RMSE diminishes with refined focus of registration on the target region. Accordingly, individual local anatomic variants at certain landmarks rather than registration-related misalignment may be recognized by an increased RMSE.
For instance, in ASOC-2, the posterior caudate caput is more displaced on the left side in patients with PD than on the right side, a finding not present in patients with dystonia. Most interesting, this finding complies with previous MR imaging studies39 finding caudate volume to be predictive for the pre- and postoperative levodopa-equivalent after DBS implantation.46
Furthermore, the observed RMSE increases in patients with PD compared with those with dystonia comply with findings reporting diminished putaminal volumes in patients with PD.38 These increased RMSEs in patients with PD are reduced by ASOC-2 and are partially based on the coinciding increased VCSF volume in patients with PD (compare also “Results”).
Sex-specific RMSE differences (eg, in patients with dystonia at the caudate- and putamen-based landmarks) were progressively reduced in ASOC-1 and ASOC-2 and may correspond to morphologic sexual dimorphism of the basal ganglia.47,48 Generally, the STN and pallidum have been described as located farther laterally in men, correlating with the third ventricle width and, to a lesser extent, with the overall brain width.16
Age-related anatomic changes, such as a craniolateral shift of the center of the STN with respect to the ACPC49 and an increased distance from the midline to the lateral border of the STN were reported previously.14 Several studies have evaluated the physiologic volume decrease in the basal ganglia with respect to age, which is of a linear nature, with average annual shrinkage rates of 0.5%–0.8% at ages ranging from 20 to 77 years.12,13,50 Furthermore, pallidal volume was reported to decrease at a per-decade rate of 7.2% in men and 3.8% in women.51 These anatomic variances may be expressed by the correlation between age and RMSE and were successively reduced in ASOC-1 and ASOC-2, indicating a minor interference of age and registration accuracy in ASOC-2.
Because the similarity function of the registration procedure is based on structural information, accuracy of normalization will improve with optimized MR imaging sequences, with an improved contrast-to-noise ratio specific for the STN52 or GPi. Recently, fast short time inversion-recovery images were shown to provide better differences in signal intensity between the STN and the substantia nigra and offered improved visibility of the inferior margin of the STN when compared with FSE T2-weighted MR imaging sequences, which provide better visibility of all other margins of the STN.14
The present method may be useful to evaluate the clinical benefit (eg, improvement of motor scores), side effects (eg, dysarthria and gait disturbance), and neurophysiologic findings (eg, local field potentials) in DBS with respect to the anatomically normalized localizations of the contacts of leads, which are directly comparable between patients in the standardized population-based MNI stereotactic space. Further clinical studies are needed to show the significance of specific optimized localizations and their consideration in the preoperative adjustment of target points.
Conclusions
Our results confirm a distinct improvement in accuracy and variance of the present optimization scheme for linear registration of structural MR imaging data into MNI stereotactic space within the basal ganglia compared with global affine registration. This automated approach may be useful in the normalization of larger sets of MR imaging data of patients, with increased precision at stereotactic target sites. This allows direct assessment and comparison of stereotactic localizations, such as lead contacts in MNI coordinates, and enables quantitative group analysis in correlation studies with clinical results, even in the presence of substantial ventricular enlargement. Conceivably, normalized MR imaging data may be combined with a variety of (probabilistic) anatomic and functional atlases available in MNI stereotactic space.
Footnotes
This study was supported in part by university grants from the Charité-University Medicin, Berlin, Germany.
References
- 1. Saint-Cyr JA, Hoque T, Pereira LC, et al. Localization of clinically effective stimulating electrodes in the human subthalamic nucleus on magnetic resonance imaging. J Neurosurg 2002;97:1152–66 [DOI] [PubMed] [Google Scholar]
- 2. Plaha P, Ben-Shlomo Y, Patel NK, et al. Stimulation of the caudal zona incerta is superior to stimulation of the subthalamic nucleus in improving contralateral parkinsonism. Brain 2006;129:1732–47 [DOI] [PubMed] [Google Scholar]
- 3. Houeto JL, Yelnik J, Bardinet E, et al. Acute deep-brain stimulation of the internal and external globus pallidus in primary dystonia: functional mapping of the pallidum. Arch Neurol 2007;64:1281–86 [DOI] [PubMed] [Google Scholar]
- 4. Nowinski WL. Towards construction of an ideal stereotactic brain atlas. Acta Neurochir (Wien) 2008;150:1–13 [DOI] [PubMed] [Google Scholar]
- 5. Ahsan RL, Allom R, Gousias IS, et al. Volumes, spatial extents and a probabilistic atlas of the human basal ganglia and thalamus. Neuroimage 2007;38:261–70 [DOI] [PubMed] [Google Scholar]
- 6. Pallavaram S, Yu H, Spooner J, et al. Intersurgeon variability in the selection of anterior and posterior commissures and its potential effects on target localization. Stereotact Funct Neurosurg 2008;86:113–19 [DOI] [PMC free article] [PubMed] [Google Scholar]
- 7. Pollo C, Vingerhoets F, Pralong E, et al. Localization of electrodes in the subthalamic nucleus on magnetic resonance imaging. J Neurosurg 2007;106:36–44 [DOI] [PubMed] [Google Scholar]
- 8. Richter EO, Hoque T, Halliday W, et al. Determining the position and size of the subthalamic nucleus based on magnetic resonance imaging results in patients with advanced Parkinson disease. J Neurosurg 2004;100:541–46 [DOI] [PubMed] [Google Scholar]
- 9. Starr PA, Christine CW, Theodosopoulos PV, et al. Implantation of deep brain stimulators into the subthalamic nucleus: technical approach and magnetic resonance imaging-verified lead locations. J Neurosurg 2002;97:370–87 [DOI] [PubMed] [Google Scholar]
- 10. Zonenshayn M, Sterio D, Kelly PJ, et al. Location of the active contact within the subthalamic nucleus (STN) in the treatment of idiopathic Parkinson's disease. Surg Neurol 2004;62:216–25, discussion 225–26 [DOI] [PubMed] [Google Scholar]
- 11. Lanotte MM, Rizzone M, Bergamasco B, et al. Deep brain stimulation of the subthalamic nucleus: anatomical, neurophysiological, and outcome correlations with the effects of stimulation. J Neurol Neurosurg Psychiatry 2002;72:53–58 [DOI] [PMC free article] [PubMed] [Google Scholar]
- 12. Walhovd KB, Fjell AM, Reinvang I, et al. Effects of age on volumes of cortex, white matter and subcortical structures. Neurobiol Aging 2005;26:1261–70, discussion 1275–78 [DOI] [PubMed] [Google Scholar]
- 13. Raz N, Rodrigue KM, Kennedy KM, et al. Differential aging of the human striatum: longitudinal evidence. AJNR Am J Neuroradiol 2003;24:1849–56 [PMC free article] [PubMed] [Google Scholar]
- 14. Kitajima M, Korogi Y, Kakeda S, et al. Human subthalamic nucleus: evaluation with high-resolution MR imaging at 3.0 T. Neuroradiology 2008;50:675–81 [DOI] [PubMed] [Google Scholar]
- 15. Patel NK, Khan S, Gill SS. Comparison of atlas- and magnetic-resonance-imaging-based stereotactic targeting of the subthalamic nucleus in the surgical treatment of Parkinson's disease. Stereotact Funct Neurosurg 2008;86:153–61 [DOI] [PubMed] [Google Scholar]
- 16. Zhu XL, Hamel W, Schrader B, et al. Magnetic resonance imaging-based morphometry and landmark correlation of basal ganglia nuclei. Acta Neurochir (Wien) 2002;144:959–69 [DOI] [PubMed] [Google Scholar]
- 17. Starr PA, Vitek JL, Delong M, et al. Magnetic resonance imaging-based stereotactic localization of the globus pallidus and subthalamic nucleus. Neurosurgery 1999;44:303–13 [DOI] [PubMed] [Google Scholar]
- 18. Demeter S, Ringo JL, Doty RW. Morphometric analysis of the human corpus callosum and anterior commissure. Hum Neurobiol 1988;6:219–26 [PubMed] [Google Scholar]
- 19. Schaltenbrand G, Wahren W. Atlas for Stereotaxy of the Human Brain. Stuttgart, Germany: Thieme; 1977 [Google Scholar]
- 20. Morel A, Magnin M, Jeanmonod D. Multiarchitectonic and stereotactic atlas of the human thalamus. J Comp Neurol 1997;387:588–630 [DOI] [PubMed] [Google Scholar]
- 21. Godinho F, Thobois S, Magnin M, et al. Subthalamic nucleus stimulation in Parkinson's disease: anatomical and electrophysiological localization of active contacts. J Neurol 2006;253:1347–55 [DOI] [PubMed] [Google Scholar]
- 22. Hamel W, Fietzek U, Morsnowski A, et al. Deep brain stimulation of the subthalamic nucleus in Parkinson's disease: evaluation of active electrode contacts. J Neurol Neurosurg Psychiatry 2003;74:1036–46 [DOI] [PMC free article] [PubMed] [Google Scholar]
- 23. Yelnik J, Damier P, Demeret S, et al. Localization of stimulating electrodes in patients with Parkinson disease by using a three-dimensional atlas-magnetic resonance imaging coregistration method. J Neurosurg 2003;99:89–99 [DOI] [PubMed] [Google Scholar]
- 24. Videen TO, Campbell MC, Tabbal SD, et al. Validation of a fiducial-based atlas localization method for deep brain stimulation contacts in the area of the subthalamic nucleus. J Neurosci Methods 2008;168:275–81 [DOI] [PMC free article] [PubMed] [Google Scholar]
- 25. Mai J, Assheuer J, Paxinos G. Atlas of the Human Brain. San Diego: Elsevier Academic; 2004 [Google Scholar]
- 26. Bardinet E, Bhattacharjee M, Dormont D, et al. A three-dimensional histological atlas of the human basal ganglia. II. Atlas deformation strategy and evaluation in deep brain stimulation for Parkinson disease. J Neurosurg 2009;110:208–19 [DOI] [PubMed] [Google Scholar]
- 27. Yelnik J, Bardinet E, Dormont D, et al. A three-dimensional, histological and deformable atlas of the human basal ganglia. I. Atlas construction based on immunohistochemical and MRI data. Neuroimage 2007;34:618–38 [DOI] [PubMed] [Google Scholar]
- 28. Mallet L, Polosan M, Jaafari N, et al. Subthalamic nucleus stimulation in severe obsessive-compulsive disorder. N Engl J Med 2008;359:2121–34 [DOI] [PubMed] [Google Scholar]
- 29. Jenkinson M, Bannister P, Brady M, et al. Improved optimization for the robust and accurate linear registration and motion correction of brain images. Neuroimage 2002;17:825–41 [DOI] [PubMed] [Google Scholar]
- 30. Tagliati M, Jankovic J, Pagan F, et al. Safety of MRI in patients with implanted deep brain stimulation devices. Neuroimage 2009;47 Suppl 2:T53–57. Epub 2009 Apr 17 [DOI] [PubMed] [Google Scholar]
- 31. Smith SM, Jenkinson M, Woolrich MW, et al. Advances in functional and structural MR image analysis and implementation as FSL. Neuroimage 2004;(23 suppl 1):S208–19 [DOI] [PubMed] [Google Scholar]
- 32. Meyer CR, Boes JL, Kim B, et al. Demonstration of accuracy and clinical versatility of mutual information for automatic multimodality image fusion using affine and thin-plate spline warped geometric deformations. Med Image Anal 1997;1:195–206 [DOI] [PubMed] [Google Scholar]
- 33. Smith SM, Zhang Y, Jenkinson M, et al. Accurate, robust, and automated longitudinal and cross-sectional brain change analysis. Neuroimage 2002;17:479–89 [DOI] [PubMed] [Google Scholar]
- 34. Huang X, Lee YZ, McKeown M, et al. Asymmetrical ventricular enlargement in Parkinson's disease. Mov Disord 2007;22:1657–60 [DOI] [PubMed] [Google Scholar]
- 35. Andrade-Souza YM, Schwalb JM, Hamani C, et al. Comparison of three methods of targeting the subthalamic nucleus for chronic stimulation in Parkinson's disease. Neurosurgery 2005;56:360–68 [DOI] [PubMed] [Google Scholar]
- 36. Grachev ID, Berdichevsky D, Rauch SL, et al. A method for assessing the accuracy of intersubject registration of the human brain using anatomic landmarks. Neuroimage 1999;9:250–68 [DOI] [PubMed] [Google Scholar]
- 37. Black KJ, Ongur D, Perlmutter JS. Putamen volume in idiopathic focal dystonia. Neurology 1998;51:819–24 [DOI] [PubMed] [Google Scholar]
- 38. Geng DY, Li YX, Zee CS. Magnetic resonance imaging-based volumetric analysis of basal ganglia nuclei and substantia nigra in patients with Parkinson's disease. Neurosurgery 2006;58:256–62 [DOI] [PubMed] [Google Scholar]
- 39. Brenneis C, Seppi K, Schocke MF, et al. Voxel-based morphometry detects cortical atrophy in the Parkinson variant of multiple system atrophy. Mov Disord 2003;18:1132–38 [DOI] [PubMed] [Google Scholar]
- 40. Napadow V, Dhond R, Kennedy D, et al. Automated brainstem co-registration (ABC) for MRI. Neuroimage 2006;32:1113–19 [DOI] [PubMed] [Google Scholar]
- 41. Bejjani BP, Dormont D, Pidoux B, et al. Bilateral subthalamic stimulation for Parkinson's disease by using three-dimensional stereotactic magnetic resonance imaging and electrophysiological guidance. J Neurosurg 2000;92:615–25 [DOI] [PubMed] [Google Scholar]
- 42. Pollo C, Meuli R, Maeder P, et al. Subthalamic nucleus deep brain stimulation for Parkinson's disease: magnetic resonance imaging targeting using visible anatomical landmarks. Stereotact Funct Neurosurg 2003;80:76–81 [DOI] [PubMed] [Google Scholar]
- 43. Menuel C, Garnero L, Bardinet E, et al. Characterization and correction of distortions in stereotactic magnetic resonance imaging for bilateral subthalamic stimulation in Parkinson disease. J Neurosurg 2005;103:256–66 [DOI] [PubMed] [Google Scholar]
- 44. Sumanaweera TS, Adler JR, Jr, Napel S, et al. Characterization of spatial distortion in magnetic resonance imaging and its implications for stereotactic surgery. Neurosurgery 1994;35:696–703, discussion 703–04 [DOI] [PubMed] [Google Scholar]
- 45. Yu C, Apuzzo ML, Zee CS, et al. A phantom study of the geometric accuracy of computed tomographic and magnetic resonance imaging stereotactic localization with the Leksell stereotactic system. Neurosurgery 2001;48:1092–98, discussion 1098–99 [DOI] [PubMed] [Google Scholar]
- 46. Bonneville F, Welter ML, Elie C, et al. Parkinson disease, brain volumes, and subthalamic nucleus stimulation. Neurology 2005;64:1598–604 [DOI] [PubMed] [Google Scholar]
- 47. Durston S, Hulshoff Pol HE, Casey BJ, et al. Anatomical MRI of the developing human brain: what have we learned? J Am Acad Child Adolesc Psychiatry 2001;40:1012–20 [DOI] [PubMed] [Google Scholar]
- 48. Giedd JN, Castellanos FX, Rajapakse JC, et al. Sexual dimorphism of the developing human brain. Prog Neuropsychopharmacol Biol Psychiatry 1997;21:1185–201 [DOI] [PubMed] [Google Scholar]
- 49. den Dunnen WF, Staal MJ. Anatomical alterations of the subthalamic nucleus in relation to age: a postmortem study. Mov Disord 2005;20:893–98 [DOI] [PubMed] [Google Scholar]
- 50. McDonald WM, Husain M, Doraiswamy PM, et al. A magnetic resonance image study of age-related changes in human putamen nuclei. Neuroreport 1991;2:57–60 [DOI] [PubMed] [Google Scholar]
- 51. Brabec J, Kraseny J, Petrovicky P. Volumetry of striatum and pallidum in man–anatomy, cytoarchitecture, connections, MRI and aging. Sb Lek 2003;104:13–65 [PubMed] [Google Scholar]
- 52. Elolf E, Bockermann V, Gringel T, et al. Improved visibility of the subthalamic nucleus on high-resolution stereotactic MR imaging by added susceptibility (T2*) contrast using multiple gradient echoes. AJNR Am J Neuroradiol 2007;28:1093–94 [DOI] [PMC free article] [PubMed] [Google Scholar]