

Abstract
BACKGROUND AND PURPOSE: Little is known about the anatomic connectivity of callosal axons in individuals with partial agenesis of the corpus callosum (pAgCC). We used tractography based on both diffusion tensor imaging (DTI) and high angular resolution diffusion imaging (HARDI) to investigate interhemispheric white matter connectivity in pAgCC.
MATERIALS AND METHODS: DTI and HARDI were performed at 3T on 6 individuals with pAgCC and 8 control subjects. For HARDI analysis, a Q-ball reconstruction method capable of visualizing multiple intravoxel fiber orientations was used. In both DTI and HARDI, whole-brain 3D fiber tractography was performed by using deterministic streamline algorithms. Callosal fibers were then segmented to identify separately connections between homologous cortical regions (homotopic fibers) and nonhomologous regions (heterotopic fibers) by using manually drawn regions of interest.
RESULTS: In control individuals, we observed densely connected homotopic fibers. However, in individuals with pAgCC, we identified not only homotopic connections but also heterotopic connections in 4 of 6 subjects. Furthermore, the observed homotopic connections in pAgCC did not necessarily correlate with the position or size of the residual callosum. The nature of homotopic and heterotopic connectivity varied considerably among subjects with pAgCC, and HARDI recovered more callosal fibers than DTI.
CONCLUSION: Individuals with pAgCC demonstrate a remarkable diversity of callosal connectivity, including a number of heterotopic tracts that are absent in healthy subjects. The patterns of their callosal connections cannot be predicted from the appearance of their callosal fragments on conventional MR imaging. More tracts and more extensive fibers within tracts are recovered with HARDI than with DTI.
The corpus callosum, with nearly 200 million axons connecting the 2 cerebral hemispheres, is the largest and most highly organized white matter tract in the human brain. Individuals with congenital agenesis of the corpus callosum (AgCC) have a broad range of clinical deficits; many have symptoms that fall within the autistic spectrum.1 Individuals with partial AgCC (pAgCC), in which only a fragment of the normal callosum develops, show symptoms similar to those with complete agenesis, though detailed comparisons have not been performed.2
Significant advances in characterizing the anatomy of cerebral white matter have been made by using noninvasive tractography based on diffusion tensor imaging (DTI).3–7 DTI has been particularly fruitful for the study of normal human brain maturation8–10 and is now being applied to a better understanding of developmental abnormalities.11,12
DTI tractography studies of healthy volunteers have shown that white matter fibers passing through the corpus callosum homotopically link homologous cortical regions in the left and right cerebral hemispheres. These connections are topographically organized along the anteroposterior axis.13,14 This homotopic connectivity also corresponds closely to functional activity in homologous cortical regions.15,16 Large connections between nonhomologous cortical regions (ie, heterotopic connections) have not been observed using DTI in healthy adult subjects.13
In individuals with complete AgCC, DTI has been used to study intrahemispheric connectivity, yielding a more detailed characterization of the Probst bundle, an aberrant intrahemispheric white matter tract found in many subjects with AgCC.17–20 Presumed to be misdirected callosal axons, the fibers composing the Probst bundle also exhibit topographic organization. One DTI fiber tracking study of callosal connectivity in 5 individuals with pAgCC, performed at 1.5T using 6 diffusion-encoding directions, identified prefrontal homotopic callosal connections and a novel heterotopic interhemispheric connection, with fibers connecting the right frontal lobe with the left occipitoparietal lobes.20 The joint observation of prefrontal connectivity and anteriorly located callosal fragments suggests a correspondence between the anatomic location of callosal fragments and their pattern of homotopic connectivity.
However, DTI is limited by the inability to distinguish multiple distinct fiber orientations within a single voxel, which precludes accurate tractography in regions of complex white matter architecture where fiber tracts cross or where there is intravoxel partial volume averaging of adjacent axonal pathways with different orientations. This limitation has led to the development of high angular resolution diffusion imaging (HARDI) fiber reconstruction techniques, such as Q-ball imaging (QBI),21,22 which rely on increased diffusion weighting (ie, high b-values) to resolve multiple intravoxel fiber populations.23 HARDI also requires the acquisition of many more diffusion-encoding directions than DTI, though recent advances have enabled whole-brain QBI within a clinically feasible scanning time.24 HARDI is particularly useful when examining disorders involving aberrant connectivity, because aberrant fibers have the potential to cross or become partial volume averaged with normal tracts. Although QBI has been validated as a robust and accurate method of fiber reconstruction,25–27 to our knowledge, it has not previously been used to study any white matter disorder. To determine the relationship between the anatomic location of callosal fragments and callosal connectivity in pAgCC, we performed both DTI and QBI tractography at 3T on 6 subjects with pAgCC and 8 control subjects.
Materials and Methods
Participants
Written informed consent was obtained from all participants and/or their legal guardians under a study protocol approved by the institutional review board at our medical center. Six subjects with pAgCC (3 male, 3 female; mean age, 40 ± 19 years; range, 11–70 years) and 8 healthy volunteers (6 men, 2 women; mean age, 29 ± 14 years; range, 18–63 years) were prospectively enrolled in our study (Table). Subjects with fully formed but thin (hypoplastic) callosums were excluded, as were individuals with epilepsy. Neurologic and neuropsychological evaluations of each subject with pAgCC were performed by a neurologist and a developmental psychologist.
Demographic information and summary of imaging findings for 6 subjects with pAgCC
| Subject | Age (yr) | Sex | Structural Malformations* | Fractional Fragment Position | Predicted Homotopic Connections† | Observed Homotopic Connections‡ | Observed Heterotopic Connections‡§ |
|---|---|---|---|---|---|---|---|
| 1 | 11 | F | None | 0.32–0.45 | PF | AF, PF, OT | None |
| 2 | 48 | F | Right lateral periventricular nodular heterotopia | 0.09–0.44 | AF, PF | AF, PF, OT | None |
| 3 | 36 | M | Left frontal periventricular nodular heterotopia | 0.10–0.33 | AF, PF | AF | AF(L)-OT(R) |
| 4 | 37 | F | None | 0.46–0.70 | PF | PF, OT | PF(L)-OT(R) |
| 5 | 70 | M | None | 0.38–0.50 | PF | AF, OT | AF(L)-OT(R) |
| AF(R)-OT(L) | |||||||
| 6 | 37 | M | None | 0.20–0.83 | PF, PA | AF, PF, OT | AF(R)-OT(L) |
| AF(L)-OT(R) | |||||||
| AF(R)-PF(L) | |||||||
| PF(R)-OT(L) |
Note:—AF indicates anterior frontal; PF, posterior frontal; PA, parietal; OT, occipitotemporal; L, left; R, right; pAgCC, partial agenesis of the corpus callosum.
Structural malformations and fragment position (as a fraction of normal callosal length) were determined from high-resolution T1-weighted structural images.
Predicted homotopic connectivity is based on fragment position.
Observed homotopic and heterotopic callosal connections are determined from QBI tractography.
For heterotopic connections, the hemisphere of each connected cortical region is also denoted in parentheses.
Image Acquisition
All MR imaging was performed on a 3T EXCITE MR imaging scanner (GE Healthcare, Waukesha, Wis) by using an 8-channel EXCITE head phased-array radio-frequency head coil. High-resolution structural MR imaging of the brain was performed with an axial 3D inversion-recovery fast spoiled gradient-recalled-echo T1-weighted sequence (TE = 1.5 ms, TR = 6.3 ms, TI = 400 ms, flip angle of 15°) with a 230-mm FOV, and one hundred fifty-six 1.0-mm contiguous partitions at a 256 × 256 matrix. Structural MR images of all subjects were interpreted by 2 neuroradiologists certified by the American Board of Radiology.
Whole-brain DTI and HARDI were both performed with a multisection 2D single-shot spin-echo echo-planar sequence with 55 diffusion-encoding directions, and the array spatial sensitivity encoding technique for parallel imaging with a reduction factor of 2. DTI was performed at a diffusion-weighting strength of b = 1000 s/mm2; TR/TE = 14,000/63 ms; NEX = 1; interleaved 1.8-mm axial sections with no gap; in-plane resolution of 1.8 × 1.8 mm with a 128 × 128 matrix; and an FOV of 230 mm. An additional image set was acquired with minimal diffusion weighting (b = 10 s/mm2). The total acquisition time was 13 minutes. Six of 8 controls and all 6 subjects with pAgCC were scanned with DTI.
For the purpose of performing QBI tractography, whole-brain HARDI was performed at a diffusion-weighting strength of b = 3000 s/mm2; TR/TE = 16,400/82 ms; NEX = 1; interleaved 2.2-mm axial sections with no gap; in-plane resolution of 2.2 × 2.2 mm with a 128 × 128 matrix; and an FOV of 280 mm. An additional image set was acquired with minimal diffusion weighting (b = 30 s/mm2). The total acquisition time was 16 minutes. On 1 individual with pAgCC (subject 4), HARDI was instead performed at the same spatial resolution as DTI (1.8-mm isotropic resolution). Six of 8 controls and all 6 subjects with pAgCC were scanned with HARDI.
DTI and QBI Fiber Tractography
DTI and QBI analysis of diffusion imaging data was performed by using TrackVis software (http://trackvis.org).28 For DTI analysis, the diffusion tensor and associated eigenvectors and eigenvalues were computed by using standard methods3; for Q-ball analysis, orientation distribution functions were calculated by using a spherical harmonic basis.24
For DTI analysis, fiber tracking was performed with the fiber-assignment by continuous tracking (FACT) algorithm5 in TrackVis, by using the brute-force method, in which tracks are seeded from all voxels in the brain with a fractional anisotropy (FA) value of >0.1.4 Fibers were then tracked while turning angles between the primary eigenvectors of neighboring voxels were <50°. Similar tracking parameters have been used in several recent DTI fiber tractography studies of healthy volunteers,29,30 though a lower FA threshold was used in our study to be more inclusive of sparse callosal fibers encountered in pAgCC.
For QBI analysis, a FACT-like tracking algorithm was used in TrackVis,28 with tracts seeded from all voxels in the brain with a measurable signal intensity on the mean of the 55 directional diffusion-weighted images. A DWI threshold was used in lieu of an FA threshold because intravoxel crossing fibers, which can be successfully tracked with QBI, result in low FA values. When voxels with multiple fiber directions were encountered during tract tracing, tracts were continued in the fiber direction closest to the direction of the incoming fiber,28,31 requiring the turning angle between fiber directions of neighboring voxels to be <50°. For comparison, FACT-based DTI tractography was also performed on the HARDI acquisitions (b = 3000 s/mm2) with the same tracking parameters.
Manually drawn regions of interest on DTI color maps were then used to isolate and characterize callosal fibers (Fig 1). A region of interest was first drawn on the midline sagittal section, encompassing the entire corpus callosum in the healthy controls and the entire callosal fragment in the experimental subjects, to include all callosal fibers (Fig 1A, -G). These fibers were further segmented according to projections to specific lobar areas.
Fig 1.

Callosal tract segmentation procedure, shown for a control subject (A−F) and for pAgCC subject 5 (G−L). A region of interest is first placed over the entire callosum, and tracts are colored according to their direction with the standard red-blue-green convention used for DTI color maps (A and G). Individual tracts are then segmented by using 2 additional regions of interest defining lobar regions in each hemisphere. For the control subject, homotopic anterior (B) and posterior (C) frontal, parietal (D), and occipitotemporal (E) tracts are segmented. For the subject with pAgCC, homotopic anterior frontal (H) and occipitotemporal (I) tracts and bilateral heterotopic frontal occipitotemporal (J and K) tracts are isolated. In K, an exclusion region of interest (pink) is used to eliminate homotopic occipitotemporal connections. All segmented tracts are then displayed together (F and L). All 3D tracts are shown projected onto axial sections.
For the anterior frontal lobe projections, regions of interest were placed on a coronal section anterior to the callosum on which callosal and intrahemispheric fibers join (Fig 1B, -H). For the posterior frontal lobe and parietal lobe projections, an axial section was chosen at the most posterior edge of the parieto-occipital sulcus. Regions of interest for posterior frontal projections were then placed to encompass the region between the coronal section used for anterior frontal fibers and the central sulcus (Fig 1C). Regions of interest for parietal lobe connections were placed on the same axial section, in the region posterior to the central sulcus (Fig 1D). Finally, projections to the occipital and temporal lobes were segmented by using regions of interest placed on coronal images posterior to the callosum, encompassing regions inferior to the parieto-occipital sulcus (Fig 1E, -I). Because fibers projecting to both occipital and temporal lobes cross the midline at the splenium and initially project posteriorly, it is difficult to segment separately occipital and temporal connections, particularly in pAgCC. Thus, they are segmented as a single fiber population of occipitotemporal fibers. Our method of callosal fiber segmentation is modified from that of Wakana et al,29 to define regions of interest more proximal to the callosum, to better characterize the sparse callosal fibers in pAgCC.
For each subject, all callosal connections were segmented, by using the aforementioned regions of interest, into homotopic and heterotopic connections between specific cortical regions. Every combination of 2 contralateral cortical regions was used to look for the presence of heterotopic connections. In naming the heterotopic tracts, we specified the more anterior terminus first, followed by the more posterior terminus. This terminology was not meant to imply polarity, because diffusion-based tractography cannot distinguish antegrade from retrograde.
Heterotopic Tract Verification
Because spurious observations of heterotopic connections could arise from overlapping populations of homotopic fibers (“kissing” fibers), heterotopic fibers were required to be well separated from any homotopic fibers at the midline sagittal section such that no voxels were shared by the distinct fiber populations. Those that did overlap were manually removed. An identical tracking procedure was also performed on all control subjects to assess whether any spurious heterotopic fibers were reconstructed in healthy volunteers.
Measurement of Callosal Size and Position
The size and anatomic location of each corpus callosum or callosal fragment were determined from the high-resolution T1-weighted structural images. Because accurate 3D spatial normalization of these images of subjects with pAgCC to a standard stereotactic atlas was precluded by their abnormal and variable brain morphology, the following approach was taken for characterizing the relative positions and lengths of their callosal fragments: For each subject, the distances between coronal sections containing the anterior commissure and either the most anterior or posterior portions of the corpus callosum were measured; these lengths are denoted as Ai and Pi, respectively. Axial planes were aligned parallel to the anterior/posterior commissure line to ensure consistent plane orientation across subjects. These data from the 8 control subjects were then averaged to obtain a mean anterior (Ā) and posterior (P̄) location of a normal corpus callosum and were summed to obtain a mean callosal length (L̄). The positions and lengths of callosal fragments of subjects with pAgCC were then calculated relative to those of the healthy controls, with the location of anterior (Afrac) and posterior (Pfrac) ends of the fragment and the length of the fragment (Lfrac) expressed as a fractional value between zero and 1 according to the following equations:
 |
 |
 |
These 3 values provide a normalized measure of callosal size and location, which can be compared across subjects.
Using DTI tractography, the callosa of healthy controls were further parcellated into regions containing homotopic connections to anterior frontal, posterior frontal, parietal, and occipitotemporal areas. The positions of the boundaries between these connectivity-based regions were then found and expressed as a fraction of the total callosal length determined from T1-weighted structural images. This parcellation was used to compare the observed connectivity of subjects with pAgCC with what would be expected on the basis of the anatomic location of their fragments.
Display
Reconstructed 3D tracts overlaid on axial sections were displayed with the right hemisphere on the right side of the image and the left hemisphere on the left side. However, all 2D axial images were instead shown in radiologic convention. Each segmented callosal fiber was colored according to the regions to which it projected, as described in the Fig 2 legend.
Fig 2.

T1-weighted anatomic images and DTI tractography of 6 subjects with pAgCC (top panels) and 2 representative controls (bottom panel). Axial (left) and midline sagittal (middle) T1 sections are shown for each subject. Callosal fragments are identified with yellow arrows, whereas heterotopic fibers visible on T1-weighted images are denoted by red arrows. Midline sagittal DTI color maps are shown with segmented callosal fibers (right). For subjects with pAgCC, connectivity ranged from anterior frontal connections (subject 3) to only posterior frontal and occipitotemporal connections (subject 4). One individual (subject 5) displayed a discontinuous set of homotopic callosal connections, with anterior frontal and occipitotemporal connectivity without any posterior frontal or parietal connections. Control subjects (not shown) displayed similar callosal morphology and tractography results. Tracts are segmented and colored according to their cortical projections: homotopic anterior frontal, blue; homotopic posterior frontal, orange; homotopic parietal, pink; homotopic occipitotemporal, green; heterotopic left anterior-right posterior, yellow; heterotopic right anterior-left posterior, red.
Results
Structural Imaging
High-resolution 3D structural T1-weighted imaging revealed periventricular nodular heterotopia in 2 subjects with pAgCC (subjects 2 and 3 in the Table); no additional parenchymal abnormalities were noted in these or any other subjects. The corpus callosum for 2 control subjects and callosal fragments for all 6 subjects with pAgCC are shown in Fig 2. The location and length of each callosal fragment were determined from these high-resolution 3D T1-weighted images and are presented in the Table. The locations of the anterior and posterior ends of callosal fragments and the average fragment length varied widely. The mean callosal fragment length was 21 ± 14 mm, compared with a mean callosal length of 74 ± 5 mm for controls.
DTI Tractography
DTI revealed considerable variation in the callosal connectivity of individuals with pAgCC (Fig 2). Although control subjects displayed homotopic connections between all cortical regions, individuals with pAgCC displayed highly variable homotopic connectivity. In addition, the anatomic locations of callosal fragments were not predictors of the cortical target of their projections. Analysis of DTI tractography results indicated that for healthy controls, the boundary between anterior frontal and posterior frontal connections lies at 18 ± 3% of a normal callosal length from the anterior end, the boundary between posterior frontal and parietal fibers lies at 76 ± 1% from the anterior end, and the boundary between parietal and occipitotemporal fibers lies at 87 ± 2% from the anterior end. The small SD of these measurements indicates that they are highly reproducible across healthy subjects. On the basis of these estimates, none of our 6 experimental subjects displayed the homotopic cortical connectivity that would be predicted by the anatomic location of their callosal fragments (Table). Furthermore, subjects with fragments that have a similar anatomic location can display markedly different connectivity (eg, subjects 4 and 5).
QBI Tractography
QBI revealed a similar pattern of homotopic connectivity to DTI, as well as a number of heterotopic connections not seen in healthy individuals (Fig 3). Recovered heterotopic tracts are listed in the Table and are shown in Fig 4. Tracts reconstructed with QBI in both controls and subjects with pAgCC generally extended closer to the gray matter than those seen with DTI (Fig 5); and in pAgCC subjects, 1 additional homotopic tract and 3 additional heterotopic tracts seen with QBI were not recovered with DTI. No heterotopic fibers were seen in any control subjects with either DTI or QBI.
Fig 3.
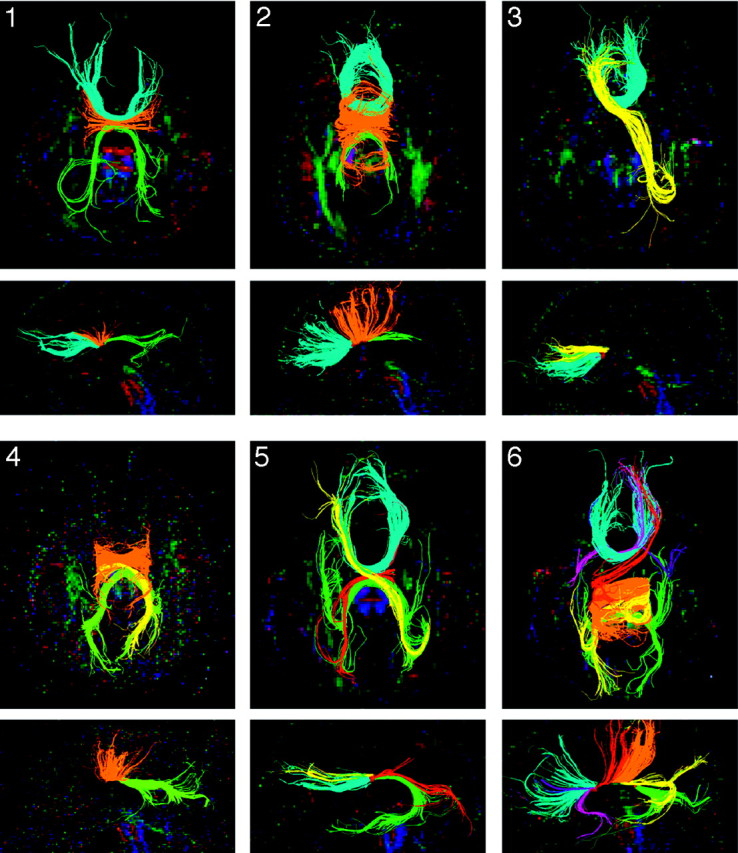
Q-ball tractography of subjects with pAgCC. All homotopic and heterotopic segmented tracts are shown on both axial (top) and midline sagittal (bottom) projections, with the subject number indicated in the upper left corner of the axial images. Fibers are colored as in Fig 2, with pink and purple fibers for subject 6 representing anterior frontal-temporal heterotopic connections.
Fig 4.

Q-ball tractography of heterotopic callosal connections. Isolated heterotopic connections are displayed for subjects 3–6. Fibers are shown projected on an axial section (left). A magnified view of the callosal fragment is also shown in the midsagittal plane (right) to demonstrate that all heterotopic connections are well isolated from other homotopic fibers.
Fig 5.

Comparison of DTI and QBI tractography. For a control subject (top) and a subject with pAgCC (subject 5, bottom), segmented tracts are shown by using DTI tractography performed on a DTI acquisition at b = 1000 s/mm2 (A and D) and on a HARDI acquisition at b = 3000 s/mm2 (B and E). QBI tractography is shown for the same HARDI acquisition at b = 3000 s/mm2 (C and F). QBI tractography yields more extensive fibers, including more lateral frontal fibers and denser temporal fibers in the control subject and an additional heterotopic fiber in the subject with pAgCC (red in F) not recovered by DTI tractography.
Discussion
This diffusion tractography study of 6 subjects with partial callosal agenesis reveals a remarkable and unanticipated diversity of callosal fiber connectivity. Although imaging of 1 subject displayed an exclusively anterior frontal connectivity, as observed previously,20 the rest showed markedly different connectivity, including connections to posterior frontal, occipital, and temporal lobes. Crucially, the anatomic location and size of the callosal fragments were not good indicators of the cortical connectivity of the fibers passing through them. Hence, structural MR imaging is not adequate to characterize these callosal fragments.
Heterotopic callosal connections were found in 4 of 6 individuals with pAgCC. Although some displayed anterior frontal to contralateral occipitotemporal connectivity, similar to the “asymmetric sigmoid bundle” reported previously,20 others had entirely novel connectivities. Subjects 5 and 6 demonstrated 2 or more distinct heterotopic fibers passing through their callosal fragment, which, to our knowledge, has not been previously reported.
Subjects were analyzed with both DTI and Q-ball fiber tracking algorithms by using similar tracking parameters. Most tracts described here were apparent with both methods, though some tracts were recovered with QBI but not with DTI. Because QBI algorithms have the ability to resolve multiple fiber populations within a single voxel, they are better able to track fibers that have a common origin but diverge as they cross the midline to project to distinct locations, as heterotopic callosal connections are shown to do. QBI tractography recovered more tracts than DTI tractography, despite the better spatial resolution of the DTI datasets (1.8-mm isotropic voxels) compared with the HARDI datasets (2.2-mm isotropic voxels), indicating that the superior angular resolution of QBI was a more important factor. Additionally, of tracts that were recovered by both methods when performed on the same HARDI dataset, QBI typically recovered more extensive fibers for each tract than DTI in both subjects with pAgCC and controls. Although this study cannot provide independent validation of our tracking results, our findings are consistent with prior studies showing that QBI tractography provides more detailed information about white matter structure than DTI.22,25–27 To our knowledge, this is the first study applying a HARDI reconstruction method such as QBI to the investigation of a specific white matter disorder. Our results suggest the utility of HARDI reconstruction techniques such as QBI as an alternative or complement to DTI.
A simplified model of partial callosal dysgenesis has been suggested, in which normal callosal growth along an anterior-to-posterior axis is disrupted, yielding anteriorly located fragments with prefrontal homotopic connectivity.20 Because some pAgCC subjects in this study showed fragments located posteriorly to the expected location of the genu and demonstrated a lack of prefrontal homotopic connectivity, our results clearly indicate that such a model cannot fully account for the connectivity seen in pAgCC. However, some recent studies propose a more complex callosal development pattern, in which growth is initiated simultaneously at 2 distinct loci: a rostral locus at the lamina rostralis and a more caudal locus above the hippocampal commissure.32–34 Disruption of growth in this more complex model could account for the anatomic diversity of callosal fragments seen in our cohort. However, the observation of varying connectivity even between subjects with morphologically similar callosal fragments, including diverse patterns of heterotopic connectivity, suggests that a more plastic and complex mechanism is at work. Partial callosal agenesis should not be viewed as simply the incomplete development of a normal callosum, regardless of the model of callosal development.
Some limitations to the current study should be mentioned. First, the strong diffusion-weighting needed to perform adequate Q-ball imaging limited the spatial resolution of the HARDI acquisitions. More subtle patterns of callosal connectivity could be missed at this level of spatial resolution. Conducting QBI tractography at 7T to further boost the signal-to-noise ratio35 to improve spatial resolution might increase the sensitivity of this investigation. Second, the small cohort of subjects with partial agenesis precluded any generalization about patterns of callosal connectivity or any analysis of the relationship between aberrant connectivity and the neurocognitive profile of these individuals. Because individuals with pAgCC comprise a phenotypically heterogeneous population, including many with parenchymal malformations, it is likely that our results are only a partial representation of the callosal morphology and connectivity found in pAgCC. These remain areas for future research.
Conclusions
Individuals with partial callosal agenesis demonstrate highly variable callosal connectivity, including many heterotopic tracts not seen in healthy subjects. The pattern of connectivity is sufficiently complex that it cannot be predicted from conventional structural MR imaging and cannot be explained fully by a simple model of arrested callosal development. The presence of aberrant callosal connections could have important consequences for the behavioral and neurocognitive functions of individuals with pAgCC.
Acknowledgments
We gratefully acknowledge the insightful comments of Linda Richards during the preparation of the manuscript.
Footnotes
This study was supported by grants to E.H. Sherr from the National Institutes of Health (NIH); the University of California, San Francisco Strategic Opportunities Support Center of the Clinical and Translational Sciences Institute; and a grant from the American Society of Pediatric Neuroradiology. This study was also made possible by Grant UL RR024131–01 from the National Center for Research Resources (NCRR), a component of the NIH and NIH Roadmap for Medical Research. Its contents are solely the responsibility of the authors and do not necessarily represent the official view of the NCRR or the NIH.
References
- 1.Badaruddin DH, Andrews GL, Bolte S, et al. Social and behavioral problems of children with agenesis of the corpus callosum. Child Psychiatry Hum Dev 2007;38:287–302. Epub 2007 Jun 13 [DOI] [PubMed] [Google Scholar]
- 2.Paul LK, Brown WS, Adolphs R, et al. Agenesis of the corpus callosum: genetic, developmental and functional aspects of connectivity. Nat Rev Neurosci 2007;8:287–99 [DOI] [PubMed] [Google Scholar]
- 3.Pierpaoli C, Jezzard P, Basser PJ, et al. Diffusion tensor MR imaging of the human brain. Radiology 1996;201:637–48 [DOI] [PubMed] [Google Scholar]
- 4.Conturo TE, Lori NF, Cull TS, et al. Tracking neuronal fiber pathways in the living human brain. Proc Natl Acad Sci U S A 1999;96:10422–27 [DOI] [PMC free article] [PubMed] [Google Scholar]
- 5.Mori S, Kaufmann WE, Pearlson GD, et al. Three-dimensional tracking of axonal projections in the brain by magnetic resonance imaging. Ann Neurol 1999;45:265–69 [DOI] [PubMed] [Google Scholar]
- 6.Wakana S, Jiang H, Nagae-Poetscher LM, et al. Fiber tract-based atlas of human white matter anatomy. Radiology 2004;230:77–87 [DOI] [PubMed] [Google Scholar]
- 7.Mori S, Zhang J. Principles of diffusion tensor imaging and its applications to basic neuroscience research. Neuron 2006;51:527–39 [DOI] [PubMed] [Google Scholar]
- 8.Mukherjee P, Miller JH, Shimony JS, et al. Normal brain maturation during childhood: developmental trends characterized with diffusion-tensor MR imaging. Radiology 2001;221:349–58 [DOI] [PubMed] [Google Scholar]
- 9.Mukherjee P, Miller JH, Shimony JS, et al. Diffusion-tensor MR imaging of gray and white matter development during normal human brain maturation. AJNR Am J Neuroradiol 2002;23:1445–56 [PMC free article] [PubMed] [Google Scholar]
- 10.Mukherjee P, McKinstry RC. Diffusion tensor imaging and tractography of human brain development. Neuroimaging Clin N Am 2006;16:19–43 [DOI] [PubMed] [Google Scholar]
- 11.Marenco S, Siuta MA, Kippenhan JS, et al. Genetic contributions to white matter architecture revealed by diffusion tensor imaging in Williams syndrome. Proc Natl Acad Sci U S A 2007;104:15117–22 [DOI] [PMC free article] [PubMed] [Google Scholar]
- 12.Sato N, Ota M, Yagishita A, et al. Aberrant midsagittal fiber tracts in patients with hemimegalencephaly. AJNR Am J Neuroradiol 2008;29:823–27. Epub 2008 Jan 31 [DOI] [PMC free article] [PubMed] [Google Scholar]
- 13.Hofer S, Frahm J. Topography of the human corpus callosum revisited: comprehensive fiber tractography using diffusion tensor magnetic resonance imaging. Neuroimage 2006;32:989–94 [DOI] [PubMed] [Google Scholar]
- 14.Hofer S, Merboldt KD, Tammer R, et al. Rhesus monkey and humans share a similar topography of the corpus callosum as revealed by diffusion tensor MRI in vivo. Cereb Cortex 2008;19:1079–84 [DOI] [PubMed] [Google Scholar]
- 15.Wahl M, Lauterbach-Soon B, Hattingen E, et al. Human motor corpus callosum: topography, somatotopy, and link between microstructure and function. J Neurosci 2007;27:12132–38 [DOI] [PMC free article] [PubMed] [Google Scholar]
- 16.Putnam MC, Wig GS, Grafton ST, et al. Structural organization of the corpus callosum predicts the extent and impact of cortical activity in the nondominant hemisphere. J Neurosci 2008;28:2912–18 [DOI] [PMC free article] [PubMed] [Google Scholar]
- 17.Utsunomiya H, Yamashita S, Takano K, et al. Arrangement of fiber tracts forming Probst bundle in complete callosal agenesis: report of two cases with an evaluation by diffusion tensor tractography. Acta Radiol 2006;47:1063–66 [DOI] [PubMed] [Google Scholar]
- 18.Lee SK, Mori S, Kim DJ, et al. Diffusion tensor MR imaging visualizes the altered hemispheric fiber connection in callosal dysgenesis. AJNR Am J Neuroradiol 2004;25:25–28 [PMC free article] [PubMed] [Google Scholar]
- 19.Lee SK, Kim DI, Kim J, et al. Diffusion-tensor MR imaging and fiber tractography: a new method of describing aberrant fiber connections in developmental CNS anomalies. Radiographics 2005;25:53–65 [DOI] [PubMed] [Google Scholar]
- 20.Tovar-Moll F, Moll J, de Oliveira-Souza R, et al. Neuroplasticity in human callosal dysgenesis: a diffusion tensor imaging study. Cereb Cortex 2007;17:531–41 [DOI] [PubMed] [Google Scholar]
- 21.Tuch DS, Reese TG, Wiegell MR, et al. Diffusion MRI of complex neural architecture. Neuron 2003;40:885–95 [DOI] [PubMed] [Google Scholar]
- 22.Tuch DS. Q-ball imaging. Magn Reson Med 2004;52:1358–72 [DOI] [PubMed] [Google Scholar]
- 23.Hess CP, Mukherjee P. Visualizing white matter pathways in the living human brain: diffusion tensor imaging and beyond. Neuroimaging Clin N Am 2007;17:407–26 [DOI] [PubMed] [Google Scholar]
- 24.Hess CP, Mukherjee P, Han ET, et al. Q-ball reconstruction of multimodal fiber orientations using the spherical harmonic basis. Magn Reson Med 2006;56:104–17 [DOI] [PubMed] [Google Scholar]
- 25.Perrin M, Poupon C, Rieul B, et al. Validation of q-ball imaging with a diffusion fibre-crossing phantom on a clinical scanner. Philos Trans R Soc Lond B Biol Sci 2005;360:881–91 [DOI] [PMC free article] [PubMed] [Google Scholar]
- 26.Tuch DS, Wisco JJ, Khachaturian MH, et al. Q-ball imaging of macaque white matter architecture. Philos Trans R Soc Lond B Biol Sci 2005;360:869–79 [DOI] [PMC free article] [PubMed] [Google Scholar]
- 27.Cho KH, Yeh CH, Tournier JD, et al. Evaluation of the accuracy and angular resolution of q-ball imaging, Neuroimage 2008;42:262–71. Epub 2008 Apr 9 [DOI] [PubMed] [Google Scholar]
- 28.Wedeen VJ, Wang RP, Schmahmann JD, et al. Diffusion spectrum magnetic resonance imaging (DSI) tractography of crossing fibers, Neuroimage 2008;41:1267–77. Epub 2008 Apr 8 [DOI] [PubMed] [Google Scholar]
- 29.Wakana S, Caprihan A, Panzenboeck MM, et al. Reproducibility of quantitative tractography methods applied to cerebral white matter. Neuroimage 2007;36:630–44 [DOI] [PMC free article] [PubMed] [Google Scholar]
- 30.Rodrigo S, Naggara O, Oppenheim C, et al. Subinsular asymmetry studied by diffusion tensor imaging and fiber tracking. AJNR Am J Neuroradiol 2007;28:1526–31 [DOI] [PMC free article] [PubMed] [Google Scholar]
- 31.Berman JI, Chung S, Mukherjee P, et al. Probabilistic streamline q-ball tractography using the residual bootstrap. Neuroimage 2008;39:215–22. Epub 2007 Aug 25 [DOI] [PubMed] [Google Scholar]
- 32.Kier EL, Truwit CL. The lamina rostralis: modifications of concepts concerning the anatomy, embryology, and MR appearance of the rostrum of the corpus callosum. AJNR Am J Neuroradiol 1997;18:715–22 [PMC free article] [PubMed] [Google Scholar]
- 33.Richards LJ, Plachez C, Ren T. Mechanisms regulating the development of the corpus callosum and its agenesis in mouse and human. Clin Genet 2004;66:276–89 [DOI] [PubMed] [Google Scholar]
- 34.Ren T, Anderson A, Shen WB, et al. Imaging, anatomical and molecular analysis of callosal formation in the developing human fetal brain. Anat Rec A Discov Mol Cell Eval Biol 2006;288:191–204 [DOI] [PubMed] [Google Scholar]
- 35.Mukherjee P, Hess CP, Xu D, et al. Development and initial evaluation of 7-T q-ball imaging of the human brain. Magn Reson Imaging 2008;26:171–80 [DOI] [PMC free article] [PubMed] [Google Scholar]