

Abstract
BACKGROUND AND PURPOSE: A previous study demonstrated the need to use delayed acquisition rather than first-pass data for accurate blood-brain barrier permeability surface product (BBBP) calculation from perfusion CT (PCT) according to the Patlak model, but the optimal duration of the delayed acquisition has not been established. Our goal was to determine the optimal duration of the delayed PCT acquisition to obtain accurate BBBP measurements while minimizing potential motion artifacts and radiation dose.
MATERIALS AND METHODS: We retrospectively identified 23 consecutive patients with acute ischemic anterior circulation stroke who underwent a PCT study with delayed acquisition. The Patlak model was applied for the full delayed acquisition (90–240 seconds) and also for truncated analysis windows (90–210, 90–180, 90–150, 90–120 seconds). Linear regression of Patlak plots was performed separately for the full and truncated analysis windows, and the slope of these regression lines was used to indicate BBBP. The full and truncated analysis windows were compared in terms of the resulting BBBP values and the quality of the Patlak fitting.
RESULTS: BBBP values in the infarct and penumbra were similar for the full 90- to 240-second acquisition (95% confidence intervals for the infarct and penumbra: 1.62–2.47 and 1.75–2.41 mL ×100 g−1 × min−1, respectively) and the 90- to 210-second analysis window (1.82–2.76 and 2.01–2.74 mL × 100 g−1 × min−1, respectively). BBBP values increased significantly with shorter acquisitions. The quality of the Patlak fit was excellent for the full 90- to 240-second and 90- to 210-second acquisitions, but it degraded with shorter acquisitions.
CONCLUSIONS: The duration for the delayed PCT acquisition should be at least 210 seconds, because acquisitions shorter than 210 seconds lead to significantly overestimated BBBP values.
Parenchymal hematoma with significant mass effect, the most severe form of hemorrhagic transformation (HT) in acute ischemic stroke, occurs in ≤5.9% of patients treated with tissue plasminogen activator1 and has devastating clinical consequences.2 Because blood-brain barrier (BBB) damage plays a fundamental role in HT,3 early identification of significant BBB damage on admission might predict which patients will develop HT and could constitute a contraindication to thrombolytic therapy.4 In the pursuit of this goal, direct measurements of the BBB permeability surface product (BBBP) have been attempted in the context of acute stroke.5–8
Prior perfusion CT (PCT) studies have applied Patlak modeling to first-pass data to calculate BBBP.7–10 However, a recent study demonstrated that using first-pass data resulted in incorrect BBBP measurements by modeling delayed perfusion rather than permeability.11 This study demonstrated the necessity of using delayed-acquisition data but did not investigate specifically how long the delayed acquisition needed to be. Rather, the authors arbitrarily used an acquisition of ≤4 minutes.
On one hand, the duration of the delayed acquisition should be long enough to meet the assumptions of the Patlak model and to allow an accurate measurement of BBBP; such measurements require distinguishing intravascular and extravascular (extravasated) contrast, which is facilitated by a delayed acquisition not dominated by first-pass intravascular contrast.12 On the other hand, minimizing the duration of the delayed acquisition reduces the likelihood of motion artifacts that may degrade image quality and interfere with BBBP calculation,13 mainly when these motion artifacts are severe and cannot be corrected by image registration.
The goal of our current study was to determine how short the delayed acquisition can be while still meeting the Patlak assumption of linearity.
Materials and Methods
Study Design
Imaging data obtained as part of standard clinical stroke care at our institution were retrospectively reviewed with the approval of the institutional review board. At our institution, patients with suspicion of acute stroke and no history of significant renal insufficiency or contrast allergy routinely undergo a stroke CT survey, including noncontrast CT (NCCT) of the brain, PCT at 2 cross-sectional positions, CT angiography (CTA) of the cervical and intracranial vessels, and postcontrast cerebral CT, obtained in this chronologic sequence.
We retrospectively identified a consecutive series of 23 patients admitted to the University of California San Francisco Medical Center from July 2007 to August 2008 who met the following inclusion criteria: 1) admission to the emergency department with signs and symptoms suggesting anterior circulation stroke within 12 hours after symptom onset; 2) documentation of acute ischemic anterior circulation stroke by both admission stroke protocol and clinical examination; 3) no evidence of intracerebral hemorrhage on the admission NCCT; and 4) no significant motion artifacts following application of the registration algorithm. Patients’ charts were reviewed for demographic and clinical data.
Imaging Protocol
PCT studies were obtained on 16-section (4 patients) and 64-section (19 patients) CT scanners. Each PCT study involved successive gantry rotations performed in cine mode during intravenous administration of iodinated contrast material. Images were acquired and reconstructed at a temporal sampling rate of 1 image per second for the first 37 seconds and 1 image every 2 seconds for the next 33 seconds. Additional gantry rotations were obtained at 90, 120, 150, 180, 210, and 240 seconds. Acquisition parameters were 80 kilovolt (peak) and 100 mAs. Two successive PCT series at 2 different levels were performed following the NCCT and before the CTA. At each PCT level, two 10-mm-thick sections (16-section CT scanners) or eight 5-mm-thick sections (64-section CT scanners) were assessed. The first PCT series was performed at the level of the third ventricle and the basal ganglia, and the second PCT series, above the lateral ventricles. For each PCT series, a 40-mL bolus of iohexol (300 mg/mL of iodine, Omnipaque; GE Healthcare, Piscataway, NJ) was administered into an antecubital vein by using a power injector at an injection rate of 5 mL per second for all patients. CT scanning was initiated 7 seconds after start of the injection of the contrast bolus. Data from both boluses were used because prior work has demonstrated that there is no significant parenchymal saturation effect from the first bolus and no underestimation of BBBP values from data from the second bolus.14
Image Postprocessing
PCT data were analyzed using commercially available PCT software (Brain Perfusion; Philips Healthcare, Cleveland, Ohio). This software relies on the central volume principle, which is the most accurate for low injection rates of iodinated contrast material.15 The software obtains mathematic descriptions of the time-attenuation curves for each voxel, by applying curve fitting by least mean squares, after correcting for motion and noise reduction through an anisotropic edge-preserving spatial filter. A closed-form (noniterative) deconvolution is then applied to calculate the mean transit time (MTT) map.16 The deconvolution operation requires a reference arterial input function (most often within the anterior cerebral artery), automatically selected by the PCT software within a region of interest drawn by the user. The cerebral blood volume (CBV) map is calculated from the area under the time-attenuation curves, with a correction factor for the leakage of contrast into the interstitial space calculated from the Patlak model applied to the delayed acquisition. The PCT infarct core and salvageable brain tissue are automatically calculated by the software by using CBV thresholds and MTT thresholds reported in the literature as the most accurate (PCT salvageable brain tissue: MTT > 145% of the contralateral side values plus CBV ≥ 2.0 mL × 100 g−1; PCT infarct core: MTT > 145% of the contralateral side values plus CBV < 2.0 mL × 100 g−1).17
BBBP measurements were extracted from PCT data by using a second prototype software developed by Philips Healthcare. This software is based on the Patlak model.18,19 Applying the Patlak model to PCT involves performing linear regression by using data calculated from the PCT datasets. The slope of these regression lines was interpreted as a blood-to-brain transfer constant and used as an indicator of absolute BBBP values. Relative BBBP values, defined as absolute BBBP values divided by cerebral blood flow values in the corresponding voxels, were also recorded.
Using the prototype software, we calculated BBBP values from the gold standard delayed acquisition dataset, which incorporated all time points from 90 to 240 seconds. Additionally, we calculated BBBP values by using truncated datasets based on analysis windows from 90 to 210 seconds (excluding the data from the last gantry rotation), 90 to 180 seconds (excluding the data from the last 2 gantry rotations), 90 to 150 seconds (excluding the data from the last 3 gantry rotations), and 90 to 120 seconds (excluding the data from the last 4 gantry rotations). BBBP values were recorded in the infarct and penumbra, as automatically delineated by the software, and in mirrored regions of interest in the contralateral nonischemic tissue (also automatically delineated by the software).
Statistical Analysis
We calculated the correlation between permeability values from each of the truncated analysis windows and permeability values from the gold standard 90- to 240-second delayed acquisition.
We measured the quality of the linear fit to quantify how well the assumptions of the Patlak model were met by data extracted from the datasets of 90–240, 90–210, 90–180, 90–150, and 90–120 seconds. To do this, we used the root-mean-square error (√MSE), which is a measure of variability of data points around a fitted straight line: A value close to zero indicates a smaller spread of data points around the line, corresponding to a better fit.
Absolute and relative BBBP values and corresponding √MSE values extracted from different durations of delayed PCT analysis windows in ischemic and nonischemic regions of interest were compared by using generalized estimating equation models with robust variance estimation, with fixed effects for patients, type of CT scanner, and type of regions of interest. Because the distribution of the parameters was not normal but skewed, we report estimated mean values (obtained by log transformation of the data) rather than simple means. For all values, 95% confidence intervals (CI) were also calculated.
Radiation Dose and Motion Artifacts
We calculated the effective radiation dose associated with the gold standard 90- to 240-second acquisition and the percentage decrease in radiation associated with truncated analysis windows (datasets of 90–210, 90–180, 90–150, and 90–120 seconds).
The number of cases with motion artifacts interfering with the processing was recorded for the gold standard 90- to 240-second acquisition and for the truncated analysis windows (datasets of 90–210, 90–180, 90–150, and 90–120 seconds).
Results
Patients and Imaging Studies
Twenty-three patients who matched our inclusion criteria were retrospectively identified. Patient characteristics are summarized in Table 1. The median time from symptom onset to PCT was 2.25 hours (range, 1–11.75 hours). The Patlak analyses were performed in a total number of 230 ischemic regions of interest and 230 nonischemic regions of interest.
Table 1:
Study patient characteristics
| Characteristics | Patients with Stroke |
|---|---|
| No. of patients | 23 |
| No. of men (%) | 8 (35%) |
| Median age (years) | 74 |
| Interquartile range | 59.5–82.5 |
| Range | 26–92 |
| Median time from stroke to PCT (hours) | 2.25 |
| Interquartile range | 1.5–5 |
| Range | 1–11.75 |
| Stroke location | |
| ACA, MCA territories | 3 |
| MCA territory | 20 |
| ACA territory | 0 |
| PCA territory | 0 |
Note:—ACA indicates anterior cerebral artery; MCA, middle cerebral artery; PCA, posterior cerebral artery; PCT, perfusion CT.
BBBP Measurements for Different Durations of the Delayed PCT Acquisition
BBBP values for truncated analysis windows of 90–210 seconds and 90–180 seconds were highly correlated with the gold standard 90- to 240-second delayed acquisition (Table 2). Shorter analysis windows (90–150 seconds and 90–120 seconds) were less correlated, especially in the infarct core (Table 2).
Table 2:
Correlation of BBBP values from the truncated analysis windows with BBBP values from the gold standard 90- to 240-second delayed acquisition*
| 90–120 Seconds | 90–150 Seconds | 90–180 Seconds | 90–210 Seconds | |
|---|---|---|---|---|
| Overall | 0.89 (0.81–0.97) P = .012 | 0.93 (0.89–0.98) P = .022 | 0.98 (0.96–0.99) P = .42 | 0.99 (0.99–1.00) P = 1.000 |
| Infarct | 0.85 (0.71–0.99) P = .035 | 0.94 (0.89–0.98) P = .028 | 0.98 (0.97–1.00) P = .690 | (0.99–1.00) P = 1.000 |
| Penumbra | 0.90 (0.80–1.00) P = .058 | 0.93 (0.87–1.00) P = .070 | 0.98 (0.96–0.99) P = .350 | 0.99 (0.99–1.00) P = 1.000 |
| Nonischemic | 0.91 (0.84–0.99) P = .048 | 0.94 (0.88–0.99) P = .061 | 0.98 (0.96–1.00) P = .400 | 0.99 (0.99–1.00) P = 1.000 |
Note:—BBBP indicates blood-brain barrier permeability surface product.
For different regions of interest and different analysis windows, correlation coefficients and their 95% CIs are given. The P values provided are for a 1-sided test for H0: correlation ≥ .980.
Absolute (Table 3) and relative (Table 4) BBBP values were overlapping for the gold standard 90- to 240-second delayed acquisition and for the 90- to 210-second analysis window. For shorter analysis windows (90–180 seconds and, especially, 90–150 and 90–120 seconds), absolute and relative BBBP values were overestimated in the infarct, penumbra, and nonischemic tissue (Fig 1). In terms of mean absolute BBBP values, the differences between the gold standard 90- to 240-second delayed acquisition and the 90- to 210-second analysis window were 12% and 15% in the infarct and penumbra, respectively. The differences in terms of mean absolute BBBP values in the infarct and penumbra jumped sharply to 36% and 42%, 76%, and 89%, and 146% and 166% for the 90- to 180-, 90- to 150-, and 90- to 120-second analysis windows, respectively. Very similar differences were observed for the relative BBBP results.
Table 3:
Absolute permeability measurements for the gold standard 90- to 240-second delayed acquisition and for the truncated analysis windows*
| 90–120 Seconds | 90–150 Seconds | 90–180 Seconds | 90–210 Seconds | 90–240 Seconds | |
|---|---|---|---|---|---|
| Nonischemic | 4.62 (4.09–5.22) | 3.28 (2.85–3.79) | 2.51 (2.14–2.94) | 2.05 (1.73–2.42) | 1.82 (1.53–2.17) |
| Infarct | 4.92 (4.30–5.62) | 3.51 (2.97–4.16) | 2.72 (2.24–3.31) | 2.24 (1.82–2.76) | 2.00 (1.62–2.47) |
| Penumbra | 5.45 (4.81–6.17) | 3.87 (3.36–4.46) | 2.91 (2.50–3.39) | 2.35 (2.01–2.74) | 2.05 (1.75–2.41) |
Mean absolute permeability (milliliters per 100 grams per minute) values and corresponding 95% CIs are shown for different regions of interest and different acquisition-time datasets.
Table 4:
Relative permeability measurements for the gold standard 90- to 240-second delayed acquisition and for the truncated analysis windows*
| 90–120 Seconds | 90–150 Seconds | 90–180 Seconds | 90–210 Seconds | 90–240 Seconds | |
|---|---|---|---|---|---|
| Nonischemic | 12% (10%–15%) | 9% (7%–11%) | 7% (5%–8%) | 5% (4%–7%) | 5% (4%–6%) |
| Infarct | 53% (45%–64%) | 38% (31%–47%) | 30% (23%–37%) | 24% (19%–31%) | 22% (17%–28%) |
| Penumbra | 26% (22%–32%) | 19% (15%–23%) | 14% (11%–18%) | 11% (9%–14%) | 10% (8%–13%) |
Mean relative permeability values and corresponding 95% CIs are shown for different regions of interest and different acquisition-time datasets.
Fig 1.
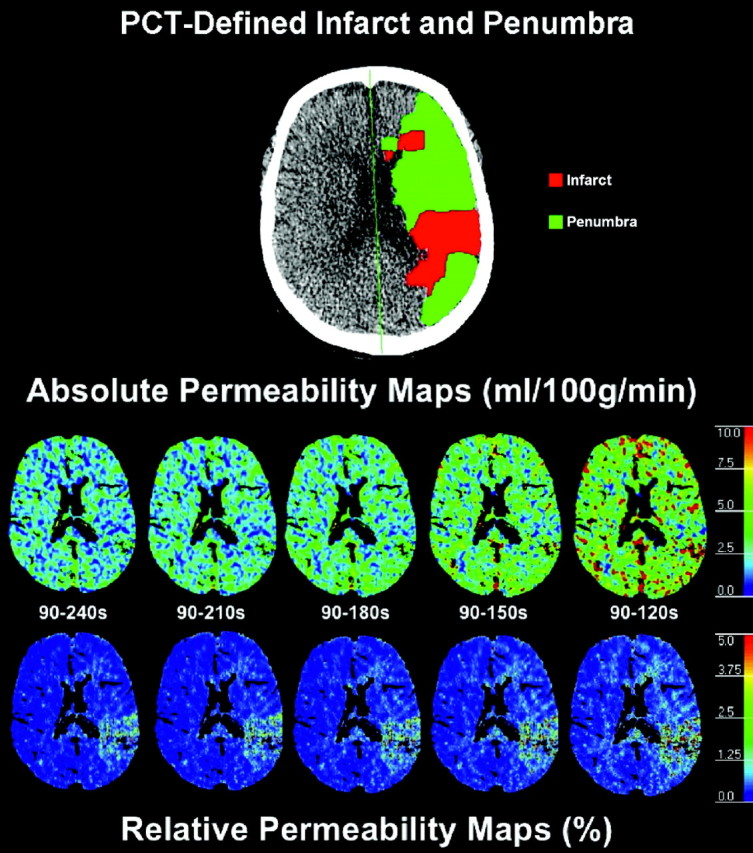
Absolute and relative permeability maps for the gold standard 90- to 240-second acquisition and for the truncated acquisitions (90–210, 90–180, 90–150, and 90–120 seconds). Absolute and relative BBBP values are overlapping for the gold standard 90- to 240-second delayed acquisition and for the 90- to 210-second truncated analysis window. For shorter analysis windows (90–180 seconds and, especially, 90–150 and 90–120 seconds), absolute and relative BBBP values are overestimated. The map depicting PCT-determined infarct and penumbra at the same level is also presented for reference.
Quality of the Linear Regression according to the Patlak Model
√MSE measurements (Table 5) were low and overlapping for the gold standard 90- to 240-second delayed acquisition and for the 90- to 210-second analysis window. For shorter analysis windows (including 90–180 seconds and, especially, 90–150 and 90–120 seconds), √MSE measurements were higher, indicating a poorer linear fitting.
Table 5:
√MSE calculated for the fitting of the Patlak line for the gold standard 90- to 240-second delayed acquisition and the truncated delayed acquisitions
| 90–120 Seconds | 90–150 Seconds | 90–180 Seconds | 90–210 Seconds | 90–240 Seconds | |
|---|---|---|---|---|---|
| Nonischemic | 4.84 (3.95–5.95) | 3.13 (2.65–3.71) | 2.16 (1.84–2.54) | 1.66 (1.41–1.95) | 1.35 (1.14–1.59) |
| Infarct | 5.17 (4.10–6.52) | 3.38 (2.73–4.19) | 2.31 (1.87–2.84) | 1.75 (1.43–2.15) | 1.41 (1.15–1.73) |
| Penumbra | 5.31 (4.31–6.55) | 3.42 (2.86–4.09) | 2.35 (1.99–2.78) | 1.79 (1.51–2.12) | 1.44 (1.21–1.72) |
Note:—√MSE indicates root-mean-square error.
Radiation Dose and Motion Artifacts
The effective radiation dose associated with the gold standard 240-second acquisition was calculated (3.2 mSv). For the 90- to 210-, 90- to 180-, 90- to 150-, and 90- to 120-second analysis windows, the decrease in radiation dose was 1.7%, 3.3%, 5%, and 6.7%, respectively.
Motion artifacts significant enough to interfere with permeability processing even after application of the registration algorithm were seen in 3 patients. In each of these cases, suitable permeability processing was not possible with either the full 90- to 240-second acquisition or any of the truncated analysis windows due to motion throughout the entirety of the delayed acquisition.
Discussion
The Patlak model18,19 is a relatively simple and frequently applied way of calculating BBBP from PCT studies.7–9,20,21 It involves using arterial and parenchymal contrast-enhancement curves to calculate the rate of contrast extravasation from an intravascular-to-extravascular compartment.18,19 A previous study demonstrated that a delayed PCT acquisition is required to verify the assumptions of the Patlak model11 because applying the Patlak model to first-pass PCT data leads to overestimated and inaccurate BBBP values.
In our study, we found that the duration for the delayed PCT acquisition should be at least 210 seconds because acquisitions shorter than 210 seconds lead to significantly overestimated BBBP values. The question of whether 210 seconds or 240 seconds is preferable is debatable. On one hand, several factors favor the 240-second acquisition. The 240-second acquisition is 12%–15% more accurate, and the additional 30 seconds of scanning time and the 1.7% increase in radiation are very likely clinically insignificant. On the other hand, the 210-second acquisition might be associated with a slightly lower risk of motion artifact (some patients might not move up to 210 seconds but may move during the last 240-second gantry rotation of the PCT series). However, we did not observe any such patients in our small series, and registration algorithms can often correct motion artifacts as long as they are not too severe.
We acknowledge several limitations to our work. First, because the goal of our study was to evaluate the minimum duration of the delayed acquisition to achieve valid Patlak-derived BBBP results, we did not assess other non-Patlak models that can be applied to PCT data to calculate BBBP, such as the distributed parameter model.6,12 Future studies are needed to determine whether our conclusions regarding an acceptable duration for the delayed acquisition also hold true for alternative models.
Second, we did not address the relationship between permeability and variables, such as admission infarct volume, time from symptom onset to scanning, or collateral flow. Such questions were beyond the scope of this study and will be addressed in a future work.
In conclusion, the duration for the delayed PCT acquisition should be at least 210 seconds. Shorter acquisitions lead to significantly overestimated BBBP values. Further research is required to investigate the relevance of delayed-phase PCT BBBP values in terms of the predictive value for hemorrhagic transformation in patients with acute stroke.
Footnotes
Max Wintermark received funding from the National Institutes of Health (NIH) National Center for Research Resources, Grant KL2 RR024130; GE Healthcare; and Philips Healthcare. Jason Hom received funding from the NIH National Center for Research Resources, UCSF-CTSI Grant UL1 RR024131.
Joerg Bredno is an employee of Philips Research North America.
The content of the article is solely the responsibility of the authors and does not necessarily represent the official views of the National Center for Research Resources, the NIH, or the other sponsors.
References
- 1.Hacke W, Donnan G, Fieschi C, et al. Association of outcome with early stroke treatment: pooled analysis of ATLANTIS, ECASS, and NINDS rt-PA stroke trials. Lancet 2004;363:768–74 [DOI] [PubMed] [Google Scholar]
- 2.Berger C, Fiorelli M, Steiner T, et al. Hemorrhagic transformation of ischemic brain tissue: asymptomatic or symptomatic? Stroke 2001;32:1330–35 [DOI] [PubMed] [Google Scholar]
- 3.Wang X, Lo EH. Triggers and mediators of hemorrhagic transformation in cerebral ischemia. Mol Neurobiol 2003;28:229–44 [DOI] [PubMed] [Google Scholar]
- 4.Bang OY, Saver JL, Alger JR, et al. Patterns and predictors of blood-brain barrier permeability derangements in acute ischemic stroke. Stroke 2009;40:454–61. Epub 2008 Nov 26 [DOI] [PubMed] [Google Scholar]
- 5.Kassner A, Roberts T, Taylor K, et al. Prediction of hemorrhage in acute ischemic stroke using permeability MR imaging. AJNR Am J Neuroradiol 2005;26:2213–17 [PMC free article] [PubMed] [Google Scholar]
- 6.Bisdas S, Hartel M, Cheong LH, et al. Detection of early vessel leakiness in acute ischemic stroke using computed tomography perfusion may indicate hemorrhagic transformation. Acta Radiol 2007;48:341–44 [DOI] [PubMed] [Google Scholar]
- 7.Bisdas S, Hartel M, Cheong LH, et al. Prediction of subsequent hemorrhage in acute ischemic stroke using permeability CT imaging and a distributed parameter tracer kinetic model. J Neuroradiol 2007;34:101–08 [DOI] [PubMed] [Google Scholar]
- 8.Lin K, Kazmi KS, Law M, et al. Measuring elevated microvascular permeability and predicting hemorrhagic transformation in acute ischemic stroke using first-pass dynamic perfusion CT imaging. AJNR Am J Neuroradiol 2007;28:1292–98 [DOI] [PMC free article] [PubMed] [Google Scholar]
- 9.Cianfoni A, Cha S, Bradley WG, et al. Quantitative measurement of blood-brain barrier permeability using perfusion-CT in extra-axial brain tumors. J Neuroradiol 2006;33:164–68 [DOI] [PubMed] [Google Scholar]
- 10.Goh V, Halligan S, Bartram CI. Quantitative tumor perfusion assessment with multidetector CT: are measurements from two commercial software packages interchangeable? Radiology 2007;242:777–82 [DOI] [PubMed] [Google Scholar]
- 11.Dankbaar JW, Hom J, Schneider T, et al. Dynamic perfusion CT assessment of the blood-brain barrier permeability: first pass versus delayed acquisition. AJNR Am J Neuroradiol 2008;29:1671–76. Epub 2008 Jul 17 [DOI] [PMC free article] [PubMed] [Google Scholar]
- 12.Johnson JA, Wilson TA. A model for capillary exchange. Am J Physiol 1966;210:1299–303 [DOI] [PubMed] [Google Scholar]
- 13.Miles KA. Perfusion CT for the assessment of tumour vascularity: which protocol? Br J Radiol 2003;76 (spec no 1):S36–42 [DOI] [PubMed] [Google Scholar]
- 14.Dankbaar JW, Hom J, Schneider T, et al. Accuracy and anatomical coverage of perfusion CT assessment of the blood-brain barrier permeability: one bolus versus two boluses. Cerebrovasc Dis 2008;26:600–05 [DOI] [PMC free article] [PubMed] [Google Scholar]
- 15.Wintermark M, Maeder P, Thiran JP, et al. Quantitative assessment of regional cerebral blood flows by perfusion CT studies at low injection rates: a critical review of the underlying theoretical models. Eur Radiol 2001;11:1220–30 [DOI] [PubMed] [Google Scholar]
- 16.Axel L. Tissue mean transit time from dynamic computed tomography by a simple deconvolution technique. Invest Radiol 1983;18:94–99 [DOI] [PubMed] [Google Scholar]
- 17.Wintermark M, Flanders AE, Velthuis B, et al. Perfusion-CT assessment of infarct core and penumbra: receiver operating characteristic curve analysis in 130 patients suspected of acute hemispheric stroke. Stroke 2006;37:979–85 [DOI] [PubMed] [Google Scholar]
- 18.Patlak CS, Blasberg RG, Fenstermacher JD. Graphical evaluation of blood-to-brain transfer constants from multiple-time uptake data. J CerebBlood Flow Metab 1983;3:1–7 [DOI] [PubMed] [Google Scholar]
- 19.Patlak CS, Blasberg RG. Graphical evaluation of blood-to-brain transfer constants from multiple-time uptake data: generalizations. J Cereb Blood Flow Metab 1985;5:584–90 [DOI] [PubMed] [Google Scholar]
- 20.Bartolini A, Gasparetto B, Furlan M, et al. Functional perfusion and blood-brain barrier permeability images in the diagnosis of cerebral tumors by angio CT. Comput Med Imaging Graph 1994;18:145–50 [DOI] [PubMed] [Google Scholar]
- 21.Leggett DA, Miles KA, Kelley BB. Blood-brain barrier and blood volume imaging of cerebral glioma using functional CT: a pictorial review. Eur J Radiol 1999;30:185–90 [DOI] [PubMed] [Google Scholar]