Abstract
BACKGROUND AND PURPOSE:
It has been reported that high-resolution susceptibility-weighted imaging (HR-SWI) is a promising tool for assessing brain tumor characterization noninvasively. The purpose of this study was to determine the added value and diagnostic performance of HR-SWI for differentiating solitary enhancing brain lesions (SELs) by assessing intratumoral susceptibility signals (ITSSs).
MATERIALS AND METHODS:
Sixty-four consecutive patients with SELs, without previous surgery, were retrospectively reviewed. We performed 2 consensus reviews, by using conventional MR images alone and with adjunctive HR-SWI. We applied an ITSS grading system based on the degree of the ITSS. Then, we compared the presence and grade of the ITSSs among specific pathologic types of SELs.
RESULTS:
Two observers diagnosed tumor pathology accurately in 43 (67%) of 64 SELs after reviewing the conventional images alone and 50 (78%) of 64 SELs after reviewing the adjunctive HR-SWI (P = .016, McNemar test). ITSSs were seen in 25 (100%) of 25 glioblastoma multiformes (GBMs), in 2 (40%) of 5 anaplastic astrocytomas, and in 11 (73%) of 15 metastatic tumors. Although the ITSSs were unable to distinguish between GBMs and solitary metastatic tumors, differentiation between GBMs and solitary metastatic tumors was achieved (P = .01) by using a high ITSS degree (grade 3). Moreover, the ITSSs could discriminate high-grade gliomas from lymphomas and nontumorous lesions with a specificity of 100% (P < .0001).
CONCLUSIONS:
The use of ITSSs on HR-SWIs significantly improves the accuracy for the differential diagnosis of SELs compared with the use of conventional MR imaging alone.
High-resolution susceptibility-weighted imaging (HR-SWI) uses the blood oxygenation level–dependent (BOLD)-induced phase difference between venous blood and the surrounding brain tissue.1–3 Moreover, HR-SWI was recently reported as being able to demonstrate the magnetic susceptibility differences of various tissues and to increase the sensitivity to the susceptibility effect of microvenous structures and blood products.1–3 Therefore, this novel imaging technique can be used for noninvasive visualization of normal or pathologic vascular structures that are not visible on conventional MR imaging.4 HR-SWI has been applied mainly in the assessment of various vascular and hemorrhagic brain disorders, such as arteriovenous malformations, occult low-flow vascular lesions, and cavernous malformations.4–6 However, the clinical application of HR-SWI with a 1.5T MR imaging scanner has been limited by long acquisition times that are related to the relatively long TEs required for the BOLD-induced phase effect. Recently, the development of 3T MR imaging scanners and the use of a parallel imaging technique have allowed increasing the speed, coverage, and signal intensity–to-noise ratio of MR imaging. Therefore, HR-SWI is now available for the routine examination of patients with various brain disorders to obtain both high spatial resolution and a reasonable acquisition time.
Previous reports showed the added value of HR-SWI in brain tumor imaging compared with conventional MR imaging.7–9 Sehgal et al7 reported that SWI should prove useful for tumor characterization because of its ability to highlight blood products and venous vasculature better and to reveal new internal architecture. Pinker et al9 proposed that because the intralesional susceptibility signals as depicted on HR-SWI are correlated with tumor grade as determined by a positron-emission tomography (PET) study and histopathology, the use of these images seems to be promising for noninvasive glioma grading.
As shown by the previous report,7 HR-SWI was much more sensitive for showing blood products, calcifications, and venous vasculature, which usually appeared as low-signal-intensity structures on HR-SWI. These low-signal-intensity structures detected on HR-SWI may not be obvious on conventional MR imaging but could be useful in tumor characterization, tumor grading, or diagnosis of specific tumor type.7 We hypothesized that these intratumoral low-signal-intensity structures detected on HR-SWI may provide additional information in the differential diagnosis of solitary enhancing lesions (SELs) detected on conventional MR imaging. Differentiation of SELs, such as high-grade glioma versus solitary metastasis or lymphoma, by MR imaging remains an important clinical problem. However, the sensitivity, specificity, positive predictive value (PPV), and negative predictive value (NPV) of conventional MR imaging for the differential diagnosis of SELs are relatively low.10–12 The purpose of this study was to determine the benefit of using adjunctive HR-SWIs for differentiating SELs by assessing intratumoral susceptibility signals (ITSSs).
Materials and Methods
Study Patients
Between May 2006 and November 2008, data in 64 consecutive patients with intra-axial SELs who met the inclusion criteria for this study were retrospectively reviewed from our data base. Inclusion criteria were the following: 1) Patients were referred for preoperative or pretreatment assessment of SELs detected on conventional MR images, and 2) they underwent both conventional MR imaging and HR-SWI. There were 28 male and 36 female patients, and the ages of patients ranged from 19 to 76 years, with a mean of 43 years. An experienced neuropathologist performed the histopathologic evaluation. All tumors were pathologically proved by means of either stereotactic resection (n = 45) or stereotactically guided biopsy (n = 19) and were classified in accordance with the revised WHO system of brain tumors.13 The final pathologic diagnoses consisted of 30 glial tumors, 22 nonglial tumors, and 12 nontumorous lesions. The 30 glial tumors included 5 anaplastic astrocytomas (WHO grade III) and 25 glioblastoma multiformes (GBMs) (WHO grade IV). The 22 nonglial tumors included 15 metastatic tumors and 7 lymphomas. In all of the 15 patients with metastatic tumors, the histopathologic findings were compatible with the patient's known primary malignancy: 9 non-small cell lung cancers, 3 small cell lung cancers, 2 breast cancers, and 1 esophageal cancer. The 12 nontumorous lesions included 3 tumefactive multiple sclerosis (MS) lesions and 9 inflammatory granulomas, including tuberculosis and fungal granulomas.
MR Imaging Protocol
MR imaging was performed by using a 3T system (Achieva; Philips Medical Systems, Best, the Netherlands) with an 8-channel sensitivity encoding (SENSE) head coil with a SENSE factor of 2. Our conventional MR imaging protocol included the following sequences: axial T2-weighted fast spin-echo imaging (TR/TE, 3000/80 ms; section thickness, 5 mm; matrix, 348 × 270; FOV, 200 mm; NEX, 1), axial T1-weighted spin-echo imaging (TR/TE, 495/10 ms; section thickness, 5 mm; matrix, 256 × 190; FOV, 200 mm; NEX, 1), conventional gradient-echo imaging (TR/TE, 3692/46 ms; section thickness, 5 mm; matrix, 128 × 125; FOV, 22; NEX, 1), diffusion-weighted imaging (TR/TE, 3804/46 ms; section thickness, 5 mm; matrix, 128 × 126; FOV, 220; NEX, 1), and contrast-enhanced axial and coronal T1-weighted imaging (TR/TE, 495/10 ms; section thickness, 5 mm; matrix, 256 × 190; FOV, 200 mm; NEX, 1). HR-SWI was performed according the technique previously described.14,15 The detailed image parameters for HR-SWI were as follows: flow-compensated 3D gradient-echo sequence; TR/TE, 24/34 ms; FA, 10°; FOV, 200 × 200 mm; matrix, 332 × 332; section thickness, 3 mm; slab thickness, 135 mm; total acquisition time, 4 minutes 2 seconds.
Image Analysis
Our major imaging analyses were qualitative and semiquantitative. The purpose of the qualitative analysis was to assess the added value of HR-SWI to conventional MR imaging alone and the semiquantitative analysis focused on the diagnostic performance of HR-SWI in the differential diagnosis of SELs. The qualitative analysis was performed with the retrospective review with reviewers blinded to clinical and histopathologic findings and focused on the presence or absence of ITSS in each histopathologic type of SEL. The semiquantitative analysis was performed by using a receiver operating characteristic (ROC) curve to assess the sensitivity, specificity, PPV, and NPV of ITSS grade in each histopathologic type of SEL.
To assess the benefit of the use of HR-SWI for the qualitative differentiation of SELs, each of two observers reviewed the MR images of 64 SELs twice. Two review sessions were spaced 4 weeks apart to avoid recall bias. In the first review, the observers were given conventional MR images only, including T2-weighted images, T1-weighted images, diffusion-weighted images with an apparent diffusion coefficient, conventional gradient-echo images (T2*-weighted), and contrast-enhanced T1-weighted images. For the qualitative analyses, the 2 observers independently categorized the SELs as tumors and nontumorous lesions and then subcategorized the tumors into high-grade gliomas, metastatic tumors, and lymphomas. As a last step, the observers tried to make a histopathologic diagnosis of tumor type on the basis of conventional MR imaging findings. A final decision was achieved by consensus. Because this study was planned to be reviewed retrospectively for pathologically proved SELs, the final consensus reading was done within the following 6 categories: GBM, anaplastic astrocytoma, metastatic tumor, lymphoma, tumefactive MS, and inflammatory granuloma. In the second review, the observers were given conventional MR images and HR-SWIs. The step of qualitative analyses in the second review was the same as that with the first review. The final imaging diagnoses of the second review sessions were obtained on the basis of conventional MR imaging findings and the presence of ITSS on HR-SWI.
For qualitative imaging analysis for the SELs on conventional MR images, interpretation was based on 8 criteria: contrast material enhancement, border definition, mass effect, signal-intensity heterogeneity, hemorrhage, necrosis, degree of edema, and involvement of the corpus callosum or crossing the midline.16,17 Apparent diffusion coefficients, which are partly related to tumor cellularity, were also assessed. Necrotic components were differentiated as seen on contrast-enhanced T1-weighted images as the interior of enhanced lesions. Hemorrhagic lesions were differentiated as seen on unenhanced T1-weighted MR images as areas of hyperintensity and as seen on conventional gradient-echo images as areas of low signal intensity. For qualitative imaging analysis for the SELs on HR-SWIs, an ITSS was defined with following criteria: 1) low-signal-intensity fine linear or dotlike structures, which are not obvious on conventional MR images, with or without conglomeration within a tumor as depicted on HR-SWIs. 2) Attenuated or granular susceptibility low signals, which can be easily detected on conventional MR imaging, were excluded because these findings were not additional information on HR-SWI. 3) Fuzzy or diffuse low signals were excluded because the quantification of these findings could be subjective.
For semiquantitative analysis, the degree of ITSS was divided into 3 grades (Fig 1): Grade 1 was defined as no ITSS, grade 2 was defined as 1–10 dotlike or fine linear ITSSs, and grade 3 was defined as ≥11 dotlike or fine linear ITSSs within a tumor. We also assessed the level of interobserver variability of the ITSS grading. The sensitivity, specificity, PPV, and NPV of the ITSSs were calculated according to the correct diagnoses of the SELs.
Fig 1.
The grade of intratumoral susceptibility signals on HG-SWI. A, Grade 1 (arrow). B, Grade 2 (circle). C, Grade 3 (arrow).
Statistical Analysis
The McNemar test was used to assess the added value of HR-SWI to conventional MR imaging in the qualitative histopathologic diagnoses of SELs. An intraclass correlation coefficient (ICC) was used to determine the levels of interobserver variability in the semiquantitative grading of ITSS. ROC curve analyses were performed to determine optimum thresholds and diagnostic accuracy of ITSS for differentiating SELs. This analysis permitted the determination of the sensitivity, specificity, PPV, and NPV associated with ITSS as a function of the threshold value used to differentiate SELs correctly. We analyzed the McNemar test and ICC by using the Statistical Package for the Social Sciences (Version 13.0; SPSS, Chicago, Ill) and the ROC curve by using the MedCalc for Windows (MedCalc Software, Mariakerke, Belgium). All P values were 2-tailed with .05 as the criterion for statistical significance.
Results
Qualitative Analysis: Added Value of HR-SWI to Conventional MR Imaging Alone
The additional acquisition time for HR-SWI was 4 minutes 2 seconds. ITSSs were seen in all 25 GBMs (100%), in 2 (40%) of 5 anaplastic astrocytomas, and in 11 (73%) of 15 metastatic tumors. No evidence of ITSSs was detected in lymphomas or nontumorous lesions. Table 1 shows the incidence of ITSSs in each pathologic type of SEL. The 2 observers diagnosed accurate tumor pathology within 6 categories (GBM, anaplastic astrocytoma, metastatic tumor, lymphoma, tumefactive MS, and inflammatory granuloma) in 43 (67%) of 64 SELs after reviewing the conventional MR images alone and in 50 (78%) of 64 SELs after reviewing both the conventional MR images and the HR-SWIs. The McNemar test showed that the difference in overall diagnostic accuracy of conventional MR imaging versus adjunctive HR-SWI was statistically significant (P = .016). In the qualitative analyses for histopathologic diagnoses of SELs, conventional MR imaging without HR-SWI produced 7 more false-negative studies than conventional MR imaging with HR-SWI (4 in metastasis and 3 in lymphoma, respectively). In these patients, the lack of ITSS on HR-SWI provided additional information in the imaging diagnosis of metastasis and lymphoma.
Table 1:
The incidence of ITSS in each pathologic group of SELs
| Pathologic Diagnosis | ITSS Degree |
||
|---|---|---|---|
| Grade 1 (%) | Grade 2 (%) | Grade 3 (%) | |
| GBM | 0/25 (0) | 4/25 (16) | 21/25 (84) |
| AA | 3/5 (60) | 2/5 (40) | 0/5 (0) |
| Metastasis | 4/15 (27) | 5/15 (33) | 6/15 (40) |
| Lymphoma | 7/7 (100) | 0/7 (0) | 0/7 (0) |
| MS | 3/3 (100) | 0/3 (0) | 0/3 (0) |
| Granuloma | 9/9 (100) | 0/9 (0) | 0/9 (0) |
Note:—AA indicates anaplastic astrocytoma; ITSS, intratumoral susceptibility signal; SEL, solitary enhancing lesion; GBM, glioblastoma multiforme; MS, multiple sclerosis.
Semiquantitative Analysis: Diagnostic Performance of ITSSs for SELs
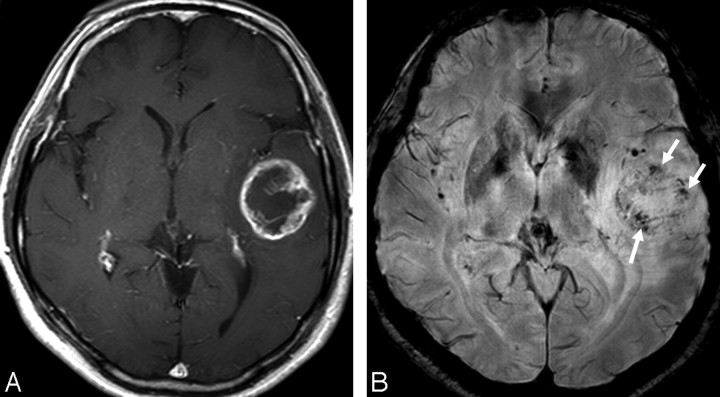
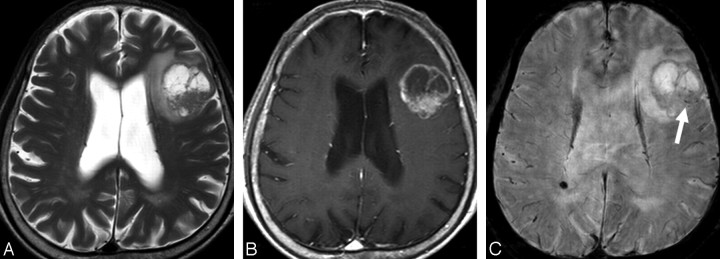
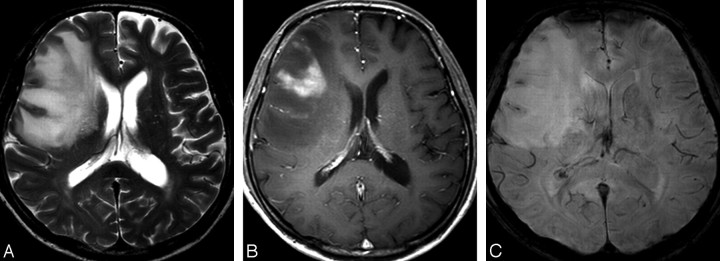
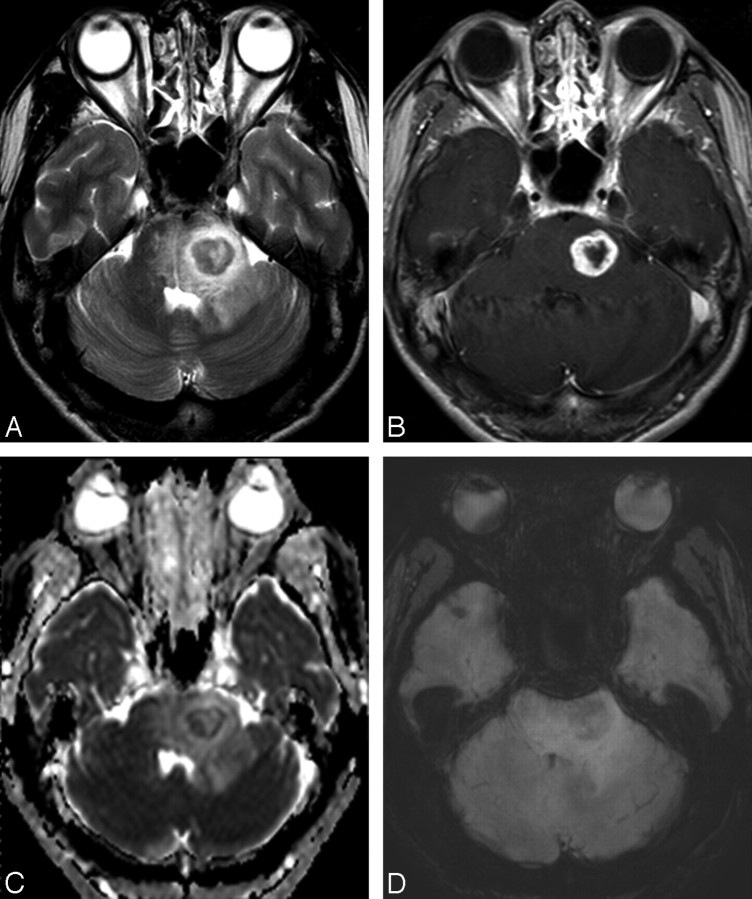
In the semiquantitative measurement of the ITSS degree, the interobserver agreement between the 2 reviewers was excellent (ICC = 0.952). The ITSSs were not able to differentiate GBMs and metastatic tumors (P = .062, Table 2). In contrast, for a high-grade ITSS (grade 3), the differentiation between GBMs and metastatic tumors was significant, with a sensitivity of 84.0% and a specificity of 60.0% (P = .012, Figs 2 and 3). The ITSSs were able to differentiate high-grade gliomas and lymphomas with a sensitivity of 86.7% and a specificity of 100.0% (P < .0001, Table 2 and Figs 2 and 4). The differentiation between high-grade gliomas and nontumorous lesions (tumefactive MS and inflammatory granulomas) was also significant by using HR-SWI (Fig 5). The sensitivity, specificity, PPV, and NPV for the differentiation of SELs with the semiquantitative analysis of ITSSs are shown in Table 2.
Table 2:
Sensitivity, specificity, PPV, and NPV of ITSSs for differentiating specific pathologic groups of SELs
| Differential Diagnosis | Sensitivity | Specificity | PPV | NPV |
|---|---|---|---|---|
| GBM vs metastasis | 84.0% | 60.0% | 77.8% | 69.2% |
| HGG vs metastasis | 70.0% | 60.0% | 77.8% | 50.0% |
| HGG vs lymphoma | 86.7% | 100.0% | 100.0% | 63.6% |
| HGG vs nontumor | 86.7% | 100.0% | 100.0% | 75.0% |
Note:—HGG indicates high-grade glioma; PPV, positive predictive value; NPV, negative predictive value.
Fig 2.
MR images of a 51-year-old woman with a left temporal GBM. A, The contrast-enhanced axial T1-weighted image shows a mass with peripheral rim enhancement. B, HR-SWI demonstrates conglomerated dotlike and fine linear ITSSs (grade 3, arrows) in the periphery of the mass.
Fig 3.
MR images of a 76-year-old man with a solitary metastatic brain tumor. A, The axial T2-weighted image shows a mass with central necrosis in left frontal lobe. B, The contrast-enhanced axial T1-weighted image shows the mass with irregular peripheral rim enhancement. C, HR-SWI reveals scattered dotlike ITSSs (grade 2, arrow) in the periphery of the mass.
Fig 4.
MR images of a 45-year-old man with lymphoma. A, The axial T2-weighted image shows an ill-defined mass with high signal intensity in the right frontal lobe. B, The contrast-enhanced axial T1-weighted image shows the mass with peripheral enhancement. C, No evidence of an ITSS (grade 1) is seen within the mass on HR-SWI.
Fig 5.
MR images of a 47-year-old man with a fungal granuloma. A, The axial T2-weighted image shows a mass with central necrosis and surrounding edema in the left pons. B, The contrast-enhanced axial T1-weighted image shows the mass with irregular peripheral rim enhancement. C, Apparent diffusion coefficient shows relatively restricted diffusion in the periphery of the mass. D, HR-SWI reveals fuzzy and diffuse low signals (not defined as ITSS in the present study) in the periphery of the mass.
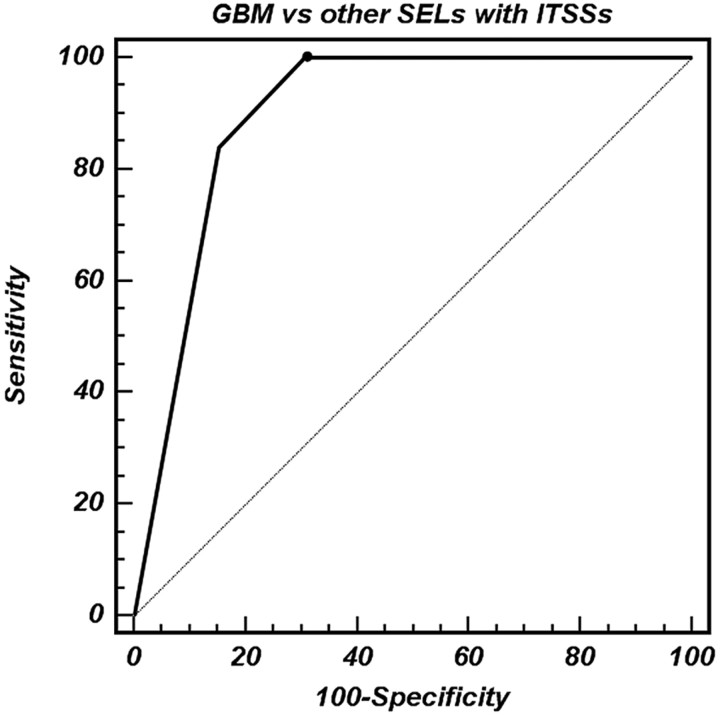
From ROC curve analyses, grade 3 ITSSs provided a specificity of 84.6% for differentiating between GBMs and other SELs (Table 3 and Fig 6). The area under the curve of the ITSSs was 0.650 (95% confidence interval [CI], 0.493–0.786) for differentiating high-grade gliomas and metastatic tumors, 0.933 (95% CI, 0.800–0.988) for differentiating high-grade gliomas and lymphomas, and 0.933 (95% CI, 0.811–0.986) for differentiating high-grade gliomas and nontumorous lesions.
Table 3:
Sensitivity, specificity, PPV, and NPV of ITSS degree for differentiating GBMs from other SELs according to threshold values
| ITSS Degree | Sensitivity | Specificity | PPV | NPV |
|---|---|---|---|---|
| ≥2 | 100.0% | 69.2% | 67.6% | 100.0% |
| 3 | 84.0% | 84.6% | 77.8% | 89.2% |
Fig 6.
ROC curve analysis of the degree of ITSS for correctly identifying GBM (WHO grade IV). The area under the ROC curve for the degree of ITSS is 0.898 (95% CI, 0.797–0.960). The sensitivity, specificity, PPV, and NPV for differentiating GBMs and other SELs by using high-grade ITSSs (grade 3) are 84.0, 84.6, 77.8, and 89.2%, respectively.
Discussion
In this study, we found that using ITSSs benefited the differential diagnosis of SELs compared with using conventional MR images only. In 3 cases of lymphomas, initial imaging diagnoses based only on conventional MR imaging findings were GBMs. However, the lack of ITSS on HR-SWI provided additional information in the imaging diagnosis of lymphoma. We believe that the lack of ITSS in lymphomas could be attributed to the fact that microhemorrhage or calcification is rare in primary central nervous system (CNS) lymphoma. Although there is little knowledge about the relationship between primary CNS lymphoma and tumor angiogenesis, a previous report showed how a relative cerebral blood volume (rCBV) value compared with high grade glioma.18 One of the most striking histopathologic features of primary CNS lymphoma is the angiocentric growth pattern and widening of the perivascular space. Neovascularization is not a prominent feature in lymphoma.18 This pathologic background can explain rarely visible ITSS in primary CNS lymphoma. Four patients with solitary metastatic tumors showing grade 1 ITSSs were initially diagnosed as having GBMs on the basis of conventional imaging alone; however, the diagnoses by using conventional imaging with adjunctive HR-SWI were metastases with the help of the lack of ITSS.
In the semiquantitative analyses, by using an ITSS grade, the differentiation between high-grade gliomas and solitary metastatic tumors was not significant. However, metastatic tumors had a significantly lower ITSS grade than GBMs. With a high degree of ITSS (grade 3), distinguishing between GBMs and solitary metastatic tumors was possible. Moreover, from the ROC curve analyses, a grade 3 ITSS provided a specificity of 84.6% for differentiating GBMs and other SELs. Because differences in the ITSS degree between GBMs and metastatic tumors may have clinical implications, further study is warranted to elucidate the pathophysiologic basis of these differences and to determine their relevance to diagnosis and treatment. The ITSSs as seen on HR-SWIs could distinguish high-grade gliomas from lymphomas and nontumorous lesions, with a specificity of 100%. In our cases, ITSSs were never seen in lymphomas or nontumorous lesions, including tumefactive MS and inflammatory granulomas. Although rich microvasculature can be a common pathologic finding of inflammatory granulomas, in our experience, the HR-SWI findings of inflammatory granulomas showed a morphologic pattern of diffuse and fuzzy low signal intensities different from ITSSs defined in the present study. We did not define these fuzzy or diffuse low signals as ITSSs because these findings could be subjective and the measurement of their degree is difficult. The lack of ITSS in tumefactive MS could be attributed to the rarity of microhemorrhage, calcification, and vascularity.
As shown by the previous report,7 HR-SWI was much more sensitive for showing blood products, calcifications, and venous vasculature, which may not be obvious on conventional MR images. However, they could be useful in tumor characterization. Sehgal et al7 showed the added value of HR-SWI in brain tumor characterization compared with conventional MR imaging because of its ability to highlight blood products and venous vasculature better. On the other hand, high-grade gliomas contain a relatively large amount of deoxyhemoglobin, which is probably related to angiogenesis and an increased tumor blood supply, and this can generate susceptibility effects and cause signal-intensity loss.9 Moreover, intralesional susceptibility effects have been reported to correlate with tumor grade, as determined by PET and histopathology.9 Mittal et al19 proposed that high rCBV values on perfusion imaging in tumors go hand in hand with evidence of blood products detected within the tumor matrix on HR-SWI. In this study, conglomerates of dots or fine linear ITSSs were seen more frequently in GBMs than in other SELs, demonstrating the potential complementary value of using ITSSs as seen on HR-SWI for diagnosing brain tumors.
One limitation of our study was the uneven distribution of tumor pathologies in the analysis. Our study included relatively few anaplastic astrocytomas (WHO grade III) and lymphomas. For practical purposes, we grouped patients with anaplastic astrocytomas and GBMs together in the major analysis. However, the relatively small sample size of anaplastic astrocytomas compared with GBMs might lead to an overestimation of the specificity and PPV for differentiating high-grade gliomas and other SELs. Furthermore, a limited variety of metastases was studied. Most of the metastatic tumor pathologies in the present study were lung cancer. The possibility remains that metastases of different histopathologic origins can exhibit different degrees of ITSS.
Further studies with a larger population and even distribution of tumor pathologies are necessary to validate the utility of HR-SWI for differentiating each SEL. Another limitation was the lack of guidelines or references for the morphologic classification of ITSSs. However, the morphologic classification of ITSS was not a major focus of this study and did not affect the final imaging diagnosis. In our experience, the fine linear and dotlike ITSSs, which were not obvious on conventional MR imaging, were most frequently seen in GBMs. On the other hand, other attenuated or granular low-signal-intensity structures were also seen on conventional MR imaging. Therefore, we did not define these attenuated or granular low signal intensity structures as ITSSs because we focused on the added value of HR-SWI.
The direct radiologic-pathologic correlation was not obtained in this study. As proposed by the report of Sehgal et al,7 this correlation is challenging because blood products may have resulted from intraprocedural hemorrhage and the pathology reports of our institution also mainly focused on vascular hyperplasia and necrosis. Moreover, the direct pathologic correlation was not a major focus of this study. We focused on the difference in the degree of ITSS among SELs irrespective of ITSS pathology.
Conclusions
The use of ITSSs provides a benefit for the differential diagnosis of SELs compared with the use of conventional MR imaging alone. A high-grade ITSS may help distinguish GBMs from solitary metastatic brain tumors. The lack of ITSS can be a specific sign in the imaging diagnosis of lymphomas or nontumorous lesions.
References
- 1. Reichenbach JR, Jonetz-Mentzel L, Fitzek C, et al. High-resolution blood oxygen-level dependent MR venography (HRBV): a new technique. Neuroradiology 2001; 43: 364– 69 [DOI] [PubMed] [Google Scholar]
- 2. Reichenbach JR, Essig M, Haacke EM, et al. High-resolution venography of the brain using magnetic resonance imaging. MAGMA 1998; 6: 62– 69 [DOI] [PubMed] [Google Scholar]
- 3. Reichenbach JR, Haacke EM. High-resolution BOLD venographic imaging: a window into brain function. NMR Biomed 2001; 14: 453– 67 [DOI] [PubMed] [Google Scholar]
- 4. Sehgal V, Delproposto Z, Haacke EM, et al. Clinical applications of neuroimaging with susceptibility-weighted imaging. J Magn Reson Imaging 2005; 22: 439– 50 [DOI] [PubMed] [Google Scholar]
- 5. Lee BC, Vo KD, Kido DK, et al. MR high-resolution blood oxygenation level dependent venography of occult (low-flow) vascular lesions. AJNR Am J Neuroradiol 1999; 20: 1239– 42 [PMC free article] [PubMed] [Google Scholar]
- 6. de Souza JM, Domingues RC, Cruz LC, Jr, et al. Susceptibility-weighted imaging for the evaluation of patients with familial cerebral cavernous malformations: a comparison with T2-weighted fast spin-echo and gradient-echo sequences. AJNR Am J Neuroradiol 2008; 29: 154– 58 [DOI] [PMC free article] [PubMed] [Google Scholar]
- 7. Sehgal V, Delproposto Z, Haddar D, et al. Susceptibility-weighted imaging to visualize blood products and improve tumor contrast in the study of brain masses. J Magn Reson Imaging 2006; 24: 41– 51 [DOI] [PubMed] [Google Scholar]
- 8. Barth M, Nobauer-Huhmann IM, Reichenbach JR, et al. High-resolution three-dimensional contrast-enhanced blood oxygenation level-dependent magnetic resonance venography of brain tumors at 3 Tesla: first clinical experience and comparison with 1.5 Tesla. Invest Radiol 2003; 38: 409– 14 [DOI] [PubMed] [Google Scholar]
- 9. Pinker K, Noebauer-Huhmann IM, Stavrou I, et al. High-resolution contrast-enhanced, susceptibility-weighted MR imaging at 3T in patients with brain tumors: correlation with positron-emission tomography and histopathologic findings. AJNR Am J Neuroradiol 2007; 28: 1280– 86 [DOI] [PMC free article] [PubMed] [Google Scholar]
- 10. Enzinger C, Strasser-Fuchs S, Ropele S, et al. Tumefactive demyelinating lesions: conventional and advanced magnetic resonance imaging. Mult Scler 2005; 11: 135– 39 [DOI] [PubMed] [Google Scholar]
- 11. Law M, Meltzer DE, Cha S. Spectroscopic magnetic resonance imaging of a tumefactive demyelinating lesion. Neuroradiology 2002; 44: 986– 98 [DOI] [PubMed] [Google Scholar]
- 12. Kwee SA, Coel MN, Lim J, et al. Combined use of F-18 fluorocholine positron emission tomography and magnetic resonance spectroscopy for brain tumor evaluation. J Neuroimaging 2004; 14: 285– 89 [DOI] [PubMed] [Google Scholar]
- 13. Daumas-Duport C, Beuvon F, Varlet P, et al. Gliomas: WHO and Sainte-Anne Hospital classifications. Ann Pathol 2000; 20: 413– 28 [PubMed] [Google Scholar]
- 14. Rauscher A, Sedlacik J, Barth M, et al. Magnetic susceptibility-weighted MR phase imaging of the human brain. AJNR Am J Neuroradiol 2005; 26: 736– 42 [PMC free article] [PubMed] [Google Scholar]
- 15. Haacke EM, Xu Y, Cheng YC, et al. Susceptibility-weighted imaging (SWI). Magn Reson Med 2004; 52: 612– 18 [DOI] [PubMed] [Google Scholar]
- 16. Castillo M, Scatliff JH, Bouldin TW, et al. Radiologic-pathologic correlation: intracranial astrocytoma. AJNR Am J Neuroradiol 1992; 13: 1609– 16 [PMC free article] [PubMed] [Google Scholar]
- 17. Dean BL, Drayer BP, Bird CR, et al. Gliomas: classification with MR imaging. Radiology 1990; 174: 411– 15 [DOI] [PubMed] [Google Scholar]
- 18. Cha S, Knopp EA, Johnson G, et al. Intracranial mass lesions: dynamic contrast-enhanced susceptibility-weighted echo-planar perfusion MR imaging. Radiology 2002; 223: 11– 29 [DOI] [PubMed] [Google Scholar]
- 19. Mittal S, Wu Z, Neelavalli J, et al. Susceptibility-weighted imaging: technical aspects and clinical applications, part 2. AJNR Am J Neuroradiol 2009; 30: 232– 52. Epub 2009 Jan 8 [DOI] [PMC free article] [PubMed] [Google Scholar]


