Abstract
BACKGROUND AND PURPOSE: MR imaging is widely used for the diagnosis and follow-up of neurosarcoidosis lesions. However, the temporal evolution of imaging abnormalities and the prognostic significance of imaging features is not well understood. We undertook a retrospective study of patients with biopsy-proved or clinically diagnosed neurosarcoidosis for the following reasons: 1) to assess concordance between abnormalities noted on MR imaging with neurologic symptoms at presentation; 2) to correlate changes in imaging findings during follow-up with clinical improvement or worsening; and 3) to identify imaging features that may have prognostic significance.
MATERIALS AND METHODS: We reviewed radiologic records from 1999 to 2008 of patients with biopsy-proved or clinically diagnosed neurosarcoidosis and correlated MR imaging findings in these patients with their demographic characteristics, clinical features, and symptomatic responses during follow-up.
RESULTS: Thirty-two patients were included in the study. Cranial nerve lesions and leptomeningeal disease identified on MR imaging were symptomatic in 64% patients, dural lesions were associated with symptoms in 28% patients, but nonenhancing white matter lesions did not have correlating symptoms. During follow-up, MR imaging findings generally changed in concordance with the change in clinical symptoms (80% patients). Cranial nerve enhancement (9/11) and spinal lesions (5/8) were most likely to resolve with clinical improvement, whereas dural lesions (6/11), enhancing parenchymal lesions (3/7), and non-enhancing parenchymal lesions (0/4) were less likely to change during therapy. Patients with ≥1 enhancing T2-hypointense lesion (4/7, 57%) were less likely to show clinical improvement than those without such lesions (12/13, 92%).
CONCLUSIONS: Although many sarcoid-related MR imaging abnormalities were not associated with correlating symptoms at presentation, there was a high degree of concordance between changes in clinical symptoms and MR imaging abnormalities during follow-up. Enhancing T2-hypointense dural and parenchymal lesions were associated with suboptimal imaging and clinical response to immunosuppressive therapy.
Sarcoidosis is a systemic granulomatous disease of unknown origin, characterized by the presence of noncaseating granulomas in affected organs.1 Lesions are commonly seen in the lungs, lymphatic system, eyes, skin, liver, spleen, salivary glands, heart, nervous system, muscles, and bones. The incidence of sarcoidosis is approximately 5.9 per 100,000 person-years for men and 6.3 per 100,000 person-years for women in the United States.2 The disease has a bimodal age distribution with an initial peak at 20–29 years and a later peak in women older than 50 years of age.1 The risk of sarcoidosis is higher in African Americans; the estimated lifetime risk of sarcoidosis in African Americans is 2.4%, nearly threefold higher than 0.85% in whites.3
Sarcoidosis affects the central nervous system (CNS) in 14%–27% of patients in postmortem series.4–7 Symptomatic disease is less common, having been variously estimated at 3%–5%.8,9 Imaging studies can detect neurologic disease in 10% of all patients with sarcoidosis and are important in the clinical evaluation of sarcoidosis for several reasons: 1) Neurologic manifestations are frequently the presenting symptoms of systemic sarcoidosis, and recognition of suggestive imaging findings may streamline further diagnostic evaluation and minimize invasive tests; and 2) imaging is used during follow-up both to assess the response to immunosuppressive therapy and in surveillance for new lesions.
Although the wide spectrum of imaging findings in neurosarcoidosis is well documented,4,10–12 there is a paucity of data to show concordance between imaging findings and clinical information, the expected evolution of imaging abnormalities with immunosuppressive therapy, and the possible prognostic significance of imaging features.8,13,14 In this study, we analyzed clinical and radiologic records of patients with biopsy-proved or clinically diagnosed neurosarcoidosis for the following reasons: 1) to assess the concordance between abnormalities noted on MR imaging with neurologic symptoms at presentation; 2) to correlate changes in imaging findings during follow-up with clinical improvement or worsening; and 3) to identify imaging features that may have prognostic significance.
Materials and Methods
The study was approved by the local institutional review board. We reviewed radiologic records from 1999 to 2008 at the University of Alabama at Birmingham to identify patients with the following: 1) CNS or extra-CNS biopsy-proved sarcoidosis with neurologic symptoms and abnormal brain and/or spine imaging studies and 2) clinically diagnosed neurosarcoidosis based on characteristic chest imaging or skin findings, abnormal CNS imaging studies, and subsequent clinical course and response to treatment.
The clinical, pathologic, and radiologic records of all patients were reviewed. A positive histology was defined as typical granulomas with epithelioid cells and macrophages with no central caseating necrosis, surrounded by lymphocytes, plasma cells, and mast cells, and exclusion of granulomatous infections and other granulomatous diseases. In all patients who did not have a CNS biopsy, causes other than sarcoidosis were excluded by clinical evaluation and CSF and laboratory testing. Specifically, all patients with leptomeningeal or cranial nerve enhancement had CSF analysis to exclude neoplastic, infectious, and other inflammatory etiologies for their imaging findings. Any patients in whom alternative diagnoses were found for neurologic symptoms on follow-up were excluded.
All MR imaging examinations were performed at field strengths of 1.5T. All brain MR imaging studies were performed with a standard protocol, which included at least a sagittal T1 spin-echo (SE), axial T1 and T2 fat-saturated SE, axial fluid-attenuated inversion recovery (FLAIR), and postgadolinium axial and coronal T1 SE sequences. Studies for the spinal cord included at least sagittal T1, T2, short τ inversion recovery, axial T1 and T2, and postgadolinium sagittal and axial T1 sequences. When available, the results of clinical and MR imaging examinations performed after treatment were compared with baseline data.
Intracranial lesions were classified as dural, leptomeningeal, enhancing and nonenhancing parenchymal lesions, and cranial nerve enhancement according to criteria described by Fukui et al.15 and Meltzer et al.16 Spinal lesions were classified as intramedullary or extramedullary. Lesions on the surface of the cord (pial lesions) and lesions within the substance of the cord were both included as “intramedullary” because in most cases, these either coexisted or the origin was difficult to distinguish.
We analyzed if lesion type (for example dural or cranial nerve involvement), location, or T2 signal-intensity characteristics were factors in predicting response to steroid therapy. We observed that enhancing lesions that were T2-hypointense relative to gray matter demonstrated a lesser tendency to resolve after steroid therapy. Therefore, we compared the demographic characteristics, clinical manifestations, and clinical response in patients who had ≥1 T2-hypointense lesion versus those who did not have T2-hypointense lesions. All except 2 patients had CT or direct biopsy of the lesions, excluding calcification as the cause for T2-hypointensity on MR imaging.
Data were analyzed by nonparametric statistical methods. We used the software package SigmaStat, Version 5.1 (Systat, San Jose, Calif). A P value of .05 was accepted as significant.
Results
We identified a total of 50 patients in whom the diagnosis of neurosarcoidosis was considered in the differential on the basis of suggestive radiologic findings or previous evidence of systemic extraneurologic sarcoidosis. After extensive review of the radiologic and clinical findings, 32 patients met the diagnostic criteria for neurosarcoidosis. We classified our patients according to the criteria of Zajicek et al12 with minor modifications as having “definite” (n = 15) (suggestive symptoms, positive findings on CNS biopsy), “probable” (n = 12) (suggestive symptoms, positive findings on extra-CNS biopsy, laboratory results of CNS inflammation, exclusion of other diseases), or “possible” (n = 5) neurosarcoidosis (suggestive symptoms, exclusion of other diseases, and response to immunosuppressive therapy).
We excluded 18 patients in whom neurosarcoidosis was considered in the initial differential diagnosis based on imaging features but who were eventually assigned alternative diagnoses that explained their neurologic symptoms. The final diagnoses of these patients are listed in Table 1. Three patients had biopsy evidence of extra-CNS sarcoidosis but were found to have a different etiology for their neurologic symptoms.
Table 1:
Final diagnoses of patients initially suspected of having neurosarcoidosis but found to have other conditions on biopsy or follow-up
| Diagnosis | No. |
|---|---|
| Fungal meningitis | 4 |
| Tuberculous meningitis | 2 |
| Wegener granulomatosis | 1 |
| Transverse myelitis | 1 |
| Vasculitis | 1 |
| Chronic inflammatory demyelinating polyneuropathy | 1 |
| Lymphoma | 3 |
| Acute disseminated encephalomyelitis | 1 |
| Meningeal fibrosis | 1 |
| Erdheim-Chester syndrome/polyostotic sclerosing histiocytosis | 1 |
| Glioma | 2 |
The clinical and radiologic characteristics of our 32 patients with neurosarcoidosis are presented in on-line Table 1 and are summarized below.
Demographic Characteristics.
The median age was 40 years with a range of 22–62 years. Eighteen (56%) of these patients were men and 14 (44%) were women. Classified by ethnicity, 26 (81%) were African American and 6 (19%) were white.
Clinical Presentation.
Nine of 32 (28%) had known systemic sarcoidosis at the time of presentation with neurologic symptoms (duration, 1–16 years). In the remaining 23 of 32 patients, the first symptoms of sarcoidosis were neurologic. Of these, 10 (43%) were discovered to have asymptomatic extra-CNS sarcoidosis in the form of adenopathy on work-up at initial presentation, whereas 7 (30%) developed extra-CNS sarcoidosis on follow-up. The presenting neurologic symptoms are summarized in Table 2; most patients had >1 neurologic symptom.
Table 2:
Clinical presentation of patients with neurosarcoidosis
| Presentation | No. (%) |
|---|---|
| Headache | 10 (31) |
| Visual impairment | 9 (28) |
| Seizures | 8 (25) |
| Diplopia | 5 (16) |
| Numbness or paresthesias | 4 (12) |
| Memory change | 3 (9) |
| Hypopituitarism | 3 (9) |
| Hearing impairment | 2 (4) |
| Dysphagia | 2 (4) |
| Muscle weakness | 2 (4) |
| Psychosis | 1 (2) |
| Movement disorder | 1 (2) |
| Increased intracranial pressure | 1 (2) |
| Altered sensorium | 1 (2) |
Radiologic Findings
Brain MR Imaging.
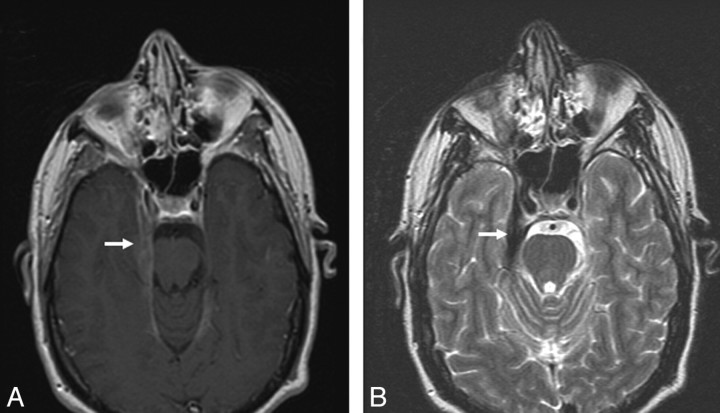
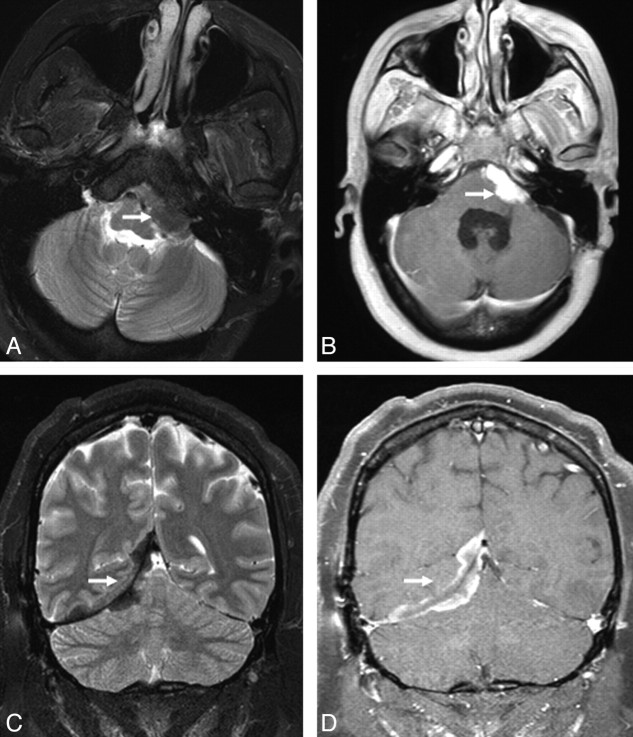
Dural involvement was seen in 11 (34%) patients, of whom 5 had enhancing dural masses. Four of 5 extraaxial masses in our series were in the posterior fossa, and 1 patient had multiple enhancing dural lesions in both supratentorial and infratentorial compartments. Four of the 5 extra-axial masses were T2-hypointense relative to gray matter, and 11 were isointense to gray matter. Some typical sarcoid dural lesions are shown in Figs 1 and 2.
Fig 1.
Dural involvement in sarcoidosis. A, Contrast-enhanced axial T1-weighted image shows focal dural thickening and enhancement involving the right tentorium (arrow). B, Axial T2-weighted image shows marked T2-hypointensity of dural thickening (arrow), characteristic of sarcoidosis.
Fig 2.
Extra-axial masses in sarcoidosis. A and B, Axial T2- and enhanced axial T1-weighted images demonstrate an enhancing T2-hypointense extra-axial mass in the left cerebellopontine angle cistern (arrow). C and D, Coronal T2 and enhanced coronal T1 images from a different patient show a T2-hypointense enhancing right tentorial mass (arrow). Noncontrast CT (not shown) did not demonstrate any calcification. Biopsy (not shown) revealed granulomatous inflammation.
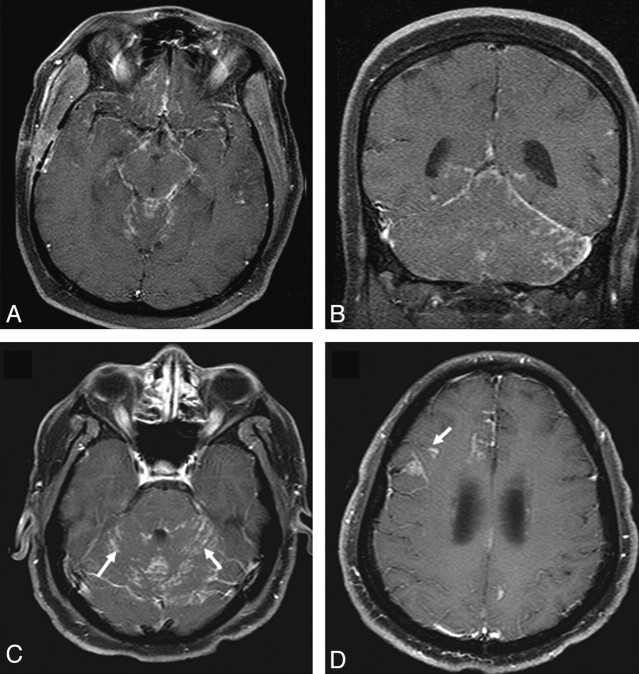
Leptomeningeal enhancement in brain was seen in 10 (31%) patients. Figure 3 shows leptomeningeal lesions from 2 patients. Concurrent leptomeningeal and dural involvement was seen in 3 patients. Communicating hydrocephalus was seen in 2 patients.
Fig 3.
Leptomeningeal involvement in sarcoidosis. A and B, Enhanced axial and coronal T1-weighted images demonstrate nodular leptomeningeal enhancement in the basilar cisterns and posterior fossa. C and D, Enhanced axial T1-weighted images in a different patient demonstrate nodular leptomeningeal enhancement along the cerebellar folia (arrows). Involvement of perivascular spaces is seen at a higher level in D (arrow).
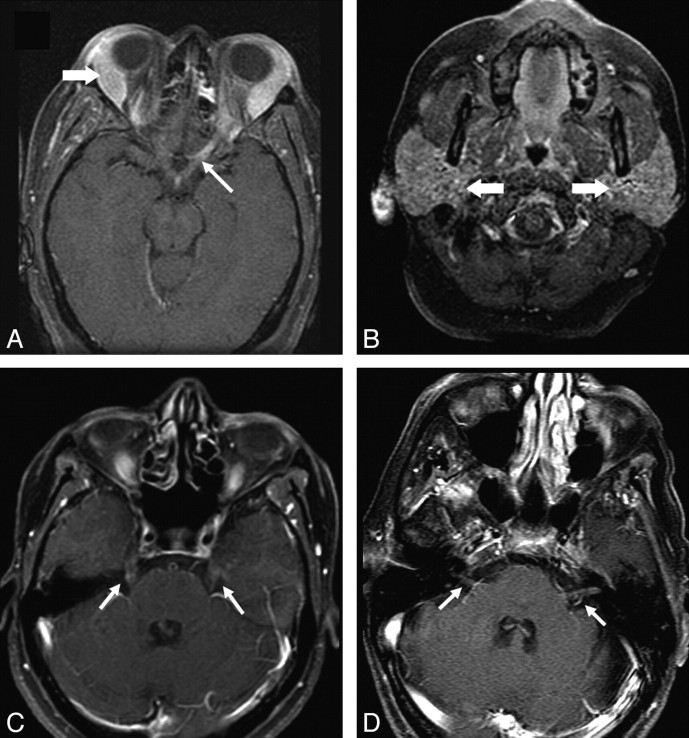
Cranial nerve enhancement was seen in 11 (34%) patients. The optic nerve was involved most commonly, with lesions in 9 patients of our series. Four of these patients had bilateral involvement. The trigeminal nerve was involved in 5 (4 bilateral), oculomotor in 4 (1 bilateral), facial and vestibulocochlear in 3 each (all bilateral), and abducens in 1 (bilateral). In 4 patients, cranial nerve involvement was associated with widespread leptomeningeal disease. Figure 4 shows sarcoid lesions of the optic, trigeminal, and facial-vestibulocochlear nerves.
Fig 4.
Cranial nerve enhancement in sarcoidosis. A and B, Axial fat-suppressed T1 images show enhancement of the left optic nerve (thin arrow). Lacrimal and parotid glands are enlarged (thick arrows in A and B, respectively). C, Bilateral trigeminal nerve enhancement is seen in a different patient (arrows). D, Enhancement of bilateral seventh-eighth nerve complexes is seen in another patient (arrows).
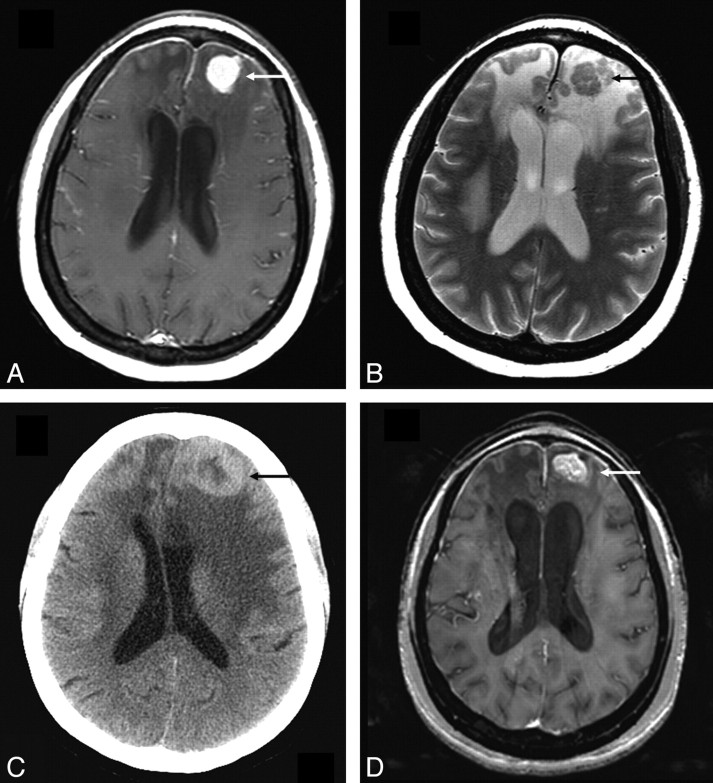
Enhancing parenchymal lesions were seen in 7 (22%) patients, of whom 5 also had evidence of concurrent leptomeningeal disease. Four of these 7 patients had the enhancing lesions in a randomly scattered distribution, whereas in 3, the enhancing lesions followed the expected distribution of perivascular spaces. In 4 of the 7 patients, the enhancing lesions were T2-hypointense relative to gray matter but were surrounded by T2-hyperintense vasogenic edema. One such lesion is illustrated in Fig 5. Nonenhancing T2/FLAIR hyperintense parenchymal lesions were seen in 4 (12.5%) patients.
Fig 5.
Parenchymal lesion in sarcoidosis. A and B, Enhanced axial T1- and T2-weighted images at presentation demonstrate an enhancing T2-hypointense left frontal mass (arrow). There is surrounding nonenhancing T2-hyperintensity due to vasogenic edema. Also note thin dural enhancement overlying both frontal lobes. C, Noncontrast CT scan obtained 1 year later shows worsening lesion size and edema (arrow). The patient had been on low-dose prednisone and was symptomatically stable. D, MR image obtained following high-dose prednisone therapy shows a decrease in edema but only partial resolution of the enhancing left frontal mass (arrow). There was no further decrease in size of the mass on serial scans during the next 2 years with the patient on immunosuppressive therapy.
Spinal MR Imaging.
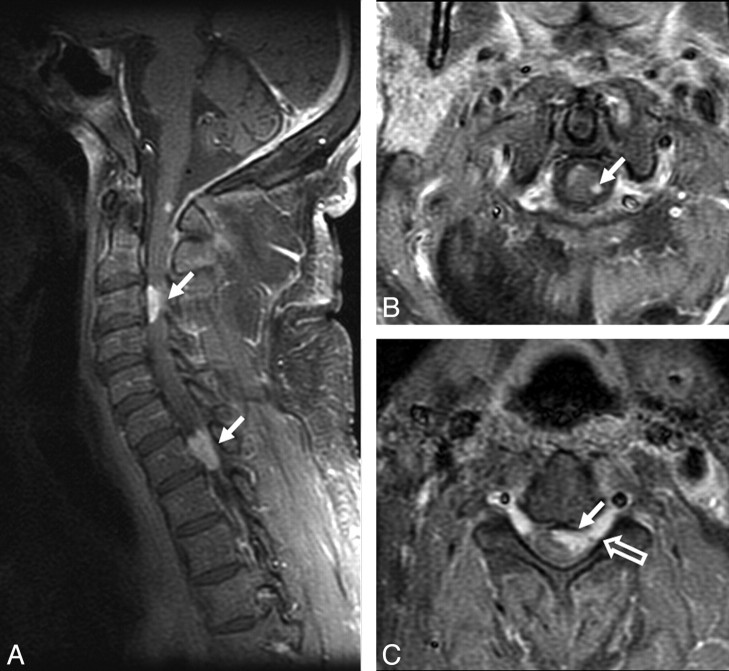
Spinal lesions were seen in 8 (25%) patients. A typical lesion is shown in Fig 6. Four patients had enhancing intramedullary lesions (solitary in 2 and multiple in 2), 2 patients had enhancing extramedullary lesions, and 2 patients had cauda equina enhancement. Unlike in the brain, all enhancing intramedullary cord lesions were T2-hyperintense relative to cord. Fifty percent of patients with spinal lesions had concomitant intracranial lesions.
Fig 6.
Spinal cord involvement in sarcoidosis. A−C, Enhanced parasagittal and axial T1-weighted images of the cervical cord show multiple enhancing parenchymal nodules (arrows). The peripheral distribution of these nodules, which are abutting the surface of the cord, suggests a leptomeningeal origin of these nodules. Note enhancement extending along the nerve roots (open arrow, C).
One patient had nonenhancing foci of T2-hyperintensity in the cord, in addition to 1 enhancing focus. One patient had multiple enhancing vertebral lesions (patient 23 in on-line Table 1), which responded rapidly to prednisone therapy.
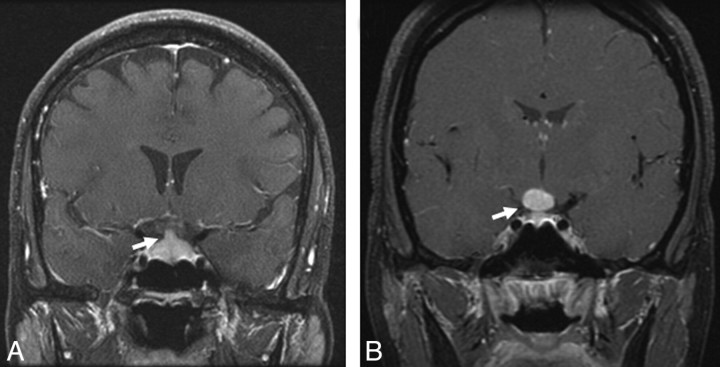
Infundibular thickening and enhancement were seen in 3 patients (9%). Pituitary or hypothalamic masses were recorded in 3 (9%) other patients, of whom 2 had a well-defined sellar mass and 1 had an ill-defined sellar-suprasellar enhancement (Fig 7).
Fig 7.
Sellar-suprasellar involvement in sarcoidosis. A, Enhanced coronal T1-weighted image shows an enlarged and enhancing pituitary infundibulum (arrow). This patient also had multiple enhancing parenchymal nodules in a perivascular distribution. B, Enhanced coronal T1-weighted image from a different patient shows a homogeneously enhancing infundibular and hypothalamic mass (arrow).
Three patients had orbital masses (9%). One patient presented with a subacute infarct. A second patient with other MR imaging abnormalities from neurosarcoidosis developed bilateral cerebellar (posterior inferior cerebellar artery) infarcts, though no vascular abnormalities were detected on MR imaging.
Correlation of Demographic Characteristics and MR Imaging Findings.
Patients with dural, leptomeningeal, parenchymal, or spinal cord lesions did not have age, sex, and ethnic differences from patients who did not have such lesions. In contrast, patients with cranial nerve involvement were older (median, 45 years; range, 35–62 years) than patients who did not have cranial nerve disease (median, 36 years; range, 22–55 years; P < .05). Ten of 11 (90%) patients with cranial nerve involvement were African American. Among patients who did not have cranial nerve disease, 16 of 21 (76%) were African American. There was a trend toward a higher frequency of cranial nerve disease in female (8 women of 11 [72%]) patients compared with 6 of 15 or 40% of women among those without cranial nerve enhancement (data statistically not significant).
Correlation of MR Imaging Findings and Symptoms.
The frequency of various symptoms associated with radiologic features is summarized in Table 3. Nonenhancing white matter (100%), dural (72%), and spinal lesions (62%) were the least likely to correlate with symptoms. Conversely, patients presenting with dysphagia, hearing loss, movement disorder, and memory loss did not have correlating imaging abnormalities.
Table 3:
Frequency of symptoms with various MR imaging findings
| Finding/Symptom | No. |
|---|---|
| Dural disease | |
| Headache | 2/11 |
| Visual impairment | 1/11 |
| Symptoms not explained by imaging findings | 8/11 |
| Cranial nerve involvement | |
| Visual impairment | 6/11 |
| Diplopia | 1/11 |
| Symptoms not explained by imaging findings | 4/11 |
| Leptomeningeal disease | |
| Headache | 4/10 |
| Seizures | 2/10 |
| Symptoms not explained by imaging findings | 4/10 |
| Enhancing parenchymal lesions | |
| Altered sensorium | 1/7 |
| Seizures | 3/7 |
| Memory changes | 1/7 |
| Symptoms not explained by imaging findings | 2/7 |
| Spinal lesions | |
| Motor and/or sensory symptoms | 3/8 |
| Symptoms not explained by imaging findings | 5/8 |
| Pituitary lesions | |
| Endocrine insufficiency | 3/3 |
We were able to correlate clinical response to immunosuppressive therapy (prednisone and/or methotrexate) with the imaging response in 20 of 32 patients. The remaining patients were either treated symptomatically (eg, hormone replacement for hypopituitarism, shunt surgery for hydrocephalus) or had irreversible damage (infarcts, cord lesion that had been resected) so that clinical-versus-imaging correlation was not possible. Sixteen of 20 patients had positive correlation between symptomatic change versus imaging change (ie, symptomatic improvement was accompanied by improvement in imaging and vice versa). In 4 patients, the imaging abnormalities remained unchanged or worsened, even when the symptoms improved with prednisone therapy; 3 of these patients had enhancing parenchymal lesions and 1 had multiple small enhancing dural lesions.
Changes in MR Imaging Findings during Follow-Up.
Twenty-nine of our 32 patients had follow-up scans available for review. The other 3 patients had clinical follow-up only. One patient with an infarct and another who underwent an excisional biopsy of his cord lesion were excluded from analysis of follow-up imaging because of irreversible imaging abnormalities.
A total of 100 MR images were available with an average of 3.3 follow-up scans per patient (range, 1–22 scans), with a median follow-up of 12 months (range, 0–45 years). In the 27 patients in whom we were able to assess the response to prednisone therapy, 14 showed complete or near-complete resolution of their imaging abnormalities. The imaging responses are summarized by the type of lesion in Table 4.
Table 4:
Changes in MR imaging findings on follow-up
| Finding | Complete or Near-Complete Resolution | Stable or Minimal Improvement | Worsened | Could Not Be Assessed | Total |
|---|---|---|---|---|---|
| Dural | 6 | 5 | 0 | 0 | 11 |
| Leptomeningeal | 6 | 1 | 1 | 2 | 10 |
| Cranial nerve | 9 | 1 | 0 | 1 | 11 |
| Enhancing parenchymal | 3 | 3 | 1 | 0 | 7 |
| Nonenhancing white matter | 0 | 4 | 0 | 0 | 4 |
| Sellar-suprasellar-infundibular | 4 | 2 | 0 | 0 | 6 |
| Spinal | 5 | 1 | 0 | 2 | 8 |
In our cohort, among the 13 patients who showed minimal improvement in their imaging abnormalities on immunosuppressive therapy, 9 had enhancing dural or parenchymal lesions that were T2-hypointense relative to gray matter. One of these patients is illustrated in Fig 5. Therefore, we performed a subanalysis to determine whether T2-hypointense lesions were less likely to improve than other imaging abnormalities. Thirteen of 27 patients who had follow-up data had ≥1 enhancing lesion that was T2-hypointense relative to gray matter. Only 4 of these 13 (31%) patients with enhancing T2-hypointense lesions showed significant improvement during follow-up compared with 10 of 14 (72%) patients who did not have such lesions (P = .05). In terms of clinical improvement with immunosuppressive therapy (after excluding patients who received only symptomatic treatment), 4 of 7 (57%) patients with T2-hypointense lesions reported significant relief in their symptoms versus 12 of 13 (92%) patients without such lesions.
We also tried to assess whether there were any demographic or clinical differences in patients who had enhancing T2-hypointense lesions compared with those who did not. We found that patients with T2-hypointense lesions were younger (median, 37 years; range, 27–45 years versus median, 45 years; range, 23–62 years; P = .046). There were no significant differences in the 2 groups with respect to sex or ethnicity.
Four of the 13 patients with T2-hypointense lesions (30%) had evidence of extra-CNS sarcoidosis before onset of neurologic symptoms, and 3 more patients developed lung/nodal disease during follow-up. Among patients who did not have T2-hypointense lesions, 10 of 19 (53%) patients had prior extra-CNS disease (difference not statistically significant).
T2-hypointense lesions correlated with symptoms in 5 of 13 patients (38%), which contrasted with the presence of correlating symptoms in 15 of 19 patients in those without T2-hypointense lesions (79%, P < .05). Interestingly, 3 out of 4 patients who had discordance of their clinical-versus-imaging response had T2-hypointense enhancing parenchymal lesions.
Discussion
We present a retrospective correlative analysis of MR imaging and clinical manifestations in patients with neurosarcoidosis. Similar to previous reports by Zajicek et al12 and Christoforidis et al,14 most of our patients (23/32, 72%) presented with neurologic symptoms as the first manifestation of sarcoidosis. Although definitive conclusions cannot be drawn regarding the frequency of patients with sarcoidosis who first presented neurologically because of the sampling bias in our patient population, these data emphasize the importance of correctly recognizing neurosarcoidosis on the basis of imaging findings in the absence of a history of systemic sarcoidosis at the time of presentation.
The most common radiologic finding in our patients was dural involvement (34%), which is similar to that of Seltzer et al (7/14, 50%)11 and Christoforidis et al (8/28, 29%).14 Extra-axial sarcoid masses can mimic meningiomas and schwannomas, but the presence of noncontiguous dural enhancement may help in differentiating dural sarcoidosis from these tumors. A hypointense appearance on T2-weighted images may also be helpful in suggesting dural sarcoidosis, though T2-hypointensity is not specific for sarcoidosis and may also be seen in a variety of other conditions, such as calcified meningiomas, dural metastases, lymphomas, idiopathic hypertrophic cranial pachymeningitis, Wegener granulomatosis, and rheumatoid nodulosis.14,17 Four of 5 of our extra-axial masses were seen in the posterior fossa. Urbach et al18 have previously reported a posterior fossa mass, but other reported extra-axial masses were supratentorial.11,14,19
Cranial nerve involvement was seen in 11 of 32 (34%) patients. Cranial nerve lesions may be seen in ≤50% of patients with neurosarcoidosis,12,20,21 typically as an enlarged enhancing nerve trunk. In our patients, the optic nerve was the most commonly involved (9/32, 28% patients), followed by the trigeminal and the oculomotor nerves. The facial nerve was involved in only 2 patients, which contrasts with previous reports in which facial nerve involvement was recorded frequently due to entrapment in involved meninges or in parotid gland lesions.12,20
The frequency of leptomeningeal involvement in our study (10/32, 31%) is comparable with that in previous reports.4,14 Leptomeningeal sarcoidosis is usually seen as a thickening and enhancement of the leptomeninges and affects the suprasellar and frontal basal meninges most frequently. In some cases, leptomeningeal disease may spread along perivascular spaces resulting in intraparenchymal involvement. Imaging studies may not reliably differentiate sarcoid involvement of the basilar meninges from other granulomatous diseases such as tuberculosis, Wegener granulomatosis, fungal meningitis, lymphoma, and leptomeningeal carcinomatosis.
Enhancing parenchymal lesions, seen in 7 of 32 (22%) patients, are a relatively less common but important manifestation of neurosarcoidosis because these lesions can mimic neoplasms. These lesions represent parenchymal granulomas associated with small blood vessels.14,20 In our series, concurrent leptomeningeal involvement was seen in 5 of the 7 patients with parenchymal lesions. Six of these 7 patients had a multinodular enhancing parenchymal involvement, which extended along perivascular spaces in some instances. We did not see any nonenhancing masses or central necrosis; these findings were also not documented in previous series.8,14,18,22 We consider these features to be atypical for sarcoidosis and suggest careful clinical consideration for a biopsy, even in patients with known extra-CNS sarcoidosis.
Eight of our 32 (25%) patients had spine involvement. Sarcoidosis of the spinal cord usually appears as fusiform enlargements of the cord in the cervical or upper thoracic region, with increased signal intensity in T2-weighted images (unlike sarcoid lesions in other parts of the CNS), low signal intensity in T1-weighted images, and patchy enhancement after contrast administration. Sarcoid myelopathy may mimic multiple sclerosis, tumor, vacuolar myelopathy, tuberculosis, and fungal infections.14,20,23
Similar to findings in previous reports,13,14 we did not find any correlation between nonenhancing white matter lesions with clinical symptoms. These lesions also did not demonstrate any response to therapy and may also be seen in patients who do not have sarcoidosis. Dural, leptomeningeal, and cranial nerve abnormalities were also frequently not associated with correlating neurologic symptoms.
We report for the first time that findings on T2-weighted imaging may have important clinical and prognostic implications in neurosarcoidosis. In our cohort, the presence of ≥1 contrast-enhancing T2-hypointense lesion in a patient was associated with suboptimal imaging and clinical response to immunosuppressive therapy. Enhancing T2-hypointense dural and parenchymal lesions have been previously reported by Christoforidis et al.14 On analysis of data included in their report,14 we found that only 1 of their 6 patients with T2-hypointense enhancing lesions showed resolution of imaging abnormalities, which is similar to our observations.
The T2-hypointensity of sarcoid lesions has been previously correlated with fibrocollagenous/gliotic tissue, whereas T2-hyperintense lesions and enhancement are the imaging correlates of inflammation.14,24 This correlation of imaging findings and histopathologic data is consistent with our finding that T2-hypointense lesions, which likely represent a reparative tissue response, frequently do not have correlating neurologic symptoms and are less likely to respond to immunosuppressive therapy than other lesions. The occurrence of T2-hypointense lesions in some but not in other patients may possibly indicate the effect of host factors in the pathogenesis of neurosarcoidosis. Sarcoidosis is more common in African Americans, who are also frequently affected by fibroproliferative diseases, with an exaggerated tissue response to injury such as in keloid formation, nephrosclerosis, uterine fibroids, and scleroderma.25 The association of T2-hypointense lesions with fibroproliferative diseases and/or related genetic markers needs further investigation.
In conclusion, nonenhancing white matter lesions, dural disease, and cranial nerve enhancement frequently do not have correlating symptoms at the time of presentation. However, during follow-up, imaging changes show excellent correlation with clinical improvement or worsening on immunosuppressive therapy. Imaging abnormalities such as cranial nerve enhancement and spinal lesions are more likely to resolve with immunosuppressive therapy than others such as dural and parenchymal lesions. Enhancing T2-hypointense dural and parenchymal lesions may be associated with a suboptimal response to immunosuppressive therapy.
Footnotes
Paper previously presented as a scientific exhibit at: Annual Meeting of the American Society of Neuroradiology, May 3, 2006; San Diego, Calif.
indicates article with supplemental on-line table.
References
- 1.Statement on sarcoidosis: Joint Statement of the American Thoracic Society (ATS), the European Respiratory Society (ERS) and the World Association of Sarcoidosis and Other Granulomatous Disorders (WASOG) adopted by the ATS Board of Directors and by the ERS Executive Committee, February 1999. Am J Respir Crit Care Med 1999;160:736–55 [DOI] [PubMed] [Google Scholar]
- 2.Henke CE, Henke G, Elveback LR, et al. The epidemiology of sarcoidosis in Rochester, Minnesota: a population-based study of incidence and survival. Am J Epidemiol 1986;123:840–45 [DOI] [PubMed] [Google Scholar]
- 3.Rybicki BA, Major M, Popovich J Jr, et al. Racial differences in sarcoidosis incidence: a 5-year study in a health maintenance organization. Am J Epidemiol 1997;145:234–41 [DOI] [PubMed] [Google Scholar]
- 4.Pickuth D, Spielmann RP, Heywang-Kobrunner SH. Role of radiology in the diagnosis of neurosarcoidosis. Eur Radiol 2000;10:941–44 [DOI] [PubMed] [Google Scholar]
- 5.Siltzbach LE, James DG, Neville E, et al. Course and prognosis of sarcoidosis around the world. Am J Med 1974;57:847–52 [DOI] [PubMed] [Google Scholar]
- 6.Stern BJ, Krumholz A, Johns C, et al. Sarcoidosis and its neurological manifestations. Arch Neurol 1985;42:909–17 [DOI] [PubMed] [Google Scholar]
- 7.Stern BJ, Krumholz A, Johns CJ. Neurosarcoidosis: presentation and management. Ann N Y Acad Sci 1986;465:722–30 [DOI] [PubMed] [Google Scholar]
- 8.Lexa FJ, Grossman RI. MR of sarcoidosis in the head and spine: spectrum of manifestations and radiographic response to steroid therapy. AJNR Am J Neuroradiol 1994;15:973–82 [PMC free article] [PubMed] [Google Scholar]
- 9.Smith JK, Matheus MG, Castillo M. Imaging manifestations of neurosarcoidosis. AJR Am J Roentgenol 2004;182:289–95 [DOI] [PubMed] [Google Scholar]
- 10.Fels C, Riegel A, Javaheripour-Otto K, et al Neurosarcoidosis: findings in MRI. Clin Imaging 2004;28:166–69 [DOI] [PubMed] [Google Scholar]
- 11.Seltzer S, Mark AS, Atlas SW. CNS sarcoidosis: evaluation with contrast-enhanced MR imaging. AJNR Am J Neuroradiol 1991;12:1227–33 [PMC free article] [PubMed] [Google Scholar]
- 12.Zajicek JP, Scolding NJ, Foster O, et al. Central nervous system sarcoidosis: diagnosis and management. QJM 1999;92:103–17 [DOI] [PubMed] [Google Scholar]
- 13.Dumas JL, Valeyre D, Chapelon-Abric C, et al. Central nervous system sarcoidosis: follow-up at MR imaging during steroid therapy. Radiology 2000;214:411–20 [DOI] [PubMed] [Google Scholar]
- 14.Christoforidis GA, Spickler EM, Recio MV, et al. MR of CNS sarcoidosis: correlation of imaging features to clinical symptoms and response to treatment. AJNR Am J Neuroradiol 1999;20:655–69 [PMC free article] [PubMed] [Google Scholar]
- 15.Fukui MB, Meltzer CC, Kanal E, et al. MR imaging of the meninges. Part II. Neoplastic disease. Radiology 1996;201:605–12 [DOI] [PubMed] [Google Scholar]
- 16.Meltzer CC, Fukui MB, Kanal E, et al. MR imaging of the meninges. Part I. Normal anatomic features and nonneoplastic disease. Radiology 1996;201:297–308 [DOI] [PubMed] [Google Scholar]
- 17.Elster AD, Challa VR, Gilbert TH, et al. Meningiomas: MR and histopathologic features. Radiology 1989;170:857–62 [DOI] [PubMed] [Google Scholar]
- 18.Urbach H, Kristof R, Zentner J, et al. Sarcoidosis presenting as an intra- or extra-axial cranial mass: report of two cases. Neuroradiology 1997;39:516–19 [DOI] [PubMed] [Google Scholar]
- 19.Pickuth D, Heywang-Kobrunner SH. Neurosarcoidosis: evaluation with MRI. J Neuroradiol 2000;27:185–88 [PubMed] [Google Scholar]
- 20.Nowak DA, Widenka DC. Neurosarcoidosis: a review of its intracranial manifestation. J Neurol 2001;248:363–72 [DOI] [PubMed] [Google Scholar]
- 21.Delaney P. Neurologic manifestations in sarcoidosis: review of the literature, with a report of 23 cases. Ann Intern Med 1977;87:336–45 [DOI] [PubMed] [Google Scholar]
- 22.Williams DW 3rd, Elster AD, Kramer SI. Neurosarcoidosis: gadolinium-enhanced MR imaging. J Comput Assist Tomogr 1990;14:704–07 [PubMed] [Google Scholar]
- 23.Junger SS, Stern BJ, Levine SR, et al. Intramedullary spinal sarcoidosis: clinical and magnetic resonance imaging characteristics. Neurology 1993;43:333–37 [DOI] [PubMed] [Google Scholar]
- 24.Wilson JD, Castillo M, Van Tassel P. MRI features of intracranial sarcoidosis mimicking meningiomas. Clin Imaging 1994;18:184–88 [DOI] [PubMed] [Google Scholar]
- 25.Smith JC, Boone BE, Opalenik SR, et al. Gene profiling of keloid fibroblasts shows altered expression in multiple fibrosis-associated pathways. J Invest Dermatol 2008;128:1298–310 [DOI] [PMC free article] [PubMed] [Google Scholar]


