Abstract
BACKGROUND AND PURPOSE: Moyamoya disease is an idiopathic occlusive cerebrovascular disorder with abnormal microvascular proliferation. We investigated the clinical utility of leptomeningeal high signal intensity (ivy sign) sometimes seen on fluid-attenuated inversion recovery images in Moyamoya disease.
MATERIALS AND METHODS: We examined the relationship between the degree of the ivy sign and the severity of the ischemic symptoms in 96 hemispheres of 48 patients with Moyamoya disease. We classified each cerebral hemisphere into 4 regions from anterior to posterior. In 192 regions of 24 patients, we examined the relationship between the degree of the ivy sign and findings of single-photon emission CT, including the resting cerebral blood flow (CBF) and cerebral vascular reserve (CVR).
RESULTS: The degree of the ivy sign showed a significant positive relationship with the severity of the ischemic symptoms (P < .001). Of the 4 regions, the ivy sign was most frequently and prominently seen in the anterior part of the middle cerebral artery region. The degree of the ivy sign showed a negative relationship with the resting CBF (P < .0034) and a more prominent negative relationship with the CVR (P < .001).
CONCLUSIONS: The leptomeningeal ivy sign indicates decreased CVR in Moyamoya disease.
Moyamoya disease is an idiopathic cerebrovascular disorder characterized by bilateral steno-occlusive changes at or around the terminal part of the internal carotid arteries with abnormal vessel proliferation called “moyamoya” at the base of the brain.1
Leptomeningeal high signal intensity has sometimes been reported on unenhanced fluid-attenuated inversion recovery (FLAIR) MR imaging along the cerebral sulci or on the brain surface in this disease, which has been called the “ivy sign.”2
A recent study found that the ivy sign was more prominent in the hemispheres with poorer visualization of the cortical branches of the middle cerebral artery (MCA) on MR angiography.3 In addition, in our experience, a greater prominence of the ivy sign indicates more severe ischemic symptoms, which were found to decrease on follow-up MR images after effective revascularization surgery.
These findings prompted us to speculate that the degree of the ivy sign might be correlated with the severity of the ischemia. Therefore, to analyze the significance of the ivy sign as an indicator of ischemia, we recruited patients with focal ischemic symptoms. We then retrospectively examined the relationship between the degree of the ivy sign and the severity of the ischemic symptoms and compared it with the findings of single-photon emission CT (SPECT).
Materials and Methods
Patients
Between September 2003 and June 2007, 61 consecutive patients were diagnosed with Moyamoya disease according to the criteria of the Research Committee on Spontaneous Occlusion of the Circle of Willis (Moyamoya Disease) of the Ministry of Health and Welfare, Japan.4 Of these patients, 11 with intracranial hemorrhage on CT at the onset of clinical symptoms and 2 with headache or dizziness alone were excluded. The remaining 48 patients with focal ischemic symptoms attributable to 1 cerebral hemisphere (14 males and 34 females ranging from 2 to 64 years of age, mean age 33 years) were included in this retrospective review.
Imaging Examinations
MR imaging was performed in these patients by using a 1.5T (n = 32; Signa Horizon LX CVi; GE Healthcare, Milwaukee, Wis) or 1T (n = 16; Signa Horizon LX; GE Healthcare) scanner. The MR imaging protocol included axial T1- and T2-weighted imaging, axial diffusion-weighted imaging, axial unenhanced FLAIR imaging, and 3D time-of-flight MR angiography. The FLAIR imaging was performed by using a fast inversion recovery sequence with TR, 9002 and 9002 ms; TEeff, 120 and 117 ms; TI, 2200 and 2100 ms; section thicknesses, 5.9 and 6.9 mm; section gap, 1.0 and 1.0 mm; matrix, 320 × 224 and 320 × 192 on the 1.5 and 1T scanners, respectively.
Of 48 patients studied with iodine 123 N-isopropyl-p-iodoamphetamine (123I-IMP)-SPECT, 18 had qualitative SPECT only, whereas the other 30 underwent quantitative SPECT by using a table look-up method (resting SPECT).5,6 A SPECT scanner (SPECT 2000H; Hitachi Medical, Tokyo, Japan) with a 4-head rotating gamma camera was used for all SPECT studies. In 24 of the aforementioned 30 patients, 123I-IMP-SPECT with an acetazolamide injection (ACZ-SPECT) followed at an interval of 2–7 days. This means that ACZ-SPECT was not performed in the remaining 6 patients at all because the ACZ injection might have worsened the ischemic symptoms in 3 patients who experienced a completed stroke (CS) within 1 month. Two patients had frequent transient ischemic attacks (TIAs), and machine failure precluded performing the examination in the remaining patient.
The 123I-IMP (111 MBq, 3 mCi) was injected intravenously from the antecubital vein. After 10 minutes, 1 arterial blood sample was taken to calibrate the previously determined standard input function, and the radioactivity concentration in whole blood was counted by using a well counter that was cross-calibrated to the SPECT scanner. A single SPECT scan was obtained at a midscan time of 30 minutes after 123I-IMP administration. In the 2-compartment analysis of 123I-IMP, the distribution volume, which is the ratio of the influx constant to the efflux constant, could be set between 40 and 45 mL. The cerebral blood flow (CBF) was calculated pixel by pixel (128 × 128 matrix) on the basis of single-SPECT data and a standard input function was calibrated by using a 1-point arterial blood sample. By administering ACZ (1000 mg/individual intravenously) 10 minutes before the 123I-IMP infusion, ACZ-activated CBF (ACZ-CBF) maps were also obtained.
Imaging Analysis
Ivy Sign Scores on FLAIR Images.
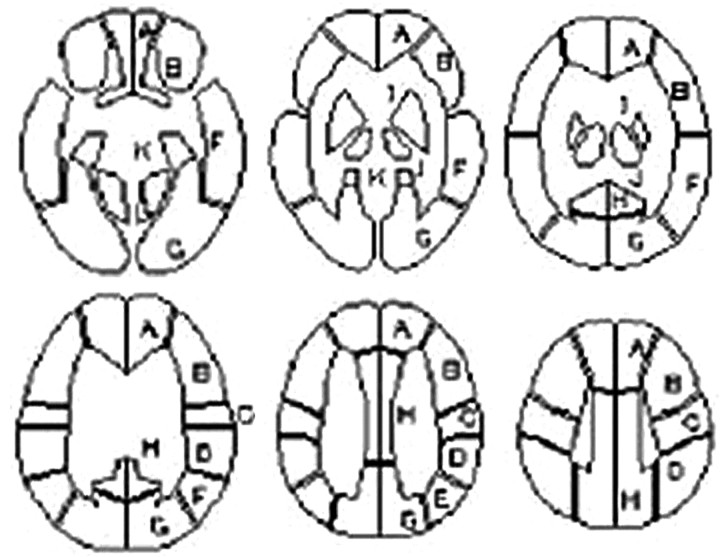
The ivy sign on FLAIR images was defined as a linear high signal intensity along the cortical sulci or brain surface in the cerebral hemisphere. The corticosubcortical region of each cerebral hemisphere was divided into the following 4 regions adapted from a previous report (Fig 1)7: the region of the anterior cerebral artery (ACA), the anterior half of the MCA region (ant-MCA), the posterior half of the MCA region (post-MCA), and the region of the posterior cerebral artery (PCA). The ant-MCA and post-MCA regions were separated by the central sulcus, with the temporal lobe belonging to the post-MCA. The degree of the ivy sign (ivy sign score) in each region was classified into 3 grades (0–2), where grade zero indicated an absence of the ivy sign, grade 1 indicated that the ivy sign was seen on less than half of the cortical surface in each region, and grade 2 indicated that the ivy sign was seen on more than half of the cortical surface. The ivy sign was scored subjectively by reviewing all the FLAIR images traversing all the cerebral hemispheres.
Fig 1.
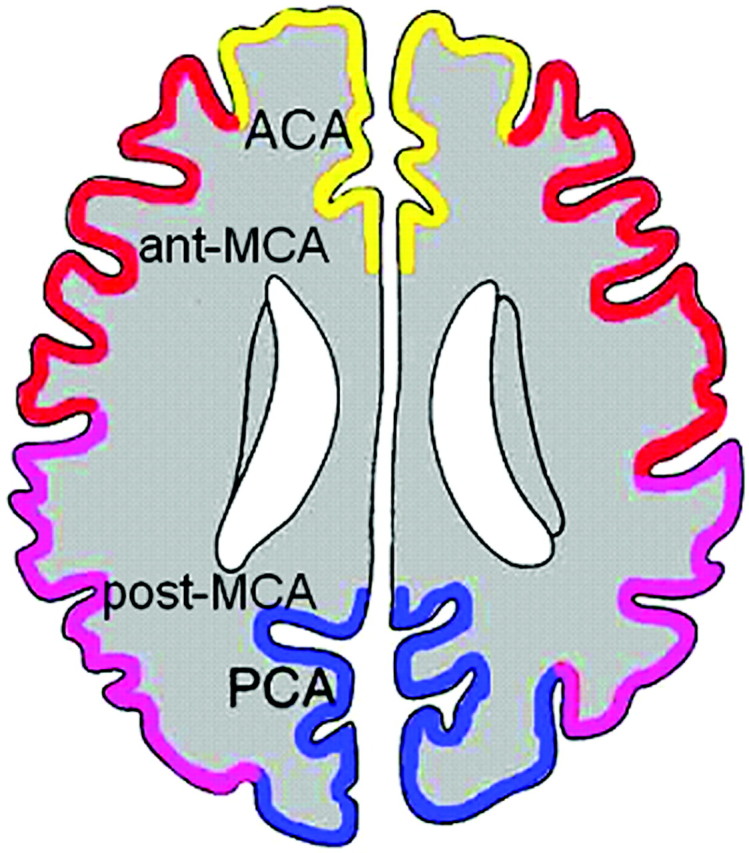
Classification of 4 corticosubcortical regions in each cerebral hemisphere at the level of the body of the lateral ventricle: the region of the ACA, the ant-MCA, the post-MCA, and the PCA.
The scoring immediately along the infarcted cortices was considered uninterpretable. Therefore, in 9 regions harboring foci of cortical infarcts, the sign over the remaining uninvolved part was estimated and recorded as the score for those regions. Conversely, in 6 regions with white matter infarcts, the ivy sign over the cortex was graded irrespective of the infarct as long as its overlying cortex was spared. The scores for each region were summed in each hemisphere and are defined as the ivy sign score for that individual hemisphere.
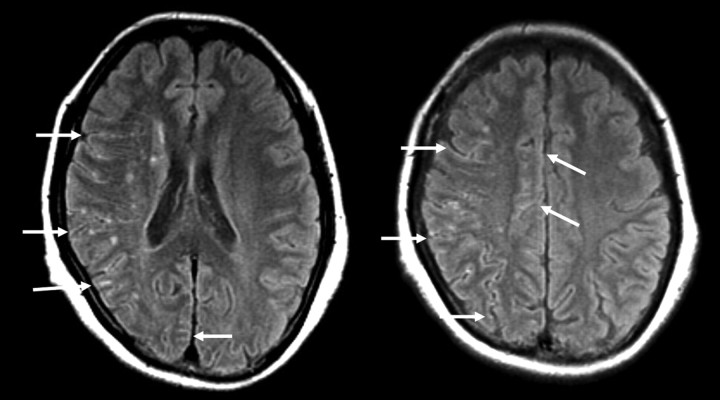
Two neuroradiologists (with 7 and 15 years of experience) reviewed the ivy sign independently without knowledge of the clinical information or SPECT findings. Initial interobserver agreement was 87% in interpreting FLAIR images. When the initial interpretation differed between the 2 raters, the final interpretation was reached by consensus. A case illustrating the grading of the ivy sign is shown in Fig 2.
Fig 2.
A 47-year-old woman with frequent transient left upper and lower motor weakness. Arrows indicate the ivy sign. The ivy sign score of the right side is 1 in the ACA and PCA regions, respectively, and 2 in the ant-MCA and post-MCA regions, respectively. No ivy sign is seen on the left side. The ivy sign score in individual hemispheres is 6 on the right side and zero on the left side.
Types of Hemisphere According to Ischemic Symptoms.
We classified the 96 cerebral hemispheres of the 48 patients into 4 grades of focal ischemic symptoms according to the Research Committee on Spontaneous Occlusion of the Circle of Willis (Moyamoya Disease) of the Ministry of Health and Welfare, Japan4: asymptomatic (AS), TIA, frequent TIAs, and CS. Accordingly, the respective hemispheres were called AS, TIA, frequent TIAs, and CS.
Focal ischemic symptoms lasting <24 hours were defined as a TIA, whereas TIAs more than twice a month were defined as frequent TIAs and focal symptoms for >24 hours were CS.
Quantification of Regional CBF and Cerebral Vascular Reserve.
We quantified the CBF without activation (resting CBF) and ACZ-CBF. Next, the cerebral vascular reserve (CVR), which is defined as the percentage difference between the ACZ-CBF and the resting CBF compared with the resting CBF, was calculated as follows8–10:
 |
The resting CBF and ACZ-CBF were converted by using fully automated region-of-interest−based analysis software called a 3D stereotactic region of interest template (3D-SRT). 3D-SRT is software that was designed to perform region-of-interest analysis of the brain by using anatomic standardization. This method allows region-of-interest analysis of the brain with improved objectivity and excellent reproducibility.11,12 The 3D-SRT software obtains the regional CBF in the corticosubcortical regions of each cerebral hemisphere (SRT-CBF) for the 8 regions of interest for which the respective volumes are known (regions of interest A−H, Fig 3).
Fig 3.
The template of constant regions of interest for the 3D-SRT. A representative 6 sections of the template are shown: A, callosomarginal; B, precentral; C, central; D, parietal; E, angular; F, temporal; G, posterior cerebral; H, pericallosal; I, basal ganglia; J, thalamus; K, hippocampus; L, cerebellum. Adapted from Takeuchi R et al.11
To match our study design, we recalculated both the resting CBF and ACZ-CBF for the 4 regions (ACA, ant-MCA, post-MCA, and PCA). In our study, these were represented by region of interest A, region of interest B + region of interest C, region of interest D + region of interest E + region of interest F, and region of interest G + region of interest H, respectively. In this recalculation, region of interest H, which might partially include the ACA region, was regarded as within the PCA region.
At this recalculation, the correction was made proportional to the volume of each region of interest within a certain region, as follows:
 |
where VB is the volume of region of interest B and VC is the volume of region of interest C.
Four regions of interest (in 3 patients), which contained cortical infarctions on MR imaging, were excluded from this summation, though the regions of interest with white matter infarcts alone were not excluded.
Statistical Analysis
We examined the relationship between the ivy sign score of individual hemispheres and the types of hemispheric symptom. Finally, we examined the relationship between the ivy sign score with the resting CBF and CVR on SPECT in a total of 192 regions of 24 patients. For statistical analysis, the Spearman rank correlation coefficient was determined by using the software package JMP 4J (SAS Institute, Tokyo, Japan), with P < .05 considered statistically significant.
Results
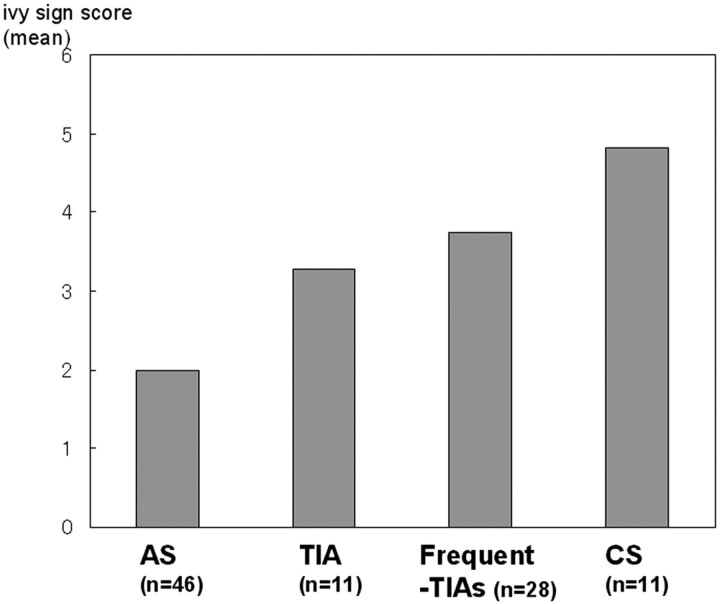
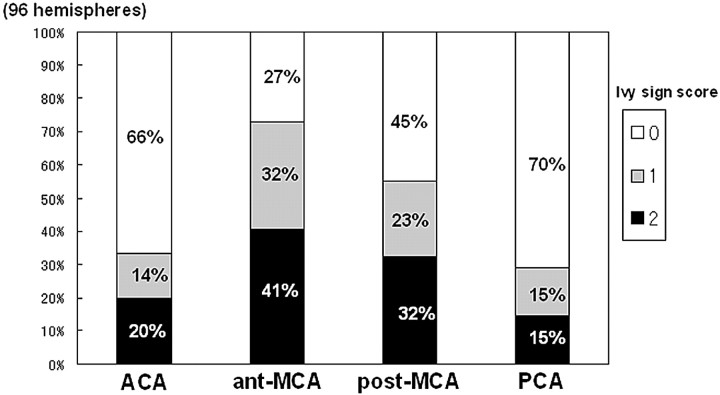
The ivy sign scores showed a significant positive correlation with the grade of the clinical type of hemispheric symptom (eg, AS, TIA, frequent TIA, CS) (Fig 4, P < .001). The score increased as the clinical symptoms became more severe (ie, from AS to CS). The ivy sign score according to the 4 corticosubcortical regions is shown in Fig 5. Both the frequency of positive ivy signs and its score were highest in the ant-MCA region, from which they decreased significantly going posteriorly toward the PCA region (P < .001).
Fig 4.
Bar graph shows the ivy sign score of each type of hemispheric symptom. The ivy sign scores show significant positive correlation with the grades of clinical types of hemispheric symptoms (P < .001).
Fig 5.
Bar graph shows the ivy sign score according to 4 cortico-subcortical regions, each color indicating a different grade. Each color represents the percentage of the score in the hemisphere compared with all 96 hemispheres for each ivy sign score. The number along the each color represents the score.
Regarding the relationship between the ivy sign scores and the SPECT findings, the resting CBF decreased significantly, though slightly, as the ivy sign score increased (Table, P = .0034) (Fig 6). A more obvious negative correlation was found between the score and the CVR (Table, P < .001) (Fig 6): a higher ivy sign score signified a correspondingly lower CVR.
The relationship between the ivy sign score and SPECT findings*
| Ivy Sign Score (No. of Regions) | Resting CBF (mL/100 g/min), Median (25th Percentile, 75th Percentile) | CVR (%), Median (25th Percentile, 75th Percentile) |
|---|---|---|
| 0 (115) | 33.3 (30.4, 37.2) | 9.1 (1.8, 30.1) |
| 1 (37) | 32.4 (28.6, 35.0) | 4.3 (−5.7, 21.5) |
| 2 (40) | 31.6 (28.2, 33.6) | −0.2 (−7.4, 5.3) |
Note:—SPECT indicates single-photon emission CT; CBE, cerebral blood flow; CVR, cerebral vascular reserve.
As the ivy sign score increased, the median value of the resting CBF decreased slightly (P = .0034). On the other hand, as the ivy sign score increased, the median value of the CVR decreased more obviously (P < .001).
Fig 6.
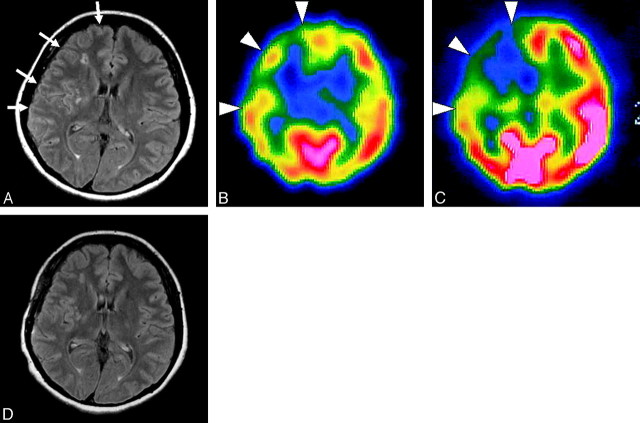
A 47-year-old woman with minor CSs with left motor weakness and sensory disturbance. The type of hemisphere was CS on the right side and AS on the left side. A, Axial FLAIR image shows the ivy sign over the right hemisphere (arrows). The ivy sign score is 2 in the ACA, ant-MCA, and post-MCA regions, respectively, and zero in PCA region on the right side. There is no ivy sign on the left. The ivy sign score in the individual hemispheres is 6 on the right side and zero on the left side. B, In resting SPECT, CBF is reduced in the ACA, ant-MCA, and post-MCA regions on the right side (arrowheads). C, In ACZ-SPECT, CBF in the left hemisphere is markedly elevated, whereas in the right hemisphere it is not and shows relative depression in the ACA, ant-MCA, and post-MCA regions, which indicates the decreased CVR in the right side (arrowheads). The calculated CVR (%) is 13.7, 8.7, 12.4, and 57.4 from the ACA, ant-MCA, post-MCA, and PCA regions, respectively on the right, whereas it is 46.5, 51.3, 72.1, and 73.9, respectively, on the left. The CVR is relatively preserved in the right PCA region and in all 4 regions on the left side. Note that the areas with decreased CVR correspond to the regions with a prominent ivy sign on the FLAIR image (A). D, Axial FLAIR image obtained at 3 months after revascularization surgery, when her symptoms were alleviated, shows almost complete disappearance of the ivy sign, which was noted over the right hemisphere.
Discussion
Diffuse leptomeningeal enhancement in contrast-enhanced T1-weighted images in patients with Moyamoya disease was first reported by Ohta et al.13 The pattern of contrast enhancement resembled ivy creeping on stones and was named the ivy sign. Subsequently, similar leptomeningeal high signal intensity was reported on unenhanced FLAIR images and was also referred to as the ivy sign.2,14
In this study, we evaluated the ivy sign on FLAIR images in patients with focal ischemic symptoms and found a significant positive correlation between the severity of these symptoms and the degree of the ivy sign. Furthermore, the ivy sign was found to indicate decreased CVR in Moyamoya disease noninvasively. This decrease in CVR may be related to the presenting ischemic symptoms, the severity of which was found to be correlated with the degree of the ivy sign. Regarding the distribution of the ivy sign, the high prevalence in the ant-MCA region was consistent with previous SPECT studies reporting that the CVR in the ant-MCA region tended to be most severely decreased.8–10 In contrast, the CVR was relatively preserved in the ACA region and posterior part of the cerebral hemisphere. This might be explained by the frequent development of transdural collaterals from the ophthalmic artery7,15,16 and leptomeningeal collaterals from the less involved PCA.7,17,18
In general, the CVR is measured by using ACZ, a cerebral vasculature dilator. In normal areas, its vasodilatory capacity is preserved and the CBF increases with ACZ activation. In contrast, in steno-occlusive vascular disease, the cerebral vasculature in the area with decreased perfusion pressure is already dilated to maintain CBF. Therefore, the CBF does not increase further with ACZ activation (ie, areas with reduced CVR are susceptible to a further decrease in perfusion pressure). In fact, recent studies have shown that the CVR is a reliable predictor of subsequent ischemic stroke; thus, an evaluation of the CVR should be important for considering the therapeutic strategy for ischemic disease, including surgical intervention.19 Indeed, in Moyamoya disease, the CVR is usually measured to determine whether revascularization surgery is necessary and which cerebral hemisphere should undergo surgery initially.8,20,21
However, any measurement of CVR requires 2 SPECT evaluations, including resting and ACZ activation studies, which may be burdensome to patients, and ACZ activation may cause side effects such as headache and a feeling of discomfort.19,22 Especially in patients with a very severe decrease in CVR, the administration of ACZ sometimes causes a further reduction in CBF due to the vascular steal phenomenon to the adjacent area with relatively preserved CVR.19,22 Therefore, ACZ should be administered cautiously in patients with severe ischemic symptoms. Indeed, in 5 of the 30 patients in our study, ACZ activation was not performed for fear of worsening their ischemic symptoms via the steal phenomenon. In such cases, observation of the ivy sign on FLAIR images may help to assess the CVR noninvasively in Moyamoya disease. Of course, we do not mean to imply that quantitative SPECT is totally replaceable by evaluating the ivy sign, which is subjective. However, it would be beneficial if the CVR could be predicted from routine MR imaging sequences.
As for the mechanism leading to the development of the ivy sign, previous reports speculated that this sign was likely to reflect slow retrograde flow of engorged pial collateral arteries via leptomeningeal anastomosis,2 an opinion with which we do not completely agree. In general, the leptomeningeal collaterals are developed among the distal cortical branches of the ACA, MCA, and PCA. In Moyamoya disease, however, leptomeningeal collaterals are mainly developed from the PCA and extend forward to the territory of the anterior circulation, because the terminal part of internal carotid artery and proximal ACA/MCA are involved in the steno-occlusive process.6 Accordingly, the leptomeningeal collaterals from the PCA are more developed in the posterior part of the cerebral hemisphere, which should be shown as a higher ivy sign in the post-MCA region if the ivy sign really reflected leptomeningeal collaterals from the PCA. However, the ivy sign score was higher in the ant-MCA region in this study; therefore, we doubt this hypothesis.
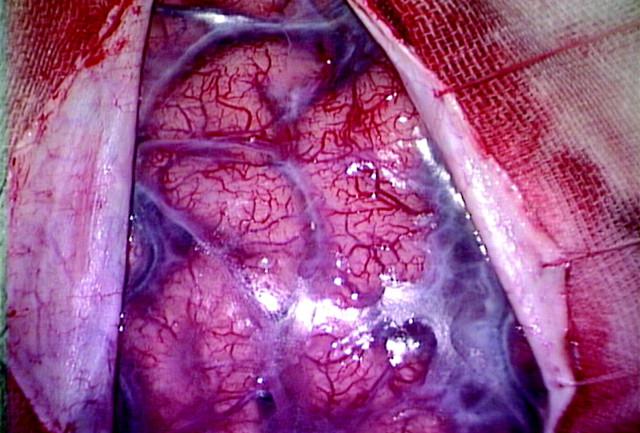
Our results showed that a positive ivy sign reflected a decreased CVR by SPECT. That is why we suspect that the ivy sign reflects maximally dilated pial vasculature to compensate for the decreased perfusion pressure rather than the leptomeningeal collateral arteries. In fact, when a craniotomy is performed in patients with Moyamoya disease, we observe the extremely dilated fine pial vasculature at the surface of the brain, which might be the source of the sign (Fig. 7). Another possible correlate of the ivy sign raised in the previous literature was the congested thickening of the leptomeninges, which is often seen on the brain surface in this disease (Fig. 7).1,2 Although we admit that this can also be contributory, its exact relationship to the ivy sign remains to be clarified.
Fig 7.
A 36-year-old man with Moyamoya disease. Extremely dilated fine pial vasculature and opaque thickened leptomeninges are seen on the brain surface when a craniotomy is performed.
There are some limitations in our study. The FLAIR images were obtained by using 2 different scanners of different field strengths (1T and 1.5T). The appearance of the ivy sign may be different according to the field strength, which remains unclarified.
Next, we assessed the relationship between the ivy sign and SPECT findings in each region respectively, on the assumption that the 4 different regions had an equal reference value. Strictly speaking, however, both CBF and CVR should have different reference values according to different regions of the brain (ie, frontal and occipital lobes normally have different values of CBF and CVR).23,24
Finally, the 4 regions of each cerebral hemisphere for evaluating the ivy sign score did not completely correspond to the regions of interest for CBF and CVR recalculated. This incomplete correspondence might have been derived from having used the template. However, we believe that the assessment was made rather objectively by this automatic region-of-interest process using the templates.
Conclusions
Our findings showed that the ivy sign on FLAIR can reveal decreased CVR in Moyamoya disease. This sign may help to determine the need for surgery and is useful in predicting noninvasively the CVR before and after revascularization surgery.
References
- 1.Suzuki J, Takaku A. Cerebrovascular “moyamoya” disease: disease showing abnormal net-like vessels in base of brain. Arch Neurol 1969;20:288–99 [DOI] [PubMed] [Google Scholar]
- 2.Maeda M, Tsuchida C. “Ivy sign” on fluid-attenuated inversion-recovery images in childhood moyamoya disease. AJNR Am J Neuroradiol 1999;20:1836–38 [PMC free article] [PubMed] [Google Scholar]
- 3.Fujiwara H, Momoshima S, Kuribayashi S. Leptomeningeal high signal intensity (ivy sign) on fluid-attenuated inversion-recovery (FLAIR) MR images in moyamoya disease. Eur J Radiol 2005;55:224–30 [DOI] [PubMed] [Google Scholar]
- 4.Fukui M. Annual Report 1993: The Research Committee on Spontaneous Occlusion of the Circle of Willis (Moyamoya Disease) of the Ministry of Health and Welfare. Tokyo: Ministry of Health and Welfare;1994. :122–24
- 5.Iida H, Itoh H, Nakazawa M, et al. Quantitative mapping of regional cerebral blood flow using iodine-123-IMP and SPECT. J Nucl Med 1994;35:2019–30 [PubMed] [Google Scholar]
- 6.Iida H, Akutsu T, Endo K, et al. A multicenter validation of regional cerebral blood flow quantitation using [123I]iodoamphetamine and single photon emission computed tomography. J Cereb Blood Flow Metab 1996;16:781–93 [DOI] [PubMed] [Google Scholar]
- 7.Mugikura S, Takahashi S, Higano S, et al. The relationship between cerebral infarction and angiographic characteristics in childhood moyamoya disease. AJNR Am J Neuroradiol 1999;20:336–43 [PMC free article] [PubMed] [Google Scholar]
- 8.Nakagawara J, Takeda R, Suematsu K, et al. Quantification of regional cerebral blood flow and vascular reserve in childhood moyamoya disease using [123I]IMP-ARG method. Clin Neurol Neurosurg 1997;99 (suppl 2):S96–99 [DOI] [PubMed] [Google Scholar]
- 9.Honda M, Ezaki Y, Kitagawa N, et al. Quantification of the regional cerebral blood flow and vascular reserve in moyamoya disease using split-dose iodoamphetamine I 123 single-photon emission computed tomography. Surg Neurol 2006;66:155–59, discussion 159 [DOI] [PubMed] [Google Scholar]
- 10.Hoshi H, Ohnishi T, Jinnouchi S, et al. Cerebral blood flow study in patients with moyamoya disease evaluated by IMP SPECT. J Nucl Med 1994;35:44–50 [PubMed] [Google Scholar]
- 11.Takeuchi R, Sengoku T, Matsumura K. Usefulness of fully automated constant ROI analysis software for the brain: 3DSRT and FineSRT. Radiat Med 2006;24:538–44 [DOI] [PubMed] [Google Scholar]
- 12.Takeuchi R. Fully automated ROI analysis software for the brain; 3DSRT [in Japanese]. Nippon Hoshasen Gijutsu Gakkai Zasshi 2003;59:1462–74 [DOI] [PubMed] [Google Scholar]
- 13.Ohta T, Tanaka H, Kuroiwa T. Diffuse leptomeningeal enhancement, “ivy sign,” in magnetic resonance images of moyamoya disease in childhood: case report. Neurosurgery 1995;37:1009–12 [DOI] [PubMed] [Google Scholar]
- 14.Yoon HK, Shin HJ, Chang YW. “Ivy sign” in childhood moyamoya disease: depiction on FLAIR and contrast-enhanced T1-weighted MR images. Radiology 2002;223:384–89 [DOI] [PubMed] [Google Scholar]
- 15.Suzuki J, Kodama N. Cerebrovascular “moyamoya” disease. 2: collateral routes to forebrain via ethmoid sinus and superior nasal meatus. Angiology 1971;22:223–36 [DOI] [PubMed] [Google Scholar]
- 16.Satoh S, Shibuya H, Matsushima Y, et al. Analysis of the angiographic findings in cases of childhood moyamoya disease. Neuroradiology 1988;30:111–19 [DOI] [PubMed] [Google Scholar]
- 17.Yamada I, Murata Y, Umehara I, et al. SPECT and MRI evaluations of the posterior circulation in moyamoya disease. J Nucl Med 1996;37:1613–17 [PubMed] [Google Scholar]
- 18.Mugikura S, Takahashi S, Higano S, et al. Predominant involvement of ipsilateral anterior and posterior circulations in moyamoya disease. Stroke 2002;33:1497–500 [DOI] [PubMed] [Google Scholar]
- 19.Settakis G, Molnar C, Kerenyi L, et al. Acetazolamide as a vasodilatory stimulus in cerebrovascular diseases and in conditions affecting the cerebral vasculature. Eur J Neurol 2003;10:609–20 [DOI] [PubMed] [Google Scholar]
- 20.Fujimura M, Kaneta T, Mugikura S, et al. Temporary neurologic deterioration due to cerebral hyperperfusion after superficial temporal artery-middle cerebral artery anastomosis in patients with adult-onset moyamoya disease. Surg Neurol 2007;67:273–82 [DOI] [PubMed] [Google Scholar]
- 21.McAuley DJ, Poskitt K, Steinbok P. Predicting stroke risk in pediatric moyamoya disease with xenon-enhanced computed tomography. Neurosurgery 2004;55:327–32, discussion 332–33 [DOI] [PubMed] [Google Scholar]
- 22.Kuwabara Y, Ichiya Y, Sasaki M, et al. Time dependency of the acetazolamide effect on cerebral hemodynamics in patients with chronic occlusive cerebral arteries: early steal phenomenon demonstrated by [15O]H2O positron emission tomography. Stroke 1995;26:1825–29 [DOI] [PubMed] [Google Scholar]
- 23.Ito H, Inoue K, Goto K. Database of normal human cerebral blood flow measured by SPECT. I. Comparison between I-123-IMP, Tc-99m-HMPAO, and Tc-99m-ECD as referred with O-15 labeled water PET and voxel-based morphometry. Ann Nucl Med 2006;20:131–08 [DOI] [PubMed] [Google Scholar]
- 24.Ito H, Yokoyama I, Iida H, et al. Regional differences in cerebral vascular response to PaCO2 changes in humans measured by positron emission tomography. J Cereb Blood Flow 2000;20:1264–70 [DOI] [PubMed] [Google Scholar]


