Abstract
BACKGROUND AND PURPOSE: Phase-contrast MR imaging (PCMR) has only partially characterized cyclic CSF flow and pressure, which, hypothetically, have a role in the pathogenesis of syrinx and symptoms in the Chiari I malformation. Our goal was to use computational flow analysis (CFA) to better understand CSF hydrodynamics.
MATERIALS AND METHODS: High-resolution MR images were obtained in a healthy volunteer and a patient with Chiari I malformation. With standard segmentation and discretization techniques, 3D models of the subarachnoid space, cerebellum, and spinal canal were created. CSF flow during systole and diastole were simulated with the boundary element method in the models. CSF velocities and pressures computed in the patient with Chiari I malformation were compared with those in the healthy volunteer. Flow patterns were also compared with PCMR results for validation of the technique.
RESULTS: The CFA and PCMR results agreed well. Inhomogeneous flow patterns characterized by fluid jets anterior and lateral to the spinal cord were demonstrated in both the Chiari I and volunteer models by CFA. Significant circumferential velocities were evident, suggesting swirling flow in the spinal canal. Higher magnitude jets were found in the patient with Chiari I than in the healthy volunteer. Relatively even pressure gradients were found along the spinal canal in both cases, with a 50% steeper gradient in the patient with Chiari I malformation.
CONCLUSIONS: Circumferential velocities and pressure gradients in the spinal canal, which may be clinically relevant to Chiari I and other malformations, can be obtained by CFA in patient-specific geometries.
The Chiari I malformation of the brain is characterized by the cerebellar tonsils extending into the upper cervical spinal canal. The position of the tonsils impedes CSF flow in the foramen magnum. Hypothetically, the altered fluid dynamics in the Chiari I malformation cause the development of neurologic signs and symptoms, including hydrosyringomyelia, a cyst in the spinal cord.1
Imaging CSF flow with phase-contrast MR imaging (PCMR) has improved our understanding of CSF hydrodynamics in the posterior fossa and spinal canal. PCMR images show marked inhomogeneities of CSF flow in the caudal-cephalad direction and in the anteroposterior direction. Some regions in the subarachnoid space have flow jets, and other regions, relatively stagnant flow.2,3 CSF flow has more complex patterns in the presence of the Chiari I malformation, presumably because the cerebellar tonsils in the malformation obstruct this flow.4,5
However, PCMR studies provide an incomplete evaluation of CSF hydrodynamics. The lengthy acquisition time of PCMR limits clinical studies to 1 or a few sections with velocity information instead of 3D volumetric coverage.6 When a PCMR cine image series is acquired in a single axial plane, the flow pattern and flow velocities are shown only for that 1 level, which is not necessarily where the most dominant flow abnormalities occur.7,8 When flow images are acquired in a sagittal plane, flow patterns over multiple spinal levels are shown but usually only in the midline, where the velocities tend not to achieve their greatest magnitude.9,10 Furthermore, typical axial CSF flow measurements with PCMR only capture the velocity vector perpendicularly because of the reduction in scanning time and the difficulty in accurately measuring the very slow velocity components in the anteroposterior and left-right direction. Additionally, PCMR does not directly measure CSF pressures, which are thought to be more relevant than the actual velocities in understanding of the pathogenesis of syrinx formation in patients with Chiari I malformation.11 Therefore, better analytic techniques are needed to differentiate CSF flow patterns that produce symptoms and those that do not. With better analytic techniques, selection of patients for surgical management may be improved.
A powerful method for examining the fluid flow and associated hemodynamic parameters within an irregularly shaped space is computational flow analysis (CFA), which has been effective in the study of aneurysm development and repair12 and in other physiologic flow applications. With CFA, the distribution of time-varying fluid velocities and pressures throughout a particular (ie, patient-specific) geometry can be simulated. We recently described the implementation and validation of a CFA approach for patient-specific analysis of CSF motion (Roldan A, Haughton V, Chesler N, et al, unpublished data, June 2008). The purpose of this study was to characterize CSF flow patterns in the spinal canal of a healthy volunteer and a patient with Chiari I malformation during systole and diastole to demonstrate the utility of CFA for neuroradiologic applications and neurosurgical planning.
Materials and Methods
Patients and Subjects
For the study, a volunteer with no history of neurologic illness or spine disease was solicited from the community. Our institutional review board approved the collection of CSF flow and anatomic image data in healthy subjects. Image data were used from 1 patient with a Chiari I malformation who underwent imaging as part of her neurosurgical evaluation. Our institutional review board approved the retrospective use of this anonymized image dataset.
MR Imaging Method
MR imaging was used to create patient-specific anatomic models for the CFA simulations. In addition, 2D phase-contrast images were acquired for comparisons of simulations with actual in vivo results. All image data were acquired on a clinical 1.5T MR imaging system (high-definition TwinSpeed Excite scanner; GE Healthcare, Waukesha, Wis; maximum gradient strength, 40 mT/m; maximum gradient slew rate, 150 mT/m/ms). The anatomic data were acquired with a volumetric multiecho 3D radial acquisition with fat and water separation balanced steady-state free precession (bSSFP).13 The fully refocused steady-state free precession (SSFP) imaging sequence used for the 3D acquisition allowed imaging with isotropic spatial resolution and fat/water separation. A 20 × 20 × 20 cm3 image volume of 256 × 256 × 256 voxels was acquired by 10,000 projections in a total scanning time of 5 minutes, resulting in a spatial resolution of 0.8 × 0.8 × 0.8 mm3. The high contrast between CSF and the surrounding tissues and the high spatial isotropic resolution facilitated the creation of an accurate model. Other scanning parameters included flip angle = 15°, receiver bandwidth = ±125 kHz, and TR = 2.9 ms.
Axial PCMR flow images were acquired with the clinical standard sequence at the level of the craniovertebral junction. The cine MR images were synchronized to the cardiac cycle by electrocardiogram gating. The acquisition parameters were the following: flip angle = 20°, TR/TE = 20/5 ms, section thickness = 5 mm, FOV = 180 × 180 mm2, acquisition matrix = 256 × 256, and encoding velocity = 10 cm/s.
Computational Flow Analysis
MR images from the patient with Chiari I malformation and the healthy subject were segmented in a general purpose commercial segmentation program for gray-scale medical images (Mimics; Materialise, Ann Arbor, Mich), to create the Chiari I and healthy model geometries, respectively. All absolute scale information was discarded, and relative scale information was maintained to permit comparisons between differently sized individuals. A region of interest within the subarachnoid space was selected, and its range of signal intensities was determined. All voxels within the upper and lower signal intensity value were highlighted. The upper and lower threshold values were adjusted iteratively to display all voxels in the subarachnoid space as completely as possible.
The 3D geometry generated from the edited segmentation mask was exported in stereolithography format into computer-aided design software (Geomagic, Research Triangle Park, NC). The inlet and outlet of the canal were cropped by placing parallel intersecting planes at each end of its longitudinal axis (Fig 1). The length of these geometries was set to 70 mm, and an identical scaling (assuming cubic voxels) was used in the x- and y-directions. The surfaces of the models were smoothed automatically by the program. The model created in Geomagic was exported as a standardized exchange of product file format into Abaqus (Version 6.6–1; Simulia, Providence, RI).
Fig 1.
Healthy (left) and Chiari I (right) models constructed from MR images and scaled to be the same size. In the Chiari I model, the extended tonsils occupy the posterior region of the subarachnoid space and partially obstruct CSF flow.
Shell elements of 8 nodes were chosen. An internodal distance of 3 mm was specified over all boundaries except the inlet and outlet where intermodal distance was smaller (1 mm), to improve precision at these locations. Then, a surface mesh was generated. The list of elements and their corresponding node coordinates were extracted and read into a custom boundary element method (BEM) program written in Fortran (Roldan A, Haughton V, Chesler N, et al, unpublished data, June 2008). The coordinates of the surface nodes were identified automatically by the code. Axial planes perpendicular to the long axis of the model were selected every 10 mm. Two hundred twenty-five nodes within the subarachnoid space were assigned to each axial section. To simulate peak systole, annular flow with a peak velocity of 2.5 cm/s was imposed at the inlet plane and a reference pressure of 0 kPa was imposed at the outlet. No-slip conditions were assigned to the inner and outer surfaces of the spinal canal. Pressures and velocities were calculated at each of the boundary and internal nodes. To simulate peak diastole, we inverted the velocity profile and pressure conditions for the inlet and outlet. Identical volume flow rates were used for the Chiari I and healthy model simulations.
Results obtained with the BEM program were postprocessed with Matlab (MathWorks, Natick, Mass). CSF velocity vectors in the axial plane (ie, caudal-cephalad direction) were displayed as color and contour plots with the function “contourf.” Secondary velocities—that is, velocity vector components in the anteroposterior direction and left-to-right direction—were plotted as arrows with the function “quiver”: the direction indicating the direction of the velocity and the length of the arrow indicating the magnitude of the velocity component. Pressures acting on the inner and outer surfaces in the spinal canal were plotted with the function “contourf.”
Assessment of CFA Results
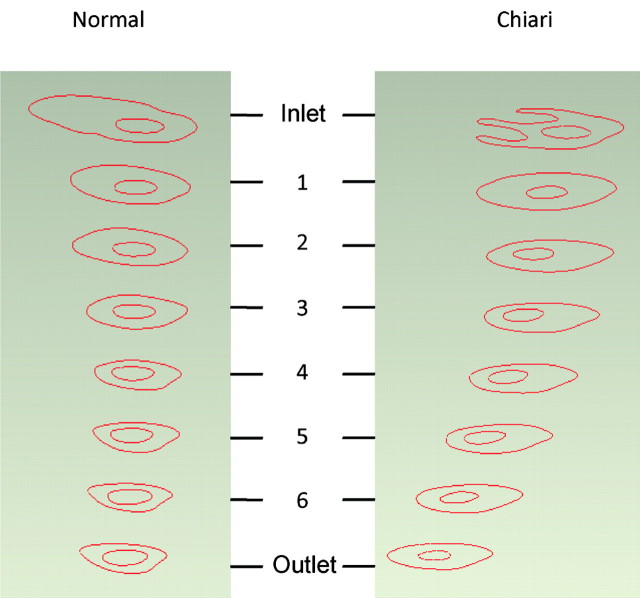
The spatial and temporal velocity patterns in the Chiari I and healthy models were compared during peak systole and peak diastole at the inlet and outlet and at the 6 intermediate axial locations 10 mm apart (Fig 2). A qualitative assessment was performed, focusing on the locations of the most extreme axial and secondary velocities and the overall direction of flow, which can be determined by vector summation of the axial and secondary flow velocities. The pressure gradients during peak systole and peak diastole in the Chiari I and healthy model simulations were compared qualitatively and quantitatively along the inner and outer surfaces of the spinal canal.
Fig 2.
Axial planar sections at the inlet, outlet, and 6 intermediate locations at which CSF velocities were calculated for the healthy (left) and Chiari I (right) CFA models.
Validation
The axial plane flow simulation results computed nearest the craniovertebral junction were compared with the axial plane PCMR images obtained near the craniovertebral junction in the Chiari I and healthy models during systole and diastole. The locations of flow jets were compared by visual inspection.
Results
Patients and Subjects
The healthy volunteer geometry was obtained by MR imaging in a 28-year-old male graduate student with no history of medical illness or spinal symptoms. The Chiari I geometry was obtained by imaging an 8-year-old girl with apnea spells, for whom craniovertebral decompression was advised.
MR Imaging
In the healthy volunteer, MR imaging showed the cerebellar tonsils within the posterior fossa. No crowding of the foramen magnum was noted. No abnormalities were seen in the spinal canal or posterior fossa. In the patient with Chiari I malformation, MR imaging showed 7 mm of tonsillar ectopia and no spinal cord or brain stem syrinx; PCMR showed jets with velocities in 5- to 6-cm/s range. 3D radial bSSFP images showed high contrast in CSF and blood vessels and low signal intensity in other tissues in both cases.
Flow Computation
Geometric models were successfully generated from MR images of the healthy control and the patient with Chiari I malformation by using a combination of commercial software packages (Fig 1). The models, 70 cm in length, included the craniovertebral junction at 1 end. In the Chiari I model, the tonsils were evident at the inlet. The surfaces of the subarachnoid space appeared to have an anatomically correct degree of smoothness. Simulations were successfully performed for both models.
Assessment of CFA Results
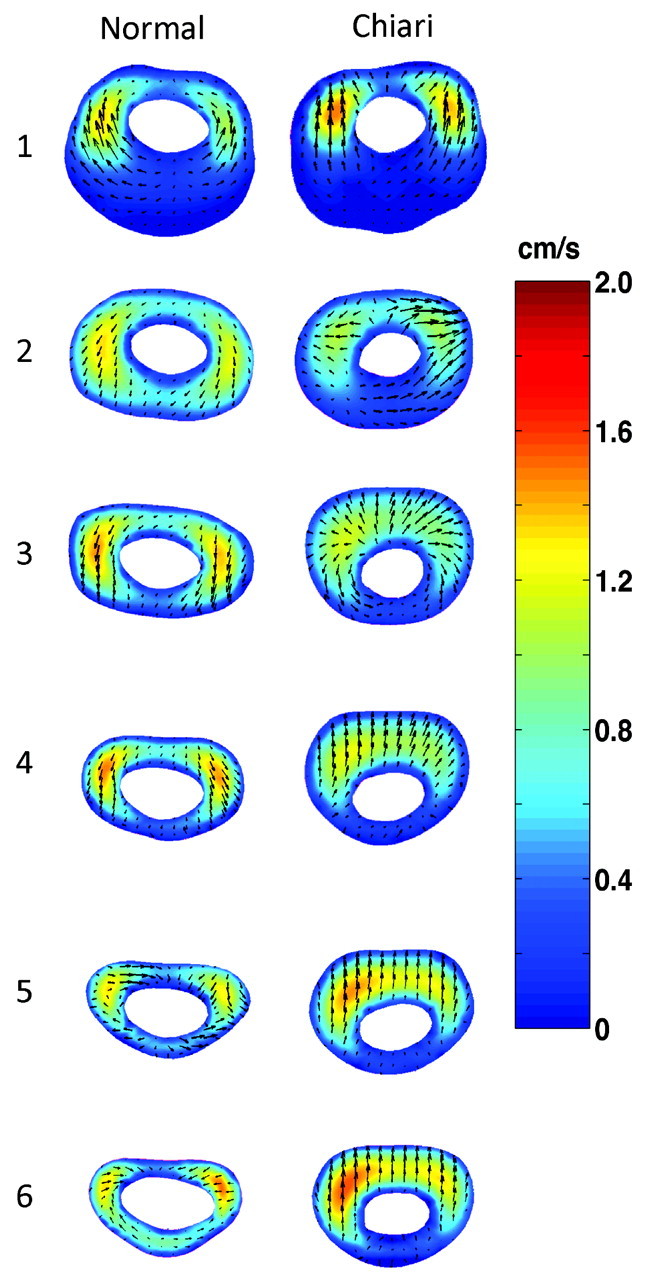
Velocity contours for the 6 interior axial locations at peak systole are presented in Fig 3 for the healthy and Chiari I models. In the healthy model (Fig 3, left column), CSF velocities during systole were found to have different profiles at each axial location. Proximal to the cerebellum (1 cm below the craniovertebral junction), there were 2 jets lateral to the spinal cord. At that level, flow had mainly a caudal-cephalad direction. However, there was also a smaller component of the velocity in a posterior or posteromedial direction (Fig 3, level 1). Posterior to the cord, in the area below the tonsils, flow was relatively stagnant. At the next axial location (1 cm lower; Fig 3, level 2), the largest flow jets remained lateral to the cord. Here, the velocity in the axial direction had diminished, and the secondary direction had changed from posterior to anterior or anteromedial. At the axial level 3, the magnitude of the axial velocity increased with respect to levels 1 and 2 but had patterns similar those in to level 2. Secondary flow velocities reached their peak at this level (3.2 mm/s) and were directed anteriorly. At level 4, the 2 jets were slightly more anterior than those in level 3 but were still lateral to the cord and reached peak values in size and velocity magnitude (2.5 cm/s). Here, secondary velocities were in the anteromedial direction with lower magnitude than in upper levels. The 2 last axial planes (levels 5 and 6) showed anterolateral jets. Overall, the secondary velocities were 1 order of magnitude lower than the axial velocities (ie, millimeters per second versus centimeters per second).
Fig 3.
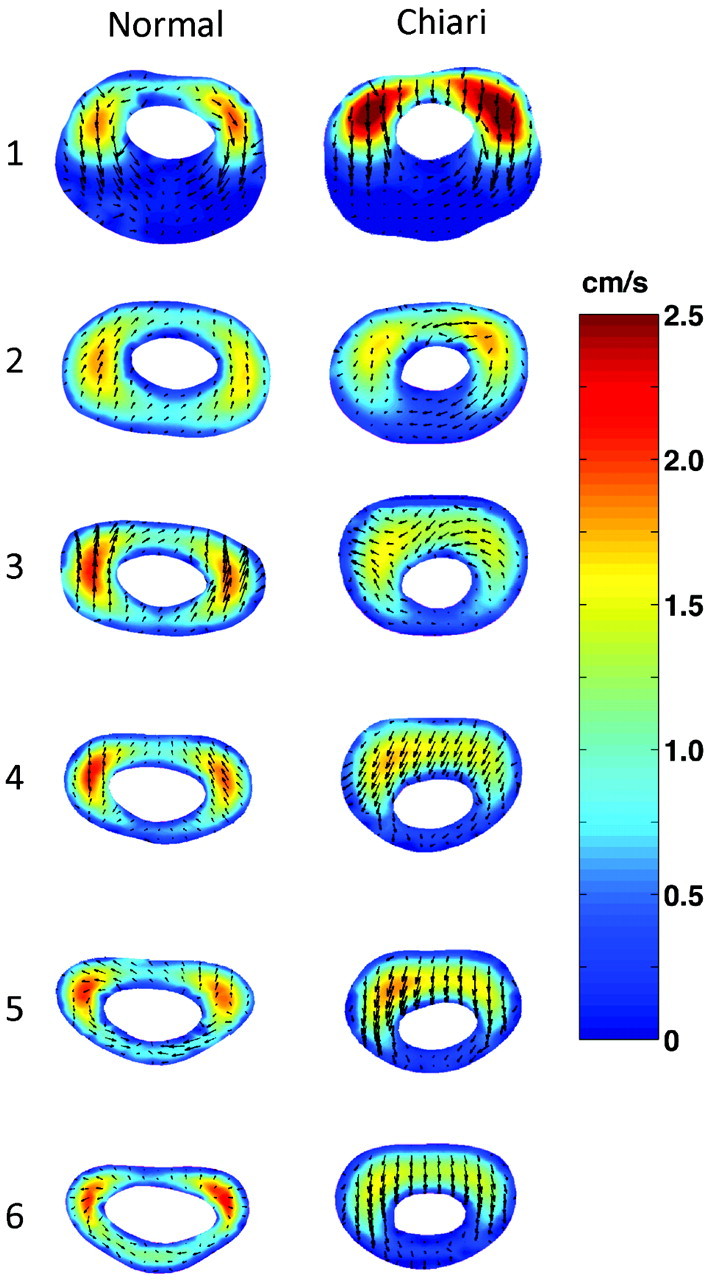
Computed CSF flow velocities by CFA at peak systole in 6 different axial levels in a healthy model (left column) and a Chiari I model (right column). Colors indicate the magnitude of the axial velocity (cephalad-to-caudal direction); arrows show the direction and magnitude of secondary velocities (anterior, medial, or posterior direction).
Similar to that in the healthy model, systolic CSF flow in the Chiari I model (Fig 3, right column) was characterized by jets anterolateral to the cord at axial level 1 (1 cm below the craniovertebral junction). The direction of secondary flow, again similar to that in the healthy model, was posterior. The maximum velocity magnitude at this level was greater in the Chiari I model than in the healthy model (2.5 versus 2.1 cm/s, respectively). Posterior to the cord, flow was nearly stagnant. At the next level, the flow pattern was similar but the magnitude of the anterolateral jets was lower. At the next 4 levels, the maximum velocity appeared as a band anterior to the cord rather than as separate jets anterolateral or lateral to the cord, as seen in upper levels and in the healthy model at these locations. The secondary velocities were predominantly posteriorly directed. In comparison with flow in the healthy model, secondary flow during systole in the Chiari I model tended to be greater in magnitude. The secondary components of the velocity were within the same range as those for the healthy control (ie, millimeters per second).
During diastole in the healthy subject (Fig 4, left column), flow jets were present in nearly the same locations as in systole, though in the opposite direction. At the lowest axial level, higher velocities were seen posterior to the cord compared with that same position during peak systole. The magnitude of flow during diastole was similar to that during systole. The predominant velocity component was in the inferosuperior direction. The secondary flow was in a general lateral and posterolateral direction, where it had been anterior and anteromedial during systole.
Fig 4.
Computed CSF flow velocities by CFA at peak diastole in 6 different axial levels in a healthy model (left column) and Chiari I model (right column). Colors indicate the magnitude of the axial velocity (caudal-to-cephalad direction); arrows show the direction and magnitude of secondary velocities (anterior, medial, or posterior direction).
During diastole in the Chiari I model (Fig 4, right column), flow peaks tended to appear as a band in the more inferior sections and as jets anterolateral to the cord in higher levels. The pattern was similar to that during systole. High-velocity bands in the Chiari I model (levels 3–6) were not seen in the healthy model; jets seen in the healthy model (levels 3–6) were not seen in the Chiari model. The secondary velocities tended to have greater magnitude in the Chiari than in the healthy model and tended to have opposite directions.
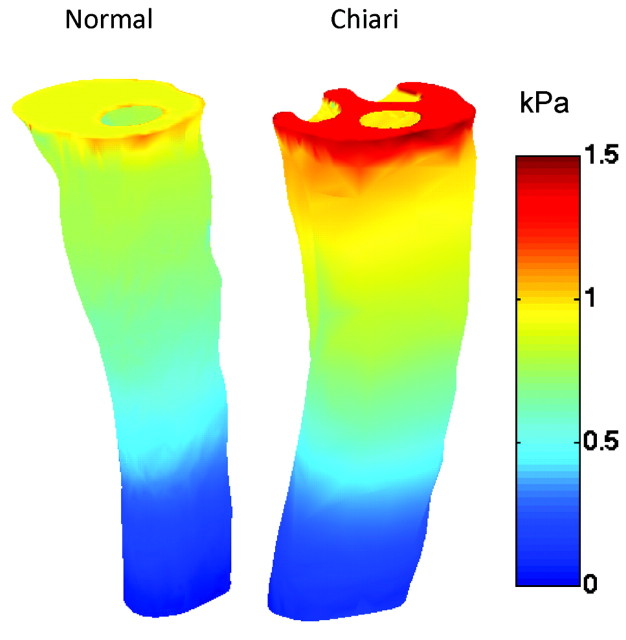
The pressure distributions for both models during peak systole showed a maximum pressure at the inlet and a minimum at the outlet, with a relatively continuous gradient between (Fig 5). A larger pressure gradient was found in the Chiari I model compared with the healthy one. The peak pressures were 1.5-fold higher in the Chiari model than the healthy model.
Fig 5.
Pressure distribution at the inlet and along the outer spinal canal surface for the healthy (left) and Chiari I (right) models during peak systole. A 1–5-fold higher pressure gradient was found in the Chiari I model.
Validation
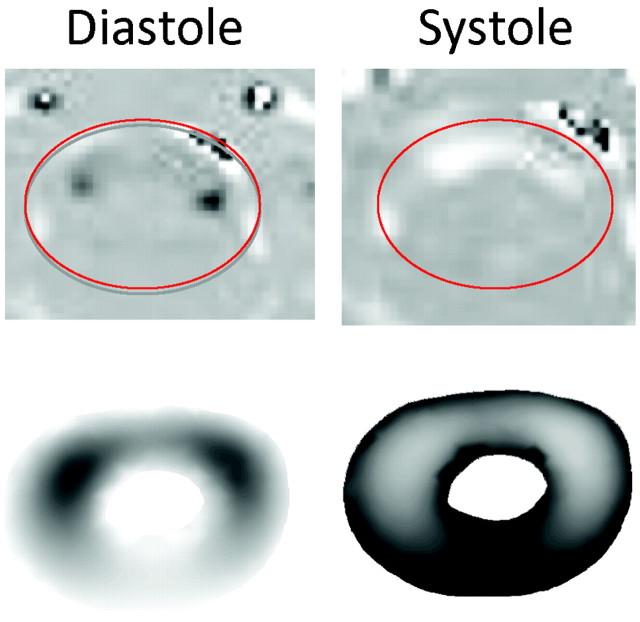
The simulated CSF flow patterns in the Chiari model during systole and diastole at axial level 2 showed qualitative agreement with the velocity patterns in systole and diastole recorded with PCMR (Fig 6). Both simulated and recorded velocities illustrated jets anterolateral to the spinal cord during systole. A band anterior to the cord during diastole is evident in the PCMR images and was less clearly evident but still present in the CFA results. The patterns in the healthy model similarly showed agreement with the flow patterns in the PCMR images of the healthy volunteer (Roldan A, Haughton V, Chesler N, et al, unpublished data).
Fig 6.
Comparison of PCMR recorded velocity profiles (top) and CFA results (bottom) in the Chiari I model during diastole (left) and systole (right). Reasonable qualitative agreement is evident by inspection.
Discussion
This study illustrates the use of CFA based on MR images to predict CSF flow patterns and CSF pressures in healthy subjects and in patients with Chiari I malformation. It demonstrates the heterogeneity of CSF flow along the spinal canal and significant velocity vector components perpendicular to the long axis of the spinal canal. CSF velocities were found to differ between Chiari I and healthy subarachnoid spaces. The pressure gradient was steeper in the patient with Chiari I malformation than in the healthy subject; this finding may be clinically relevant.
This is the first reported attempt to describe CSF velocities and pressures through the upper cervical subarachnoid space in Chiari I malformation by means of CFA, to our knowledge. Numeric simulations in simplified models of the spinal canal have been used previously to study the effect of the eccentricity of the spinal cord with the spinal canal, but actual geometries were not used.14 CFA studies of the ventricular system have been performed,15,16 but these are not relevant to the Chiari I malformation. Some physical models have been created; an in vitro study of syringomyelia hydrodynamics was performed with a phantom model of the spinal canal created from MR imaging.17 The main limitation for both numeric simulations and physical models of CSF within the subarachnoid space has been the complexity of the anatomy. For numeric simulations, the high-attenuation mesh required for domain discretization leads to very high computational costs.14 An advantage of the BEM for CFA over other numeric techniques, such as the finite element or the finite difference method, is that only boundary discretization is required. This advantage makes it well suited for simulating flows in complex geometries with relatively low computational costs. One disadvantage of the BEM is that inertial effects, that is effects occurring during the acceleration of the fluid, are neglected. However, previous studies have suggested that these effects are small in CSF.16 To determine whether these effects are important, future work will compare these results with a CFA method in which inertial effects are included; additional validation could be achieved with PCMR imaging at multiple levels or with a 3D PCMR technique.
The velocity results shown here in healthy and Chiari I geometries agree well with those in the literature.18 The increase in pressure found here with an obstruction at the craniovertebral junction also agrees with prior animal experiments.19 The exclusion of the posterior fossa from the model simplified the problem of creating the geometries and probably introduced some error in measurement, though it apparently did not result in nonphysiologic CSF flow patterns. The creation of these patient-specific anatomic models did require some manual editing, which could have slightly modified the real anatomy. However, we are confident that these minor changes did not greatly affect the anatomic accuracy of the models.
The extensive image-processing time required for each patient-specific case study limited the number of cases that could be studied. Our patients with Chiari I may not be representative of all patients with Chiari I malformation. The volunteer image data likely represents the healthy model accurately because variability between healthy subjects is less than that between patients with Chiari I malformation.20 Nevertheless, with this demonstration of the utility of CFA for understanding CSF flow, additional studies on more patients are anticipated.
Conclusions
Flow simulations show that the Chiari I malformation results in both increased CSF pressures and velocities. A hypothesis based on CSF pressure may be more plausible than one based on CSF velocity to explain the development of syringohydromyelia at a distance from the ectopic tonsils. Simulations may also have a practical benefit, suggesting optimal locations for obtaining CSF flow data when a patient is evaluated for cranio-occipital decompression. If peak velocities are used for the selection of patients for surgical treatment, our results suggest that PCMR flow studies at >1 axial level are required.
Footnotes
This work was Funded by a Conquer Chiari and Column of Hope Grant.
References
- 1.Oldfield EH, Muraszko K, Shawker TH, et al. Pathophysiology of syringomyelia associated with Chiari I malformation of the cerebellar tonsils. J Neurosurg 1994;80:3–15 [DOI] [PubMed] [Google Scholar]
- 2.Elster AD, Chen MY. Chiari I malformations: clinical and radiologic reappraisal. Radiology 1992;183:347–53 [DOI] [PubMed] [Google Scholar]
- 3.Milhorat TH, Chou MW, Trinidad EM, et al. Chiari I malformation redefined: clinical and radiographic findings for 364 symptomatic patients. Neurosurgery 1999;44:1005–17 [DOI] [PubMed] [Google Scholar]
- 4.Haughton V, Korosec F, Medow J, et al. Peak systolic and diastolic CSF velocity in the foramen magnum in adult Chiari I patients and normal subjects. AJNR Am J Neuroradiol 2003;24:169–76 [PMC free article] [PubMed] [Google Scholar]
- 5.Heiss JD, Patronas N, DeVroom HL, et al. Elucidating the pathophysiology of syringomyelia. J Neurosurg 1992;91:553–62 [DOI] [PubMed] [Google Scholar]
- 6.Lee AT, Pike GB, Pelc NJ. Three-point phase-contrast velocity measurements with increased velocity-to-noise ratio. Magn Reson Med 1995;33:122–26 [DOI] [PubMed] [Google Scholar]
- 7.Hofmann E, Warmuth-Metz M, Bendszus M, et al. Phase-contrast MR imaging of the cervical CSF and spinal cord: volumetric motion analysis in patients with Chiari I malformation. AJNR Am J Neuroradiol 2000;21:151–58 [PMC free article] [PubMed] [Google Scholar]
- 8.Armonda RA, Citrin CM, Foley KT, et al. Quantitative cine mode magnetic resonance imaging of Chiari I malformations: an analysis of cerebrospinal fluid dynamics. Neurosurgery 1994;35:214–24 [DOI] [PubMed] [Google Scholar]
- 9.Barkovich AJ, Wippold JF, Sherman JL, et al. Significance of cerebellar tonsillar position on MR. AJNR Am J Neuroradiol 1986;7:795–99 [PMC free article] [PubMed] [Google Scholar]
- 10.Bhadelia RA, Bogdan AR, Wolpert SM, et al. Cerebrospinal fluid flow waveforms: analysis in patients with Chiari I malformation by means of gated phase-contrast MR imaging velocity measurements. Radiology 1995;196:195–202 [DOI] [PubMed] [Google Scholar]
- 11.Brugieres P, Idy-Peretti I, Iffenecker C, et al. CSF flow measurement in syringomyelia AJNR Am J Neuroradiol 2000;21:1785–92 [PMC free article] [PubMed] [Google Scholar]
- 12.Ford MD, Nikolov HN, Milner JS, et al. PIV-measured versus CFD-predicted flow dynamics in anatomically realistic cerebral aneurysm models. J Biomech Eng 2008;130:021015. [DOI] [PubMed] [Google Scholar]
- 13.Lu A, Grist TM, Block WF. Fat/water separation in single acquisition steady-state free precession using multiple echo radial trajectories. Magn Reson Med. 2008;54:1051–57 [DOI] [PubMed] [Google Scholar]
- 14.Loth F, Yardimci MA, Alperin N. Hydrodynamic modeling of cerebrospinal fluid motion within the spinal cavity. J Biomech Eng 2001;123:71–79 [DOI] [PubMed] [Google Scholar]
- 15.Kurtcuoglu V, Soellingerb M, Summersc P, et al. Computational investigation of subject-specific cerebrospinal fluid flow in the third ventricle and aqueduct of Sylvius. J Biomech 2007;40:1235–45 [DOI] [PubMed] [Google Scholar]
- 16.Howden L, Giddings D, Power H, et al. Three-dimensional cerebrospinal fluid flow within the human ventricular system. Comput Methods Biomech Biomed Engin 2008;11:123–33 [DOI] [PubMed] [Google Scholar]
- 17.Martin BA, Kalata W, Loth F, et al. Syringomyelia hydrodynamics: an in vitro study based on in vivo measurements. J Biomech Eng 2005;127:1110–20 [DOI] [PubMed] [Google Scholar]
- 18.Wolpert SM, Bhadelia RA, Bogdan AR, et al. Chiari I malformations: assessment with phase-contrast velocity MR. AJNR Am J Neuroradiol 1994;15:1299–308 [PMC free article] [PubMed] [Google Scholar]
- 19.Turk A, Iskandar BJ, Haughton V, et al. Recording CSF pressure with a transducer-tipped wire in an animal model of Chiari I. AJNR Am J Neuroradiol 2006;2:354–55 [PMC free article] [PubMed] [Google Scholar]
- 20.Quigley MF, Iskandar B, Quigley ME, et al. Cerebrospinal fluid flow in foramen magnum: temporal and spatial patterns at MR imaging in volunteers and in patients with Chiari I malformation. Radiology 2004;232:229–36 [DOI] [PubMed] [Google Scholar]


