Abstract
Background and aims
Recent research has shown that microRNAs (miRNAs), a class of sequences regulating gene expression without undergoing translational processes, have been accepted as novel biomarkers of diseases. In the present meta-analysis, our main objective was to evaluate the diagnostic value of miRNAs expressed in different body fluids for Alzheimer’s disease (AD), more exactly to analyze the discriminative value of miRNAs between AD and control subjects.
Methods
Medline and EMBASE were searched for articles written in English, and because the result reporting modalities were extremely different in the studies included in the analysis, the current article comprises 2 meta-analyses, each of them using different statistical indicators. The first meta-analysis reviewed 10 studies, which were required to provide sufficient information to allow the calculation of AUC or Cohen’s d for size effect. We proposed a second meta-analysis, starting from the drawbacks identified in this first approach, which used different statistical indicators (fold change) provided by other studies (8 studies).
Results
The present study offers an encouraging role of miRNA families in diagnosing AD. The heterogeneity of miRNA expression between the hippocampus, CSF and peripheral blood, the small sample size of each research study, as well as the different methods for miRNA detection remain the main obstacles in interpreting these results.
Conclusions
There is a need (in a future perspective) to establish the right miRNA combinations as potent diagnostic biomarkers for AD.
Keywords: biomarkers, Alzheimer’s disease, microRNAs, meta-analysis
Background and aims
Alzheimer’s Disease (AD), the most common form of neurodegenerative illness after the age of 65, is increasing fast in both developed and developing countries. According to the World Health Organization, 47 million people have dementia and there are 9.9 million new cases every year worldwide. By 2050, it is expected that 1 in 85 people will be affected by this pathological condition worldwide [1,2].
The methods and procedures for diagnosing AD include a combination of neuropsychological assessment, biomarkers and neuroimaging techniques [3]. Although these methods are quite well consolidated in the medical community, the diagnosis of the disease is costly, invasive, and potentially dangerous [4]. In the last few years, miRNAs have been proposed as non-invasive biomarkers in diagnosis, monitoring and response to treatment for Alzheimer’s disease. miRNAs are involved in many stages in the production and degradation of toxic proteins, and changes in their expression can be directly related to the pathology. When their dysregulation is established, it may be the beginning of a process of neuronal death and subsequent development of a neurodegenerative condition. They also have the advantage of being stable in bodily fluids where miRNA changes could be detected (they are able to cross the blood brain barrier transported by exosomes) and less invasive, thus contributing positively to patient care and outcomes. Therefore, miRNAs are recognized as novel and powerful biomarkers for the diagnosis of AD. Despite the increasing number of studies in the field, many issues are still unclear. Some studies analyzed the same miRNAs in the same disease but reported different results. For example, only 17 of 120 miRNAs evaluated for AD were found to be dysregulated in more than one reference [5]. There is also a lack of uniformity in the presentation of miRNA profiling data sets, which makes the approach to different analyses (e.g., meta-analysis) very difficult. For example, few studies provided information about AUC values, sensitivity and specificity, while these values suggest the diagnostic potential of miRNAs as biomarkers for AD patients [6]. Starting from these limitations, the current study includes 2 meta-analytical approaches, which use different statistical indicators. The first study analyzes the specialized studies that have used and completely reported the values of the statistical indicator (AUC) to express miRNAs. A number of shortcomings were identified in this first approach, and a second meta-analysis was conducted, which uses another statistical indicator (fold change).
In both meta-analyses, our objective was to evaluate the diagnostic value of miRNAs expressed in different body fluids for AD, more exactly to analyze the discriminative value of miRNAs between AD and control subjects. At the same time, our analysis identifies the challenges related to methodological aspects in the performing of a meta-analysis, its limitations, and emphasizes the need to standardize the presentation of data in specialized studies.
Study 1. The discriminative value of miRNAs between AD and control subjects, based on areas under the curve and standard difference in means
Methods
Study selection criteria
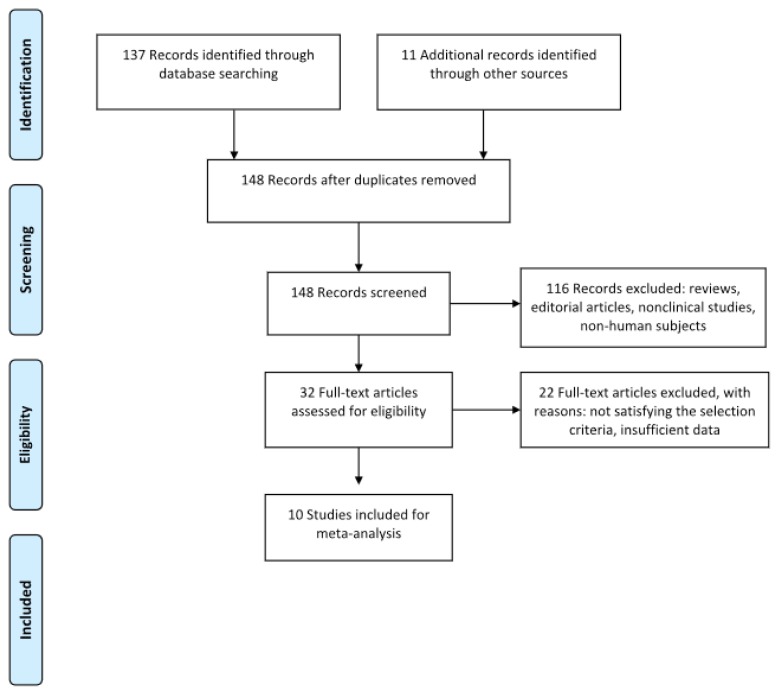
Medline and EMBASE were searched for articles written in the English language, published until January 2018, using the keywords Alzheimer’s disease, neurodegenerative disease in combination with miRNAs, biomarkers, diagnosis, microRNA profiling. The reference list of relevant systematic reviews was examined for relevant studies and possible data sources. Reviews and abstracts were excluded. The selected articles included cohort and case control studies of human participants with AD, diagnosed with validated neuropsychological instruments (e.g., Mini Mental State Examination). In these included studies, AD patients were tested for the expression of circulating miRNAs in different biological fluid samples (serum, plasma, whole blood, cerebrospinal fluid). The included studies were required to provide sufficient information to allow the calculation of AUC or Cohen’s d for size effect. Given the paucity of studies providing information about AUC values, no minimum sample size was required in order to meet the inclusion criteria. Furthermore, no restrictions were placed on the type of miRNA extraction protocol (Figure 1).
Figure 1.
Prisma flow diagram for study 1.
Data extraction
Using the above mentioned search terms, all relevant citations were identified by two independent researchers. In the next phase, based on the assumed inclusion criteria, the full text of relevant studies was reviewed. The data were extracted from studies that met all eligibility criteria and entered into a database. All disagreements were resolved by discussion between reviewers.
Statistical analysis
Analyses were conducted by using Comprehensive Meta-Analysis software, version 2.2.050 (Biostat Inc., Englewood, NJ, USA). As an indicator of effect sizes, the standard difference in means was used (Cohen’s d), obtained either from basic statistical indicators (e.g., means and standard deviations) or from areas under the curve (AUC). In interpreting AUC, we used the suggestions of Streiner and Cairney, who show that the discriminative accuracy of tests with AUC between 0.50 and 0.70 is low, an accuracy between 0.70 and 0.90 is moderate, while an AUC over 0.90 indicates high accuracy [7].
Results
We identified 74 potentially relevant studies based on the electronic search. From these articles, 31 provided data that analyzed miRNAs as a diagnostic biomarker of Alzheimer’s disease. These studies were examined in detail, and 10 of them were retained because they reported AUC, sensitivity and specificity values clearly. Therefore, the final sample included 10 studies. These studies provided data from an aggregate sample of 63 miRNAs. A total of 1584 participants were subjected to analysis. The specimens used for miRNA analysis included plasma, serum, CSF. The method for miRNA extraction was quantitative reverse transcription-polymerase chain reaction (qRT-PCR).
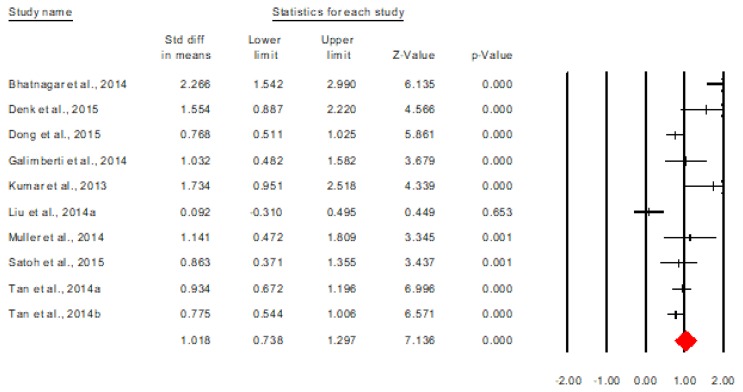
The heterogeneity analysis proved a significant heterogeneity of the results, Q(9)=39.78, p<0.001. Based on this information, all the following analyses were performed under a random effects model. Figure 2 describes the forest plot for the overall discriminative value of miRNAs between AD and control subjects. The analysis is presented at the study level [5,9,11–17].
Figure 2.
The overall discriminative value of miRNAs between AD and control subjects (study as a unit of analysis).
As shown by the figure above, there is an overall significant discriminative value of miRNAs between the two categories of subjects, Cohen’s d=1.018, 95% CI= [0.738, 1.297], p<0.001. The equivalent of this effect size in terms of area under the curve is AUC=0.764, 95% CI=[0.699, 0.820], which means, according to Streiner and Cairney (2007), a moderate discriminative accuracy. Also, from the forest plot it can be seen that all studies report significant overall results, excepting Liu et al. [7,8].
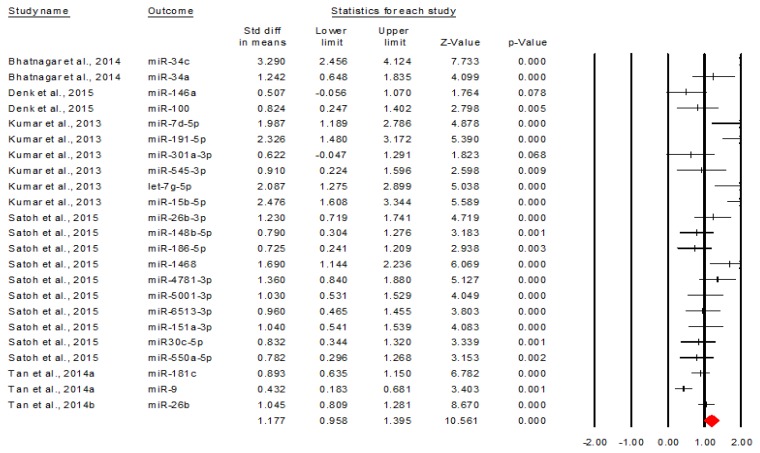
Further, we analyzed the upregulated and downregulated miRNAs separately. Figure 3 describes the forest plot of upregulated miRNAs [5,9,11,16,17].
Figure 3.
The discriminative value of upregulated miRNAs between AD and control subjects.
The figure above shows that upregulated miRNAs have a significant overall discriminative value, Cohen’s d= 1.117, 95% CI=[0.958, 1.395], p<0.001. By transforming this effect size into area under the curve, we obtained an AUC=0.797, 95% CI=[0.750, 0.838], meaning a moderate discriminative value [7]. Another important observation related to this forest plot is that all miRNAs have a significant discriminative value, excepting miR-146a and miR-301a-3p [5,9].
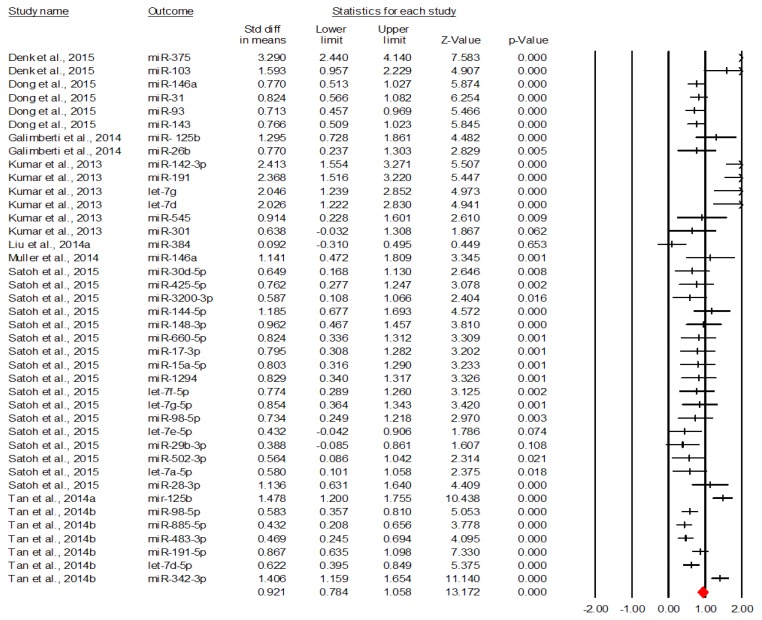
Finally, figure 4 describes the forest plot for the discriminative value of downregulated miRNAs [5,8,9,12,13,15–17].
Figure 4.
The discriminative value of downregulated miRNAs between AD and control subjects.
The figure above shows that downregulated miRNAs have a significant overall discriminative value, Cohen’s d=0.921, 95% CI=[0.784, 1.058], p<0.001. The equivalent of this effect size in terms of area under the curve is AUC=0.742, 95% CI=[0.710, 0.772], meaning a moderate discriminative accuracy according to Streiner and Cairney [7]. Another fact worth mentioning here is that except 4 specific miRNAs (let-7e-5p, miR-29b-3p, miR-384 and miR-301), all miRNAs have significant discriminative values.
Based on the observation during the data extraction process that many studies do not report sufficient data for non-significant results, we performed a publication bias analysis in order to explore this bias even from a statistical point of view.
The publication bias was analyzed in several different ways. First, we used the Begg and Mazumdar Rank Correlation Test, which indicates whether there is a relationship between the effect sizes and their standard error (which incorporates the size of the studies). Our results demonstrated a significant positive correlation, Tau=0.71, p=0.004. As long as large standard errors are associated with small studies, this result suggests that as the size of the studies decreases, the effect size increases. In other words, there is a significant tendency to publish small studies if they have large effects. Applied to our meta-analysis, the case is rather that significant results are reported (published), while non-significant results are ignored (not reported or reported with insufficient data in order to calculate their effect sizes).
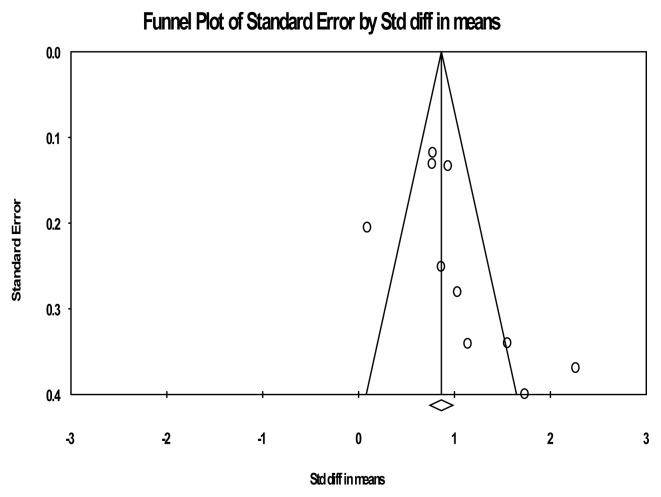
A good illustration of this case can be seen in the funnel plot for the overall effect of miRNAs (Figure 5).
Figure 5.
The funnel plot for the overall discriminative value of miRNAs between AD and control subjects.
As suggested by the figure above, studies with low standard errors (large studies) situated in the upper part of the graph tend to be relatively equilibrated regarding their effect sizes, while studies with high standard errors (small studies) tend to have effect sizes above the average. This would reflect the fact that smaller studies (which appear toward the bottom of the graph) are more likely to be published if they have larger than average effects, which makes them more likely to meet the criteria for statistical significance.
Finally, the classic fail-safe N analysis (which computes the number of studies that would be required to nullify the effect) confirms this situation. The results of this test show that the fail-safe N is 527. This means that we would need to locate and include 527 ‘null’ studies in order for the combined 2-tailed p-value to exceed 0.050 or, in other words, 52.7 missing studies would be needed for every observed study for the effect to be nullified. Such a large number, obtained for just 10 observed studies, suggests the unusually large proportion of studies with significant results in our meta-analysis, and implicitly the previously mentioned publication bias.
Discussion
Based on the results presented above, we concluded that when trying to establish the discriminative value of miRNAs between AD and control subjects, choosing to select AUC as an effect size generates a publication bias. In other words, there is a tendency to publish or to report full versions of the results in terms of AUC only for miRNAs with significant discriminative value. As a consequence, a meta-analysis performed in this manner tends to overestimate the discriminative value of miRNAs.
Another conclusion based on these results is that it is difficult to reliably identify at a meta-analytical level the discriminative value of each miRNA as long as there are very few miRNAs that are replicated from one study to another.
A solution to overcome the publication bias is to replace the AUCs with statistical indicators for which articles report enough data, even for miRNAs which do not have a significant discriminative value. Such an indicator seems to be the fold change. As far as the unit of analysis is concerned, the lack of replication of results for each miRNA, observed when miRNA was the unit of analysis, can be resolved to a certain extent by using the family of miRNAs as a unit of analysis. In this way, replications from one study to another can be identified at least at family level.
Study 2. The discriminative value of miRNAs between AD and control subjects, based on the fold change
Based on the limits of our first approach and the directions mentioned there, we performed a second meta-analysis whose objective was the same – to analyze the discriminative value of miRNAs between AD and control subjects – but the approach to fulfill this objective was different. First, we replaced the AUC as the focus of analysis with the fold change. The consequence was that the new meta-analysis contained much more non-significant effects, overcoming in this way the publication bias. Second, the new unit of analysis was not each specific miRNA, but the family of miRNAs based on the complex sequence relationships. In this context, all international conventions and criteria for miRNA family classification, identification and naming were presented in a short article [10].
We explored the research articles studying the role of miRNAs in AD, published until January 2018, and selected only those families which were represented in the empirical literature by at least 2 different miRNAs. As a consequence, we performed the following meta-analysis with focus only on the following 5 families of miRNAs: let 7, miR 10, miR 15/16, miR 17–92, miR 221/222.
Methods
Study selection criteria
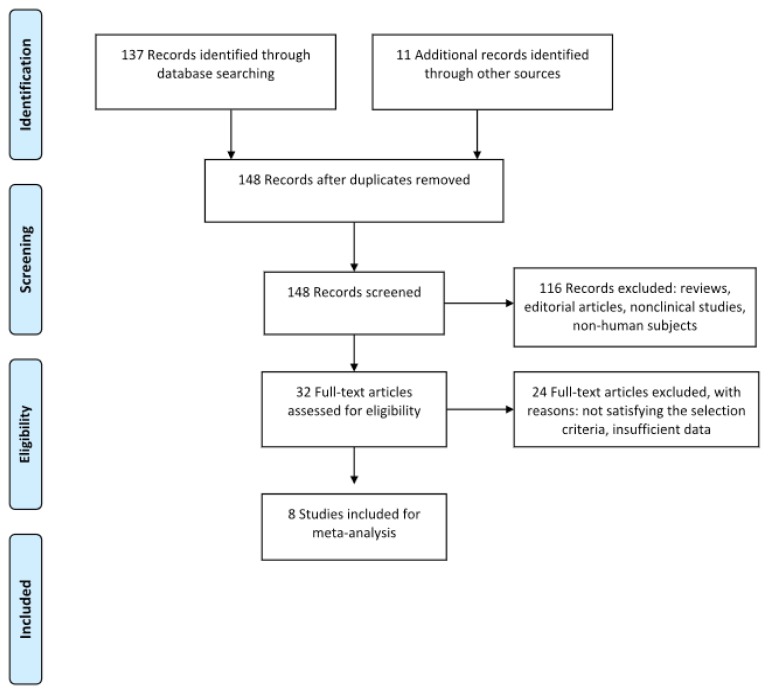
Medline and EMBASE were searched for articles written in the English language using the keywords Alzheimer’s disease, neurodegenerative disease in combination with miRNAs, biomarkers, diagnosis, microRNA profiling. The reference list of relevant systematic reviews was examined for relevant studies and possible data sources. Reviews and abstracts were excluded. The selected articles included cohort and case control studies of human participants with AD, diagnosed with validated neuropsychological instruments (e.g., Mini Mental State Examination). In these included studies, AD patients were tested for the expression of circulating miRNAs in different biological fluid samples (serum, plasma, whole blood, cerebrospinal fluid). The included studies were required to provide sufficient information to allow the calculation of the fold change as an effect size. Given the paucity of studies providing information about AUC values, no minimum sample size was required in order to meet the inclusion criteria. Furthermore, no restrictions were placed on the type of miRNA extraction protocol (Figure 6).
Figure 6.
Prisma flow diagram for study 2.
Data extraction
Using the above mentioned search terms, all relevant citations were identified by two independent researchers. In the next phase, based on the assumed inclusion criteria, the full text of relevant studies was reviewed. The data were extracted from studies that met all eligibility criteria and entered into a database. All disagreements were resolved by discussion between reviewers.
Statistical analysis
Analyses were conducted by using Comprehensive Meta-Analysis software, version 2.2.050 (Biostat Inc., Englewood, NJ, USA). As an indicator of effect sizes, we used the logarithm base 2 of the fold change, AD over control subjects (log2 FC).While an FC=1 means equal expression of a miRNA in AD and control subjects, and log 2 of 1 is zero, negative logarithmic values correspond to downregulated miRNAs, and positive logarithmic values correspond to upregulated miRNAs.
Results
We identified 74 potentially relevant studies based on the electronic search. From these articles, 31 provided data that analyzed miRNAs as a diagnostic biomarker of Alzheimer’s disease. These remaining studies were examined in detail, and 22 of them were excluded because they did not report the fold change or sufficient data to compute it. The final sample included 8 studies. These studies provided data from an aggregate sample of 38 miRNAs grouped in 6 miRNA families. The identified families were: let 7, miR 10, miR 15/16, miR 17–92, miR181, miR 221/222. A total of 949 participants were subjected to analysis. The specimens used for miRNA analysis included plasma, serum, CSF. The method for miRNA extraction was quantitative reverse transcription-polymerase chain reaction (qRT-PCR).
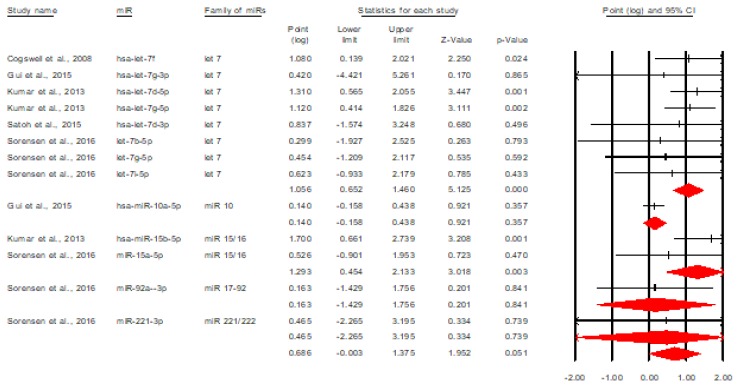
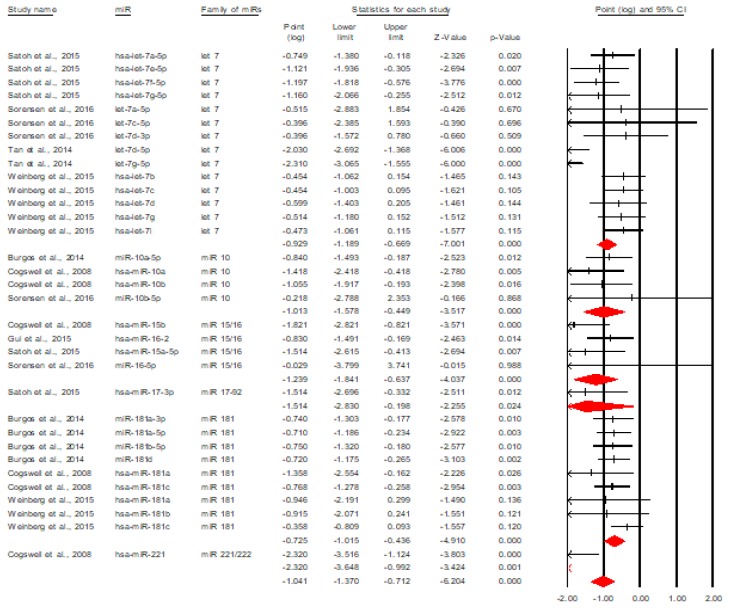
The heterogeneity analysis demonstrated a significant heterogeneity of the results, Q (7) = 82.53, p< 0.001. Consequently, all the following analyses were performed under a random effects model. Figure 7 and figure 8 depict the discriminative value of each miRNA, organized by families of miRNAs and expressed as log 2 base of the fold change [5,16,18–22].
Figure 7.
The forest plot of log2 FC (AD/NC) for each family of upregulated miRNAs.
Figure 8.
The forest plot of log2 FC (AD/NC) for each family of downregulated miRNAs.
Publication bias analysis
The Begg and Mazumdar Rank Correlation Test demonstrated no correlation between the standard error and the overall effect obtained by studies, Tau=−0.14, p=0.710. In other words, as we observed even from the process of exploring the results of each study and introducing them into the database, by choosing to use the fold change and not the AUC as an indicator of discriminative value of miRNAs, we reduced the publication bias (by identifying and including non-significant results in the analysis).
Discussion
The development of new biomarkers for AD diagnosis remains a great challenge because most patients are asymptomatic at the early phase. However, knowing that miRNAs play a key role in neurological pathology, it is important to investigate the correlation between the expression of miRNAs and progressive neurodegeneration in AD. Nonetheless, the outcomes of this meta-analysis have not been constantly consistent and no unanimity has yet been reached. We are of course at the beginning of examining this territory and there is a reason to believe that there remains much work to be done to perfectly define the links between AD and certain miRNAs.
We identified eight English studies focusing on miRNAs in body fluids including CSF, serum and plasma, involved in the diagnostic assays of AD. Firstly, we reviewed 63 miRNAs which are down- or upregulated in the brain and biological fluids of AD compared to control subjects. Most of them were significantly downregulated, such as half of the let 7 family including has-let-7a-5p, has-let-7e-5p, has-let-7f-5p, has-let-7g-5p, let-7d-5p, let-7g-5p, a majority of miR-10 family members such as miR-10a-5p, has-miR-10a and has-miR-10b, three quarters of the miR-15/16 family (has-miR-15b, has-miR-16-2, has-miR-15a-5p), miR-17-3p from the miR-17-92 family, almost all members of the miR-181 family, as well as has-miR-221 belonging to the miR 221/222 family.
In contrast, other specific miRNAs were significantly upregulated, such as only two miRs from the let 7 family (has-let-7d-5p and has-let-7g-5p), has-miR-15b-5p of the miR-15/16 family and miR-221-3p included in the miR-221/222 family. The heterogeneity of miRNA expression between the hippocampus, CSF and peripheral blood, the small sample size of each research study, as well as the different methods for miRNA detection remain the main obstacles in interpreting these results.
Conclusions
To conclude, the present meta-analysis offers an encouraging role of miRNAs, especially let-7 (8/12 members) and miR-15/16 (4 members) families, in diagnosing AD, which have the advantage of being non-invasive biomarkers for exploration, monitoring and also early detection of AD. There is a need (in a future perspective) to establish the right miRNA combinations as potent diagnostic biomarkers for AD.
References
- 1.CDC (Center for Disease Control and Prevention) Alzeheimer’s disease and healthy aging. Available from: http://www.cdc.gov/aging/data/
- 2.Brookmeyer R, Johnson E, Ziegler-Graham K, Arrighi HM. Forecasting the global burden of Alzheimer’s disease. Alzheimers Dement. 2007;3:186–191. doi: 10.1016/j.jalz.2007.04.381. [DOI] [PubMed] [Google Scholar]
- 3.Stoicea N, Du A, Lakis DC, Tipton C, Arias-Morales CE, Bergese SD. The MiRNA journey from theory to practice as a CNS biomarker. Front Genet. 2016;7:11. doi: 10.3389/fgene.2016.00011. [DOI] [PMC free article] [PubMed] [Google Scholar]
- 4.Batistela MS, Josviak ND, Sulzbach CD, de Souza RL. An overview of circulating cell-free microRNAs as putative biomarkers in Alzheimer’s and Parkinson’s Diseases. Int J Neurosci. 2017;127:547–558. doi: 10.1080/00207454.2016.1209754. [DOI] [PubMed] [Google Scholar]
- 5.Kumar P, Dezso Z, MacKenzie C, Oestreicher J, Agoulnik S, Byrne M, et al. Circulating miRNA biomarkers for Alzheimer’s disease. PLoS One. 2013;8:e69807. doi: 10.1371/journal.pone.0069807. [DOI] [PMC free article] [PubMed] [Google Scholar]
- 6.Lusardi TA, Phillips JI, Wiedrick JT, Harrington CA, Lind B, Lapidus JA, Saugstad JA. MicroRNAs in human cerebrospinal fluid as biomarkers for Alzheimer’s disease. Int J Alzheimers Dis. 2017;55(3):1223–1233. doi: 10.3233/JAD-160835. [DOI] [PMC free article] [PubMed] [Google Scholar]
- 7.Streiner DL, Cairney J. What’s under the ROC? An introduction to receiver operating characteristics curves. Can J Psychiatry. 2007;52:121–128. doi: 10.1177/070674370705200210. [DOI] [PubMed] [Google Scholar]
- 8.Liu Y, Qing H, Deng Y. Biomarkers in Alzheimer’s disease analysis by mass spectrometry-based proteomics. Int J Mol Sci. 2014;15:7865–7882. doi: 10.3390/ijms15057865. [DOI] [PMC free article] [PubMed] [Google Scholar]
- 9.Denk J, Boelmans K, Siegismund C, Lassner D, Arlt S, Jahn H. MicroRNA profiling of CSF reveals potential biomarkers to detect Alzheimers disease. PLoS One. 2015;10:e0126423. doi: 10.1371/journal.pone.0126423. [DOI] [PMC free article] [PubMed] [Google Scholar]
- 10.Ambros V, Bartel B, Bartel DP, Burge CB, Carrington JC, Chen X, et al. A uniform system for microRNA annotation. RNA. 2003;9:277–279. doi: 10.1261/rna.2183803. [DOI] [PMC free article] [PubMed] [Google Scholar]
- 11.Bhatnagar S, Chertkow H, Schipper HM, Yuan Z, Shetty V, Jenkins S, et al. Increased microRNA-34c abundance in Alzheimer’s disease circulating blood plasma. Front Mol Neurosci. 2014;7:2. doi: 10.3389/fnmol.2014.00002. [DOI] [PMC free article] [PubMed] [Google Scholar]
- 12.Dong H, Li J, Huang L, Chen X, Li D, Wang T, et al. Serum microRNA profiles serve as novel biomarkers for the diagnosis of Alzheimer’s disease. Dis Markers. 2015;2015:625659. doi: 10.1155/2015/625659. [DOI] [PMC free article] [PubMed] [Google Scholar]
- 13.Galimberti D, Villa C, Fenoglio C, Serpente M, Ghezzi L, Cioffi SM, et al. Circulating miRNAs as potential biomarkers in Alzheimer’s disease. J Alzheimers Dis. 2014;42:1261–1267. doi: 10.3233/JAD-140756. [DOI] [PubMed] [Google Scholar]
- 14.Liu CG, Wang JL, Li L, Wang PC. MicroRNA-384 regulates both amyloid precursor protein and β-secretase expression and is a potential biomarker for Alzheimer’s disease. Int J Mol Med. 2014;34:160–166. doi: 10.3892/ijmm.2014.1780. [DOI] [PubMed] [Google Scholar]
- 15.Müller M, Kuiperij HB, Claassen JA, Küsters B, Verbeek MM. MicroRNAs in Alzheimer’s disease: differential expression in hippocampus and cell-free cerebrospinal fluid. Neurobiol Aging. 2014;35:152–158. doi: 10.1016/j.neurobiolaging.2013.07.005. [DOI] [PubMed] [Google Scholar]
- 16.Satoh J, Kino Y, Niida S. MicroRNA-Seq data analysis pipeline to identify blood biomarkers for Alzheimer’s disease from public data. Biomark Insights. 2015;10:21–31. doi: 10.4137/BMI.S25132. [DOI] [PMC free article] [PubMed] [Google Scholar]
- 17.Tan L, Yu JT, Tan MS, Liu QY, Wang HF, Zhang W, et al. Genome-wide serum microRNA expression profiling identifies serum biomarkers for Alzheimer’s disease. J Alzheimers Dis. 2014;40:1017–1027. doi: 10.3233/JAD-132144. [DOI] [PubMed] [Google Scholar]
- 18.Cogswell JP, Ward J, Taylor IA, Waters M, Shi Y, Cannon B, et al. Identification of miRNA changes in Alzheimer’s disease brain and CSF yields putative biomarkers and insights into disease pathways. J Alzheimers Dis. 2008;14:27–41. doi: 10.3233/jad-2008-14103. [DOI] [PubMed] [Google Scholar]
- 19.Weinberg RB, Mufson EJ, Counts SE. Evidence for a neuroprotective microRNA pathway in amnestic mild cognitive impairment. Front Neurosci. 2015;9:430. doi: 10.3389/fnins.2015.00430. [DOI] [PMC free article] [PubMed] [Google Scholar]
- 20.Gui Y, Liu H, Zhang L, Lv W, Hu X. Altered microRNA profiles in cerebrospinal fluid exosome in Parkinson disease and Alzheimer disease. Oncotarget. 2015;6:37043–37053. doi: 10.18632/oncotarget.6158. [DOI] [PMC free article] [PubMed] [Google Scholar]
- 21.Sørensen SS, Nygaard AB, Christensen T. miRNA expression profiles in cerebrospinal fluid and blood of patients with Alzheimer’s disease and other types of dementia - an exploratory study. Transl Neurodegener. 2016;5:6. doi: 10.1186/s40035-016-0053-5. [DOI] [PMC free article] [PubMed] [Google Scholar]
- 22.Kumar S, Reddy PH. Are circulating microRNAs peripheral biomarkers for Alzheimer’s disease? Biochim Biophys Acta. 2016;1862:1617–1627. doi: 10.1016/j.bbadis.2016.06.001. [DOI] [PMC free article] [PubMed] [Google Scholar]


