

Abstract
Teenagers under the age of 18 could legally purchase e-cigarettes until states passed e-cigarette minimum legal sale age laws. These laws may have curtailed pregnant teenagers ability to use e-cigarettes for smoking cessation and increased prenatal cigarette smoking rates as a result. We investigate the effect of e-cigarette minimum legal sale age laws on prenatal cigarette smoking and birth outcomes for underage rural teenagers using data on all births from 2010 to 2016 from 32 states. We find that e-cigarette minimum legal sale age laws increased prenatal smoking in a given trimester by 0.6 percentage points (pp) overall. These effects were disproportionately concentrated in pre-pregnancy smokers. There was little evidence of the laws having any effect on pre-pregnancy non-smokers, suggesting that ENDS MLSAs increased prenatal smoking rates by reducing cigarette smoking cessation instead of by causing new cigarette smoking initiation. Our results may indicate an unmet need for assistance with smoking cessation among pregnant teenagers.
Keywords: prenatal smoking, electronic nicotine delivery systems, e-cigarettes, purchasing age laws, tobacco control, birth outcomes
JEL Classification Numbers: I12, I18
Introduction
Smoking is one of the leading causes of poor birth outcomes in the United States (U.S. Department of Health and Human Services, 2014). For this reason, women smokers may be especially motivated to quit smoking during pregnancy, with subsequent health benefits for both themselves and their offspring.
The relatively recent introduction of electronic nicotine delivery systems (ENDS) (which people vape rather than smoke) has provided pregnant women with a smoking cessation product option similar in some respects to FDA-approved nicotine replacement therapies (e.g. patch, gum) and smoking cessation medications (e.g. Chantix, Zyban). However, the safety of using ENDS for smoking cessation during pregnancy has received an inconclusive grade from the United States Preventive Services Task Force (Siu & Force, 2015). Vaping nicotine during pregnancy is risky primarily because nicotine, which is in most ENDS, is harmful to the developing fetus (Royal College of Physicians, 2016).
Minimum legal sale age (MLSA) laws have long been in place for traditional cigarettes. While there is evidence that these laws reduce smoking among youth (Ertan Yörük & Yörük, 2016) many youth continue to find ways to evade these laws. For example, in 2016 7.7% of teens giving birth smoked. One option that pregnant teens may consider to reduce or quit cigarette smoking during their pregnancy is to use ENDS. If ENDS access is restricted by ENDS MLSA laws, then the ENDS MLSA laws could have unintended effect of reducing prenatal smoking cessation. The extent to which pregnant teens switch from cigarette smoking to ENDS, and the extent to which this switching is reduced by ENDS MLSAs, could indicate an unmet desire and need for smoking cessation assistance.
The objective of our paper is to evaluate the effect of ENDS MLSAs on prenatal smoking of traditional cigarettes and on birth outcomes. Our paper is the first to explore the effect of ENDS MLSAs on pregnant teens’ smoking. A previous study found that among adult pregnant women living in states that comprehensively banned indoor smoking of traditional cigarettes in public places, indoor vaping restrictions increased smoking in a given trimester by 2.0 percentage points (pp), or 31% of the mean. However, these indoor vaping restrictions had no measurable impact on birth outcomes including low birth weight, premature birth, small-for-gestational age, and Apgar 5 score (Cooper & Pesko, 2017).
The current paper revisits the important question of the impact of ENDS regulations on prenatal smoking and birth outcomes using ENDS MLSAs as an alternative source of policy variation, and focusing on pregnant teens. In addition, we look carefully at which demographic groups are most affected, and find that the effects are concentrated on rural teens. A second contribution of our paper is the use of longitudinal data to explore the effects of ENDS MLSAs on smoking. Four studies have explored this question using cross-sectional two-way fixed effects models, and there is some disagreement among the estimates. Three of these studies found that ENDS MLSAs increased teen smoking by approximately 0.8 to 1.0 pp (Dave, Feng, & Pesko, 2019; Friedman, 2015; Pesko, Hughes, & Faisal, 2016), while a fourth study used Monitoring the Future data and found that ENDS MLSAs decreased smoking participation of high school seniors by 2.0 pp (Abouk & Adams, 2017). At least one other study suggests that ENDS are complements with cigarettes, although within a sample of primarily adult cigarette smokers (Cotti, Nesson, & Tefft, 2018). Our study will help shed light on this issue using a longitudinal analysis.
A key assumption underlying our analysis is that in the absence of ENDS MLSA restrictions, prenatal smoking would have followed parallel trends in counties with and without such restrictions. We find that this parallel trends assumption is satisfied for rural areas, and that within these counties ENDS MLSAs increased smoking in a given trimester by 0.6 pp overall (4.8% of the mean). These effects are concentrated among teens who smoked in the 3 months prior to their pregnancy, suggesting that overall rates of prenatal smoking increased because of reduced smoking cessation rather than new smoking initiation. The parallel trends assumption is not satisfied for urban and suburban areas, suggesting that we can provide little insight on the effects of ENDS MLSAs in these areas. We also find little evidence that ENDS MLSAs affected birth outcomes in any setting, though that may reflect low power to detect effects.
Our focus on rural areas is important because rural areas account for a disproportionate share of teen pregnancies: 4.9% of rural 15 to 19 year old females give birth compared to 3.8% in urban areas and 2.4% in suburban areas. Additionally, since 2007, the rate of teen births has fallen more slowly in rural counties than in urban and suburban counties, so the gap in teen birth rates between rural and urban areas is increasing (Hamilton, Rossen, & Branum, 2016). Prenatal smoking rates are also much higher among rural underage pregnant teens—in 2010 13.7% of rural underage pregnant teens smoked compared to 8.8% in suburban areas and 2.9% in urban areas.1 Therefore, our focus on rural areas captures a disproportionate share of teen prenatal smokers.
Background
Pregnant women have a high interest in quitting smoking: 55% of women smoking 3 months before their pregnancy are successfully able to quit smoking during their pregnancy (Centers for Disease Control and Prevention, 2015). One study estimated a relatively high cigarette tax elasticity of demand among pregnant women smokers of 1.0 (Colman, Grossman, & Joyce, 2003). Despite these high rates of successful quitting during pregnancy, the healthcare delivery system may not be assisting with smoking cessation during pregnancy as well as it could. According to data from four states in the 2009–2010 Pregnancy Risk Assessment Monitoring System, 75.4% of pregnant women receiving prenatal care and still smoking in the third trimester had been offered counseling, self-help materials, or referral to a state quitline, but only 19.1% had been specifically advised to use nicotine replacement therapy (NRT) (Kapaya, Tong, & Ding, 2015). The low rate of NRT prescribing for pregnant women may be because nicotine is a developmental toxicant that in itself could harm the fetus.2 However, potential harms to the fetus from NRT should be compared to potential benefits to the fetus from reduced prenatal smoking. A recent randomized controlled trial found some evidence (p<0.10) of reductions in prenatal smoking from nicotine patches, and no changes in birth outcomes (Coleman et al., 2012); however, the precision of the estimates was significantly limited by low sample sizes and low rates of compliance with the treatment regime. It is also possible that the use of NRT during pregnancy could reduce the infant’s post-natal exposure to second hand smoke, but this hypothesis is untested.
If pregnant women are unsatisfied with the services they are receiving for smoking cessation through prenatal care, including the lack of nicotine replacement therapy prescribing, or if these services are not available, they may look elsewhere for help in quitting. Evidence from a systematic review of randomized controlled trials suggests that ENDS may be effective in eliminating and reducing cigarette consumption (Hartmann-Boyce et al., 2016). Given low utilization of nicotine replacement therapy among pregnant women, it is possible that pregnant women may disproportionately look to ENDS to reduce cigarette consumption.
Data on ENDS use among pregnant women is limited. The nationally-representative 2013–14 Population Assessment of Tobacco and Health interviewed 388 adult pregnant women, and of these 13.8% currently smoked, 4.9% currently vaped, and 28.5% of current smokers also vaped (Kurti et al., 2017). Among women of reproductive age in the same survey, 20.1% currently smoked, 5.9% currently vaped, and 22.5% of current smokers also vaped (Lopez et al., 2018). These numbers may provide suggestive evidence of interest among pregnant women in using ENDS for smoking cessation because while the use of both products fell during pregnancy, cigarette use fell much more substantially (by approximately 40%) than ENDS use rates (approximately 17%). Additionally, among smokers, ENDS use rates were higher for pregnant women than other comparable women (29.2% compared to 22.5%), perhaps because pregnant women were more likely to try to use ENDS to reduce or quit smoking. One small randomized controlled trial of pregnant women in Connecticut and Massachusetts who were unable to quit smoking on their own found that 14% vaped during pregnancy, usually in an effort to try to quit (Oncken et al., 2017).
Among teens generally, according to two national surveys, 2014 was the first year that more teens vaped ENDS over the past 30 days than smoked cigarettes (Arrazola et al., 2015; Miech, Johnston, O’Malley, Bachman, & Schulenberg, 2014). In response to rising ENDS use among youth, states have enacted ENDS MLSAs to reduce access to ENDS. MLSAs mimic laws that have long been in place in all states to reduce youth access to conventional tobacco products. ENDS MLSAs have been rolled out slowly over time. Five states had passed ENDS MLSAs by the end of 2010, 7 by the end of 2011, 12 by the end of 2012, 24 by the end of 2013, 39 by the end of 2014, and 47 by the end of 2015. By the end of 2016 all states had MLSAs in place because the Food and Drug Administration’s Deeming Rule imposed an ENDS MLSA law of 18 nationally. At this point, only Pennsylvania had not yet passed a state law (Centers for Disease Control and Prevention, 2018), although Philadelphia passed one in 2014 (New Jersey Global Advisors Smokefree Policy, 2015). Perhaps due to ENDS MLSA laws, ENDS use rates fell in 2016 after having risen each year since 2011 (Wang et al., 2018).
Racial/ethnic groups in rural areas could respond differently to ENDS MLSAs given heterogeneity in both tobacco use rates and in prenatal care utilization. According to National Youth Tobacco Survey data from 2011–2015, the past 30-day vaping rate for rural female middle and high school students was 4.0% for white non-Hispanic teen females, 4.3% for black non-Hispanic teen females, and 3.6% for Hispanic teen females. According to birth records for 2010, the prenatal smoking rate was substantially higher for rural white underage teens (21.1%) than for rural black underage teens (3.1%) or for rural Hispanic underage teens (2.4%). Prenatal smoking rates were highest for teens with Medicaid (16.8%) compared to private insurance (13.1%) or no insurance (7.8%). Thirteen percent of rural underage teens giving birth for the first time smoked during pregnancy, and 18.6% smoked among those giving birth for the second time or more.
Data
We use administrative birth records with geocoded information provided by the National Center for Health Statistics. The Standard Certificate of Live Birth was revised in 2003 and the revised form was slowly rolled out in different states over time.3 The old form asked only about smoking at any time during pregnancy. The revised form asks about smoking prior to pregnancy and in each trimester. The accuracy of cigarette use during pregnancy is significantly improved in the revised form relative to the old form. For example, Howland et al. (2015) find that with the old form, maternal smoking agreed with hospital records 84% of the time, but this agreement improved to 94% with the revised form.
The introduction of the revised birth record form resulted in statistically significant increases in reported prenatal smoking in 21 out of 31 states, suggesting that the old form underreported smoking compared to the revised (Curtin & Mathews, 2016). In addition to the improved accuracy of the revised form, the collection of trimester-specific smoking information permits us to exploit within-pregnancy variation in cigarette use in response to ENDS MLSAs in a panel data analysis. Figure 1 shows the question capturing cigarette use information as it appears on the revised birth record form.4 Unfortunately, no information about vaping is currently collected for birth records.
Figure 1:
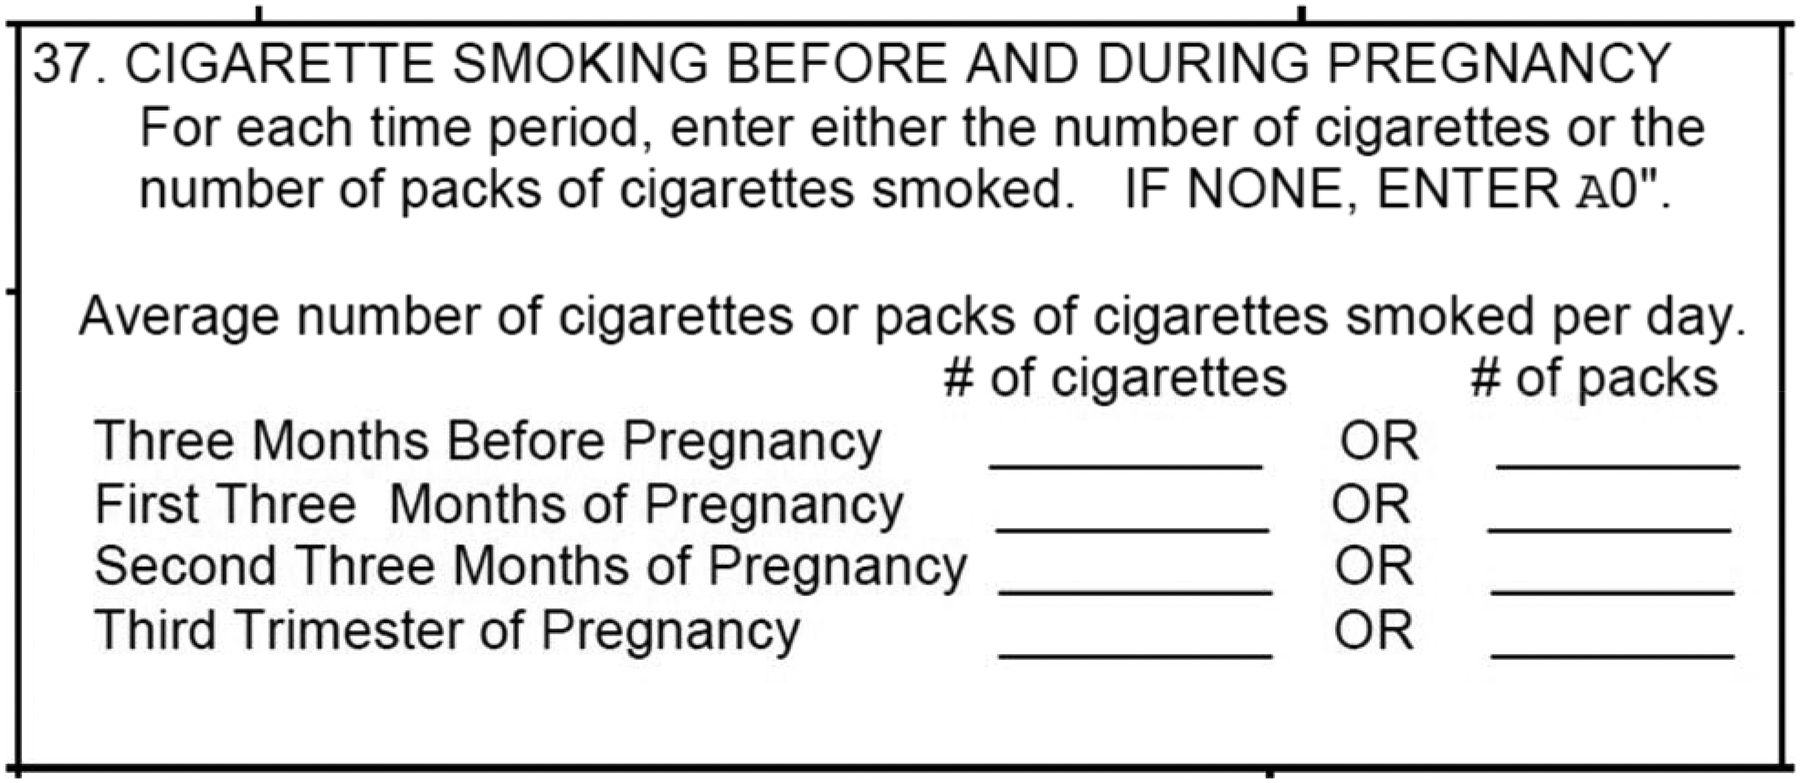
Cigarette Question from Revised Birth Record
We use revised birth records data from 32 states (including D.C.) from 2010 to 2016.5 We exclude individuals residing in or giving birth in 16 states that had not adopted revised birth records by 2010; however, in a sensitivity analysis we add back seven of these states that had adopted by 2013.6 Further, we exclude Georgia and Michigan because information about cigarette use was missing for multiple years. Finally, we exclude Massachusetts because an unusually large number of ENDS laws were enacted at the city/town levels (New Jersey Global Advisors Smokefree Policy, 2015).
We perform our analysis using teens giving birth before their 18th birthday, so that they were younger than the ENDS MLSA throughout the full length of their pregnancy. We further restrict our sample to those teens whose estimated conception date (16 days after pregnancy week 0 or last menstrual period) was between 1/1/2010 and 1/1/2016.7 We exclude non-singleton births and a small number of birth certificates with unknown gestational length.
We match ENDS MLSAs to the start of each trimester for our panel data analysis of prenatal smoking, or to the start of conception for our cross-sectional analysis of birth outcomes.8 We obtain implementation dates of ENDS MLSAs at the state-level from the CDC State System (Centers for Disease Control and Prevention, 2018) and from the National Conference of State Legislatures (National Conference of State Legislatures, 2016). We obtained county-level MLSAs from a white paper (New Jersey Global Advisors Smokefree Policy, 2015). Appendix Table 1 shows the states in our sample and the dates of their respective ENDS MLSAs. It also shows all county-level ENDS MLSAs that we used in our analysis. Appendix Figure 1 shows maps of the states and counties adopting the ENDS MLSAs at different points in time.9
Counties where the birth occurred are identified as urban/suburban or rural using the 2013 Urban-Rural Classification Scheme for Counties (Centers for Disease Control and Prevention, 2013). This ordinal, six-level scheme codes counties as (1) large central metro, (2) large fringe metro, (3) medium metro, (4) small metro, (5) micropolitan, and (6) noncore. Counties coded level 1 were classified as urban, counties coded levels 2–4 were classified as suburban, and counties coded levels 5 and 6 were classified as rural.
We control for other tobacco control policies including cigarette tax rates and indoor smoking and vaping restrictions in private workplace, bars, and restaurants. We match these controls to the point of conception for our cross-sectional analysis, or to the start of the trimester for our panel data analysis. We obtained state-level cigarette policy data (taxes and indoor air laws) from the CDC State System (Centers for Disease Control and Prevention, 2018).10 For the ENDS indoor vaping restrictions, we obtained state, county, and municipality information from the American Non-Smokers Rights Foundation, which we used to calculate the percent of the population covered by bans on vaping in private workplaces, bars, and restaurants (Cooper & Pesko, 2017).
Descriptive statistics are reported in Table 1 for all underage pregnant teens and in Appendix Table 2 for only rural underage pregnant teens. The first columns show descriptive statistics for pregnant teens for whom an ENDS MLSA was not in place at any point during the pregnancy, the second columns show descriptive statistics for pregnant teens for whom an ENDS MLSA came into place between 3 months prior to conception and birth, and the third columns show descriptive statistics for pregnant teens from whom an ENDS MLSA was in place before 3 months prior to conception. Smoking rates were lowest in each trimester of pregnancy for mothers who were fully treated by ENDS MLSA laws, but since these records are more recent on average, this decline could be due to general declines in prenatal smoking rates over time. Table 1 shows that among teens who smoked in the three months prior to pregnancy, 55.1% of treated teens were still smoking in the third trimester of pregnancy compared to 54.5% of partially treated teens, and 51.5% of fully treated teens. These statistics suggest that ENDS MLSAs decreased prenatal smoking cessation. Appendix Table 2 shows that in rural areas, smoking rates were lower for partially treated and fully treated teens than for non-treated teens.
Table 1:
Descriptive Statistics from Birth Records, 2010–2016
| No Treatment | Partial Treatment | Full Treatment | ||||
|---|---|---|---|---|---|---|
| mean | sd | mean | sd | mean | sd | |
| Smoking Participation Before Pregnancy | 0.098 | 0.297 | 0.077 | 0.266 | 0.066 | 0.248 |
| Smoking Participation in First Trimester | 0.072 | 0.259 | 0.057 | 0.231 | 0.048 | 0.214 |
| Smoking Participation in Second Trimester | 0.058 | 0.234 | 0.045 | 0.207 | 0.037 | 0.189 |
| Smoking Participation in Third Trimester | 0.054 | 0.227 | 0.042 | 0.201 | 0.034 | 0.181 |
| White non-Hispanic | 0.330 | 0.470 | 0.290 | 0.454 | 0.269 | 0.443 |
| Black non-Hispanic | 0.211 | 0.408 | 0.182 | 0.386 | 0.157 | 0.364 |
| Hispanic | 0.425 | 0.494 | 0.479 | 0.500 | 0.518 | 0.500 |
| Other non-Hispanic or Missing | 0.034 | 0.181 | 0.049 | 0.216 | 0.056 | 0.231 |
| 14 or younger | 0.040 | 0.197 | 0.038 | 0.190 | 0.036 | 0.186 |
| 15 | 0.122 | 0.327 | 0.115 | 0.319 | 0.116 | 0.320 |
| 16 | 0.292 | 0.455 | 0.295 | 0.456 | 0.292 | 0.454 |
| 17 | 0.546 | 0.498 | 0.552 | 0.497 | 0.556 | 0.497 |
| Medicaid | 0.745 | 0.436 | 0.767 | 0.422 | 0.776 | 0.417 |
| Private Insurance | 0.142 | 0.349 | 0.147 | 0.354 | 0.157 | 0.363 |
| Self-pay | 0.049 | 0.216 | 0.037 | 0.189 | 0.026 | 0.159 |
| Indian Health Service | 0.002 | 0.040 | 0.001 | 0.032 | 0.000 | 0.022 |
| CHAMPUS/TRICARE | 0.002 | 0.049 | 0.003 | 0.054 | 0.003 | 0.056 |
| Other government insurance | 0.008 | 0.090 | 0.016 | 0.124 | 0.018 | 0.132 |
| Other | 0.040 | 0.195 | 0.022 | 0.147 | 0.009 | 0.096 |
| Unknown | 0.012 | 0.110 | 0.007 | 0.083 | 0.011 | 0.102 |
| Mother’s birth count (living and dead) | 1.142 | 0.408 | 1.130 | 0.391 | 1.123 | 0.384 |
| Urban | 0.343 | 0.475 | 0.384 | 0.486 | 0.399 | 0.490 |
| Suburban | 0.472 | 0.499 | 0.464 | 0.499 | 0.486 | 0.500 |
| Rural | 0.185 | 0.388 | 0.152 | 0.359 | 0.115 | 0.318 |
| Birth weight (in grams) | 3153.591 | 549.139 | 3166.348 | 547.130 | 3176.513 | 546.175 |
| Low Birth Weight (<2500 grams) | 0.089 | 0.285 | 0.084 | 0.278 | 0.082 | 0.274 |
| Very Low Birth Weight (<1500 grams) | 0.015 | 0.123 | 0.015 | 0.121 | 0.014 | 0.119 |
| Gestation Length (in weeks) | 38.510 | 2.823 | 38.550 | 2.758 | 38.624 | 2.652 |
| Premature Birth (<37 weeks) | 0.145 | 0.352 | 0.137 | 0.344 | 0.125 | 0.331 |
| Very Premature Birth (<32 weeks) | 0.028 | 0.164 | 0.026 | 0.159 | 0.024 | 0.153 |
| Apgar 5 Score | 8.724 | 0.944 | 8.761 | 0.891 | 8.785 | 0.838 |
| Small for Gestational Age (<=25th Percentile) | 0.320 | 0.466 | 0.313 | 0.464 | 0.313 | 0.464 |
| Weight Gain During Pregnancy (in pounds) | 32.151 | 15.745 | 32.015 | 15.751 | 31.511 | 15.722 |
| ENDS MLSA | 0.000 | 0.000 | 0.328 | 0.469 | 1.000 | 0.000 |
| Cigarette taxes ($) | 1.388 | 0.736 | 1.354 | 0.895 | 1.329 | 1.016 |
| Cigarette private workplace indoor use law: None | 0.419 | 0.493 | 0.238 | 0.426 | 0.046 | 0.208 |
| Cigarette private workplace indoor use law: Partial | 0.091 | 0.288 | 0.294 | 0.456 | 0.466 | 0.499 |
| Cigarette private workplace indoor use law: Full | 0.490 | 0.500 | 0.469 | 0.499 | 0.489 | 0.500 |
| Cigarette restaurant indoor use law: None | 0.417 | 0.493 | 0.238 | 0.426 | 0.046 | 0.208 |
| Cigarette restaurant indoor use law: Partial | 0.173 | 0.378 | 0.338 | 0.473 | 0.533 | 0.499 |
| Cigarette restaurant indoor use law: Full | 0.411 | 0.492 | 0.425 | 0.494 | 0.421 | 0.494 |
| Cigarette bar indoor use law: None | 0.646 | 0.478 | 0.432 | 0.495 | 0.232 | 0.422 |
| Cigarette bar indoor use law: Partial | 0.052 | 0.223 | 0.259 | 0.438 | 0.439 | 0.496 |
| Cigarette bar indoor use law: Full | 0.301 | 0.459 | 0.309 | 0.462 | 0.329 | 0.470 |
| ENDS private workplace indoor use law: percent of population affected | 0.006 | 0.068 | 0.027 | 0.152 | 0.089 | 0.259 |
| ENDS restaurant indoor use law: percent of population affected | 0.006 | 0.069 | 0.028 | 0.152 | 0.101 | 0.267 |
| ENDS bar indoor use law: percent of population affected | 0.006 | 0.068 | 0.021 | 0.132 | 0.094 | 0.258 |
| Observations | 194690 | 37346 | 94946 | |||
Population of women giving birth <18 years of age from 32 states meeting inclusion criteria. Policy variables are as of the start of the first trimester.
We also provide descriptive statistics for outcomes (birth weight, low birth weight, very low birthweight, gestational length premature birth, very premature birth, APGAR 5 score, small-for-gestational age, and weight gain during pregnancy), demographic variables (race/ethnicity, age, health insurance, and order of birth) and tobacco control policies (cigarette taxes and cigarette/ENDS indoor air laws), all of which could be correlated with both adoption of ENDS MLSA laws and with prenatal smoking. Table 1 and Appendix Table 2 show that women who were partially or fully treated were more likely to be on Medicaid, less likely to be black, and less likely to have low birth weight and premature babies than mothers who were untreated. We control for differing maternal characteristics in our regressions by using either pregnancy fixed effects (for panel data models) or maternal characteristics (for cross-sectional models).
Methods
In our primary analysis, we exploit the impact of ENDS MLSAs on smoking during pregnancy using a panel data analysis. The panel data regressions have the following specification:
| (1) |
where icspt indexes period p (either the three months prior to pregnancy or in each trimester), for pregnant teen i living in county c of state s of year-month t in which the period began. The smoking dependent variable takes one of three forms: 1) any smoking during the period in question; 2) moderate or heavy smoking (average daily cigarettes smoked ≥ 5), and 3) heavy smoking (average daily cigarettes smoked ≥ 10). By comparing the effect of ENDS MLSA laws on different intensities of smoking we can ask whether there was heterogeneity in the effects of the laws on different types of smokers.
We control for pregnancy fixed effects (Ɣi) in order to remove individual-level heterogeneity and we control for trimester-by-year-by-month fixed effects (Ɣpt) in order to remove heterogeneity unique to trimesters starting at different points in time. From the start of the period p, we also control for time-varying tobacco control policies including cigarette taxes, smoking indoor use laws in private workplaces, restaurants, and bars11, and the percent of the population covered by vaping indoor use laws for the same three locations. Our coefficient of primary interest is β1 which shows how ENDS MLSAs that were enacted during a given pregnancy caused changes in cigarette use beyond the normal declines expected as pregnancy progresses. We expect this relationship to be positive if ENDS are substitutes for traditional cigarette use, and negative if they are complements. We do not control for county fixed effects because we only observe one location per pregnancy; therefore, pregnancy fixed effects control for location.
We also modify equation (1) to perform an event study (Autor, 2003) to ask whether our results are impacted by time varying omitted variables bias. We replace the previous ENDS MLSA indicator variable with a set of mutually exclusive policy leads and lags that divide the time period into these categories: trimester started >30 months before the MLSA was passed, 21–30 months before, 12–21 months before, 3–12 months before (reference), 0–3 months before (e.g. law was passed within this trimester), 0–9 months after, and >9 months after. Outside of including these mutually exclusive policy leads and lags instead of the standard DD variable, the resulting equation is identical to (1). In this event study specification, the policy leads provide evidence about whether within-pregnancy smoking rates were changing among pregnant teens prior to passage of ENDS MLSAs, which would suggest time-varying omitted variables bias or anticipatory behaviors.
We estimate separate models for pre-pregnancy smokers and pre-pregnancy non-smokers. Given that women are highly motivated to quit smoking during pregnancy, we hypothesize that ENDS MLSA laws will have no effect on smoking initiation among pre-pregnancy non-smokers. Instead, we expect to find all of the effect of ENDS MLSAs concentrated among teens who were smoking prior to their pregnancy. We hypothesize that these teens may try to use ENDS as a smoking cessation product. Nicotine replacement therapy is only available via a prescription and many healthcare providers are reluctant to prescribe it to pregnant patients; therefore, in the absence of an ENDS MLSA law, the pregnant teen smoker may be highly incentivized to legally buy an ENDS to try to use it for prenatal smoking cessation. When that opportunity is eliminated by an ENDS MLSA law, the pregnant teen may be more likely to continue to prenatally smoke. By focusing on the effect of ENDS MLSAs separately for pre-pregnancy smokers and non-smokers, we hope to shed light on this possible mechanism.
We also estimate separate models for groups defined by demographic characteristics and urban/rural location, since these groups may be expected to have different access to prenatal care and smoking cessation services. First, we estimate stratified models by urban/suburban and then rural counties to investigate the crucial identifying assumption of parallel trends in smoking for the treatment and control groups prior to the passage of ENDS MLSAs. We find evidence of parallel pre-trends only for rural counties, suggesting that there were unobserved factors affecting teens differentially in urban/suburban areas adopting ENDS MLSAs.
One possible explanation for the diverging trends for urban/suburban counties, is that the composition of teen births was rapidly changing in the former but not for rural counties. This hypothesis is explored in Appendix Tables 3 and 4. In Appendix Table 3, we find that ENDS MLSAs were associated with more births to underage teens in urban and suburban counties, but not in rural counties. In Appendix Table 4, we show that underage teen birth rates were diverging between urban/suburban and rural counties leading up to passage of ENDS MLSA laws. The two policy lead coefficients are jointly significant, p=0.083 for urban counties and p=0.006 for suburban counties. Individual coefficients for suburban counties are also both statistically significant. For rural counties, however, trends appear to be parallel based on the small individual coefficients for the policy leads and the joint test of significance.
Appendix Table 3 shows that ENDS MLSAs were associated with 5.0 extra underage teen births per county-by-year/month in urban counties (13.5% of the mean p<0.05), 0.3 extra teen births in suburban counties (6.1% of the mean, p<0.01), but only 0.02 extra teen births in rural counties (1.2% of the mean, not statistically significant). These compositional differences may bias the effect of ENDS MLSAs on prenatal smoking. Taken together, these estimates suggest that changes on the composition of teens giving birth in urban/suburban counties make it difficult to measure the impact of ENDS MLSA laws on prenatal smoking. However, we did not detect evidence of compositional changes in rural counties, nor did we detect evidence of non-parallel trends for rural counties; therefore, we focus on rural counties for the remaining analyses.12 We also stratify rural counties by white non-Hispanics, black non-Hispanics, Hispanics, first births, and mothers on Medicaid given that these populations have different prenatal tobacco use rates and prenatal healthcare utilization.
Finally, we also estimate the effects of ENDS MLSAs on birth outcomes in a cross-sectional DD specification. We cannot use a panel data analysis for birth outcomes since we have just one birth outcome per pregnancy (compared to four smoking observations per pregnancy). For this analysis, we estimate the following equation:
| (2) |
In equation (2) individual fixed effects are replaced with a vector of individual characteristics including: mother’s race, age dummies (≤14, 15, 16, 17), payment source (e.g. Medicaid, private insurance, self pay)13, and the birth order of her current birth (1, 2, […] 7, ≥8). We continue to control for cigarette taxes as well as indoor air laws affecting cigarettes and ENDS use in restaurants, bars, and private workplaces (from point of gestation). We also control for month-year of gestation and county fixed effects. The birth outcomes that we model are continuous birthweight, low birthweight (<2,500 grams), very low birth weight (<1,500 grams), weeks of gestation, premature birth (<37 weeks), very premature birth (<32 weeks), small-for-gestational age (25th percentile weight for a given length of gestation), Apgar 5 score, and weight gain during pregnancy.
The coefficient of primary interest β1 from equation (2) represents an average of two competing effects. β1 could suggest worse birth outcomes if ENDS MLSAs cause more pregnant teens to smoke and if smoking is more dangerous than vaping to the developing fetus. Alternatively, β1 could suggest better birth outcomes if ENDS MLSAs increase complete abstinence from nicotine by reducing stand-alone vaping. Hence, the net effect of ENDS MLSAs on birth outcomes is ambiguous and requires empirical investigation. ENDS indoor vaping restrictions were found to have no effect on birth outcomes for adult pregnant women, potentially because these effects cancelled each other out (Cooper & Pesko, 2017). The current paper provides an opportunity to explore the effect of a different type of ENDS regulation on birth outcomes, and extends the literature by looking at the effects on rural teens, a group who are often neglected.
All regressions are estimated using linear models. Standard errors are clustered at the level of the county given that this is the lowest geographical level at which ENDS MLSAs were adopted; however, for our difference-in-difference model results we also present p-values clustering by health service areas (HSAs), which are defined by the National Center for Health Statistics to be 808 groups of single counties or cluster of contiguous counties which are relatively self-contained with respect to hospital care.14
This alternative clustering at the HSA level is intended to capture omitted factors due to the available health care. Since it is possible that there might also be common factors at the state level, (though we have tried to control for some of these by considering other policies, like taxes, that occur at the state level), we have presented two additional analyses (Appendix Tables 6 and 7) that use alternative clustering at the state level. In Appendix Table 6, we added back 7 states that had revised their birth records by 2013 and performed the analysis from 2013–2016. In Appendix Table 7, we estimate models starting from 2010 but relax the restriction used in our baseline models that states must have revised by 2010. This change increases the number of clusters to 48. The coefficients are quite stable across these two models, and with a larger number of clusters we find statistically significant estimates at p<0.10, for rural smoking participation when using the sample from 2013–2016 and for rural white smoking participation when using the sample from 2010–2016 and allowing late entrants.15
Results
The top of Table 2 shows results from equation (1) using smoking participation within a given period (3 months before pregnancy or in a given trimester) as our outcome. Overall, Table 2 shows that the passage of ENDS MLSAs is associated with increases in within-pregnancy smoking participation by a modest 0.2 pp for all pregnant teens (p<0.05, 3.2% of the mean). This significant effect is driven by a 0.6 pp increase in smoking for rural pregnant teens (p<0.05, 4.8% of the mean). In the rural sample, white pregnant teens increased smoking by 4.4% of the mean (p<0.10), black pregnant teens increased smoking by 11.1% of the mean (p>0.10), pregnant teens on Medicaid increased smoking by 4.5% (p<0.05), and teens giving birth for the first time increased smoking by 4.3% (p<0.10).
Table 2:
Smoking, Longitudinal, DD
| (1) | (2) | (3) | (4) | (5) | (6) | (7) | (8) | |
|---|---|---|---|---|---|---|---|---|
| All | Urban/Suburban | Rural | Rural, White NH | Rural, Black NH | Rural, Hispanic | Rural, Medicaid | Rural, First Birth | |
| Smoking | 0.002* | 0.001 | 0.006* | 0.008* | 0.005 | −0.001 | 0.006* | 0.005+ |
| Participation | (0.001) | (0.001) | (0.003) | (0.004) | (0.009) | (0.003) | (0.003) | (0.003) |
| Obs | 1,313,612 | 1,103,072 | 210,540 | 125,320 | 13,968 | 56,416 | 160,456 | 187,924 |
| MLSA Law Mean | 0.346 | 0.362 | 0.259 | 0.284 | 0.239 | 0.204 | 0.263 | 0.261 |
| Dep. Var. Mean | 0.062 | 0.050 | 0.125 | 0.180 | 0.045 | 0.026 | 0.133 | 0.117 |
| Adjusted R^2 | 0.027 | 0.023 | 0.048 | 0.063 | 0.026 | 0.019 | 0.047 | 0.048 |
| # Clusters | 1998 | 700 | 1298 | 1259 | 496 | 910 | 1258 | 1292 |
| Alt. Cluster p-value | 0.037 | 0.247 | 0.027 | 0.047 | 0.540 | 0.853 | 0.060 | 0.084 |
| Alt. # Clusters | 562 | 290 | 486 | 483 | 289 | 429 | 485 | 486 |
| >=5 Cigarettes Daily | 0.004** | 0.003** | 0.005+ | 0.006 | 0.007 | −0.002 | 0.006+ | 0.004 |
| (0.001) | (0.001) | (0.003) | (0.004) | (0.008) | (0.003) | (0.003) | (0.003) | |
| Obs | 1,313,612 | 1,103,072 | 210,540 | 125,320 | 13,968 | 56,416 | 160,456 | 187,924 |
| MLSA Law Mean | 0.346 | 0.362 | 0.259 | 0.284 | 0.239 | 0.204 | 0.263 | 0.261 |
| Dep. Var. Mean | 0.045 | 0.035 | 0.094 | 0.141 | 0.027 | 0.014 | 0.101 | 0.088 |
| Adjusted R^2 | 0.025 | 0.021 | 0.048 | 0.068 | 0.027 | 0.015 | 0.049 | 0.048 |
| # Clusters | 1998 | 700 | 1298 | 1259 | 496 | 910 | 1258 | 1292 |
| Alt. Cluster p-value | 0.002 | 0.010 | 0.114 | 0.147 | 0.385 | 0.541 | 0.074 | 0.206 |
| Alt. # Clusters | 562 | 290 | 486 | 483 | 289 | 429 | 485 | 486 |
| >=10 Cigarettes | 0.003* | 0.002+ | 0.003 | 0.006 | 0.003 | −0.002 | 0.003 | 0.002 |
| Daily | (0.001) | (0.001) | (0.003) | (0.004) | (0.007) | (0.003) | (0.003) | (0.003) |
| Obs | 1,313,612 | 1,103,072 | 210,540 | 125,320 | 13,968 | 56,416 | 160,456 | 187,924 |
| MLSA Law Mean | 0.346 | 0.362 | 0.259 | 0.284 | 0.239 | 0.204 | 0.263 | 0.261 |
| Dep. Var. Mean | 0.030 | 0.023 | 0.066 | 0.101 | 0.015 | 0.009 | 0.072 | 0.061 |
| Adjusted R^2 | 0.024 | 0.020 | 0.047 | 0.068 | 0.022 | 0.015 | 0.049 | 0.046 |
| # Clusters | 1998 | 700 | 1298 | 1259 | 496 | 910 | 1258 | 1292 |
| Alt. Cluster p-value | 0.028 | 0.090 | 0.276 | 0.117 | 0.678 | 0.531 | 0.393 | 0.382 |
| Alt. # Clusters | 562 | 290 | 486 | 483 | 289 | 429 | 485 | 486 |
Standard errors in parentheses
Population of women giving birth <18 years of age that were conceived between 1/1/2010 and 1/1/2016. We control for pregnancy fixed effects, trimester-by-year-by-month fixed effects, cigarette taxes, and cigarette and ENDS indoor air laws in bars, private workplaces, and restaurants. Standard errors are clustered at the level of county, and alternative p-values are provided for clustering at the level of health service area.
p < 0.1,
p < 0.05,
p < 0.01,
p < 0.001
The middle section of Table 2 shows that ENDS MLSAs increased moderate and heavy smoking in rural areas by 0.5 pp (5.3%, p<0.10), which is similar to the 0.6 pp increase (4.8%) found for any smoking. The bottom section suggests a 0.3 pp increase in heavy smoking (p>0.10, 4.5% of the mean). The similarities in these percent reductions suggests that ENDS MLSAs increased cigarette use among all type of smokers.
Table 3 and Figure 2 shows disaggregated difference-in-difference event study results for any smoking participation. These estimates ask whether within-pregnancy smoking patterns were changing in the time period leading up to or after ENDS MLSA adoption. We also show the same event study coefficients graphically in Figure 2 and in Appendix Figure 2 and 3. This specification shows evidence of non-parallel trends for all teens and for urban/suburban pregnant teens, since the coefficients on the three policy leads are jointly statistically significant for all pregnant teens (p=0.020) and for urban/ suburban pregnant teens (p=0.016). The direction of the coefficients suggests that traditional cigarette use was declining in the pre-adoption period for the treatment group relative to the control group, suggesting that the positive but small DD coefficients we observe in Table 2 are actually underestimated. As discussed earlier, these non-parallel trends may be driven by changes in the composition of who gives birth before and after ENDS MLSAs came into place.
Table 3:
Smoking, Longitudinal, Event Study
| (1) | (2) | (3) | (4) | (5) | (6) | (7) | (8) | |
|---|---|---|---|---|---|---|---|---|
| All | Urban/Suburban | Rural | Rural, White NH | Rural, Black NH | Rural, Hispanic | Rural, Medicaid | Rural, First Birth | |
| Trim. Started >30 | 0.013** | 0.011* | 0.004 | −0.003 | −0.005 | 0.002 | 0.007 | 0.003 |
| Months Before MLSA=1 | (0.005) | (0.004) | (0.005) | (0.007) | (0.012) | (0.007) | (0.006) | (0.005) |
| Trim. Started 21–30 | 0.009** | 0.008** | −0.000 | −0.006 | −0.006 | 0.002 | 0.002 | −0.002 |
| Months Before MLSA=1 | (0.003) | (0.003) | (0.004) | (0.006) | (0.010) | (0.006) | (0.005) | (0.004) |
| Trim. Started 12–21 | 0.005** | 0.005** | −0.000 | −0.003 | 0.001 | 0.001 | −0.001 | −0.001 |
| Months Before MLSA=1 | (0.002) | (0.002) | (0.003) | (0.004) | (0.007) | (0.004) | (0.003) | (0.003) |
| Trim. Started 0–3 | 0.001 | 0.001 | 0.003 | 0.004 | 0.013+ | 0.003 | 0.004 | 0.002 |
| Months Before MLSA=1 | (0.001) | (0.001) | (0.003) | (0.004) | (0.007) | (0.003) | (0.003) | (0.003) |
| Trim. Started 0–9 | 0.002 | 0.001 | 0.008* | 0.011* | 0.015 | 0.001 | 0.008+ | 0.006 |
| Months After MLSA=1 | (0.001) | (0.002) | (0.004) | (0.005) | (0.011) | (0.004) | (0.004) | (0.004) |
| Trim. Started >9 | −0.000 | −0.001 | 0.000 | 0.010 | 0.028* | −0.005 | −0.001 | −0.002 |
| Months After MLSA=1 | (0.003) | (0.003) | (0.006) | (0.008) | (0.014) | (0.007) | (0.006) | (0.006) |
| Obs | 1,313,612 | 1,103,072 | 210,540 | 125,320 | 13,968 | 56,416 | 160,456 | 187,924 |
| MLSA Law Mean | 0.346 | 0.362 | 0.259 | 0.284 | 0.239 | 0.204 | 0.263 | 0.261 |
| Dep. Var. Mean | 0.062 | 0.050 | 0.125 | 0.180 | 0.045 | 0.026 | 0.133 | 0.117 |
| Adjusted R^2 | 0.027 | 0.023 | 0.048 | 0.063 | 0.026 | 0.019 | 0.047 | 0.048 |
| # Clusters | 1998 | 700 | 1298 | 1259 | 496 | 910 | 1258 | 1292 |
| Policy Lead Joint p-Value | 0.020 | 0.016 | 0.482 | 0.540 | 0.871 | 0.979 | 0.410 | 0.427 |
Standard errors in parentheses
Population of women giving birth <18 years of age that were conceived between 1/1/2010 and 1/1/2016. We control for pregnancy fixed effects, trimester-by-year-by-month fixed effects, cigarette taxes, and cigarette and ENDS indoor air laws in bars, private workplaces, and restaurants. Standard errors are clustered at the level of county.
p < 0.1,
p < 0.05,
p < 0.01,
p < 0.001
Figure 2:

Smoking, Longitudinal, Event Study
Results are also presented in Table 3.
For rural pregnant teens, coefficients in the pre-adoption period are all individually and jointly statistically insignificant. The coefficients are estimated to be zero in the two periods of time leading up to ENDS MLSA adoption. This result provides evidence that the parallel trends assumption is satisfied for rural pregnant teens, giving us confidence that the 0.6 pp increase in within-pregnancy smoking we observed for rural pregnant teens in Table 2 is not biased by uncontrolled time-varying heterogeneity.
The coefficients in the post period suggest a particularly persistent effect for black teens. For black teens, smoking participation increased by 1.3 pp (p<0.10) in the trimester in which the ENDS MLSA came into effect (compared to 3–12 months before), by 1.5 pp (p>0.10) in the trimester starting 0–9 months after the ENDS MLSA came into effect, and by 2.8 pp (p<0.05) in trimesters >9 months after the ENDS MLSA came into effect. However, the period of time >9 months after MLSA should be interpreted cautiously because late adopting counties do not contribute variation to this coefficient. Rural white teens also experienced approximately a 1.0 pp increase in smoking participation in the periods 0–9 months after the ENDS MLSA came into effect and >9 months after.
In Appendix Table 6, we re-estimate the difference-in-difference model using the time period starting in 2013 rather than 2010. This permits us to add in seven states that revised their birth record form between 2010–2013 (see Appendix Table 1 for a list of these states), three of which enacted MLSAs before 2013 and four of which enacted MLSAs during or after 2013, providing 39 states in total. ENDS MLSAs may have a larger effect on smoking during pregnancy in this period since ENDS were generally more popular in the later period, with their use peaking in 2015 before declining in 2016 (Wang et al., 2018).16 We do find a slightly higher but generally comparable point estimate of 0.7 pp increase in smoking for rural underage pregnant women when using the sample from 2013–2016 compared to a 0.6 pp increase when using the sample from 2010–2016.
In Appendix Table 7, we revert to starting the analysis in 2010 but do not impose the restriction that states needed to revise their birth records by that point in time. This increases our number of states to 48 (44 of which have rural counties). Three of the nine additional states we added from the analysis in Appendix Table 6 adopted ENDS MLSAs after revising their birth records. The sample sizes increased from 210,540 pregnancy-period observations in Table 2 to 273,184 pregnancy-period observations in Appendix Table 7, but the effects for rural women (0.6 pp) and rural, white women (0.8 pp) remain exactly the same. The estimates did change from 0.5 pp to −0.0 pp for rural black women, however, suggesting mixed evidence of the effect of ENDS MLSAs for this population.
Tables 4 and 5 stratify the baseline results (Table 2) by pregnant teens who smoked in the three months prior to their pregnancy and those who did not. If ENDS MLSAs affect prenatal smoking primarily by impacting smoking cessation rather than by affecting smoking initiation, then ENDS MLSAs will have no effect on traditional cigarette use among teens who were not already smoking prior to their pregnancies, but ENDS MLSAs could have large impacts on teens who were smoking prior to their pregnancies by affecting their ability to quit.
Table 4:
Smoking Among Smokers Prior to Pregnancy, Longitudinal, DD
| (1) | (2) | (3) | (4) | (5) | (6) | (7) | (8) | |
|---|---|---|---|---|---|---|---|---|
| All | Urban/Suburban | Rural | Rural, White NH | Rural, Black NH | Rural, Hispanic | Rural, Medicaid | Rural, First Birth | |
| Smoking | −0.001 | −0.010 | 0.025+ | 0.018 | 0.144 | −0.007 | 0.022 | 0.017 |
| Participation | (0.008) | (0.010) | (0.014) | (0.016) | (0.122) | (0.052) | (0.016) | (0.016) |
| Obs | 112,932 | 77,412 | 35,520 | 29,808 | 920 | 2,376 | 28,388 | 30,340 |
| MLSA Law Mean | 0.271 | 0.281 | 0.250 | 0.254 | 0.189 | 0.238 | 0.254 | 0.252 |
| Dep. Var. Mean | 0.713 | 0.703 | 0.734 | 0.752 | 0.678 | 0.603 | 0.747 | 0.722 |
| Adjusted R^2 | 0.325 | 0.337 | 0.299 | 0.278 | 0.442 | 0.471 | 0.283 | 0.312 |
| # Clusters | 1735 | 675 | 1060 | 993 | 158 | 316 | 1009 | 1035 |
| Alt. Cluster p-value | 0.879 | 0.333 | 0.100 | 0.263 | 0.250 | 0.898 | 0.196 | 0.272 |
| Alt. # Clusters | 549 | 288 | 467 | 453 | 128 | 229 | 456 | 464 |
| >=5 Cigarettes Daily | 0.016* | 0.019* | 0.012 | 0.010 | 0.106 | −0.044 | 0.017 | 0.005 |
| (0.008) | (0.009) | (0.015) | (0.017) | (0.120) | (0.058) | (0.017) | (0.016) | |
| Obs | 112,932 | 77,412 | 35,520 | 29,808 | 920 | 2,376 | 28,388 | 30,340 |
| MLSA Law Mean | 0.271 | 0.281 | 0.250 | 0.254 | 0.189 | 0.238 | 0.254 | 0.252 |
| Dep. Var. Mean | 0.517 | 0.500 | 0.555 | 0.591 | 0.401 | 0.335 | 0.570 | 0.541 |
| Adjusted R^2 | 0.302 | 0.307 | 0.293 | 0.292 | 0.426 | 0.326 | 0.283 | 0.305 |
| # Clusters | 1735 | 675 | 1060 | 993 | 158 | 316 | 1009 | 1035 |
| Alt. Cluster p-value | 0.035 | 0.040 | 0.425 | 0.561 | 0.384 | 0.437 | 0.323 | 0.733 |
| Alt. # Clusters | 549 | 288 | 467 | 453 | 128 | 229 | 456 | 464 |
| >=10 Cigarettes | 0.008 | 0.009 | 0.006 | 0.011 | −0.027 | −0.017 | 0.001 | 0.001 |
| Daily | (0.007) | (0.009) | (0.014) | (0.015) | (0.094) | (0.055) | (0.016) | (0.015) |
| Obs | 112,932 | 77,412 | 35,520 | 29,808 | 920 | 2,376 | 28,388 | 30,340 |
| MLSA Law Mean | 0.271 | 0.281 | 0.250 | 0.254 | 0.189 | 0.238 | 0.254 | 0.252 |
| Dep. Var. Mean | 0.347 | 0.327 | 0.390 | 0.422 | 0.228 | 0.202 | 0.404 | 0.379 |
| Adjusted R^2 | 0.283 | 0.285 | 0.282 | 0.292 | 0.332 | 0.242 | 0.279 | 0.289 |
| # Clusters | 1735 | 675 | 1060 | 993 | 158 | 316 | 1009 | 1035 |
| Alt. Cluster p-value | 0.242 | 0.299 | 0.669 | 0.489 | 0.777 | 0.734 | 0.960 | 0.926 |
| Alt. # Clusters | 549 | 288 | 467 | 453 | 128 | 229 | 456 | 464 |
Standard errors in parentheses
Population of women giving birth <18 years of age that were conceived between 1/1/2010 and 1/1/2016. We control for pregnancy fixed effects, trimester-by-year-by-month fixed effects, cigarette taxes, and cigarette and ENDS indoor air laws in bars, private workplaces, and restaurants. Standard errors are clustered at the level of county, and alternative p-values are provided for clustering at the level of health service area.
p < 0.1,
p < 0.05,
p < 0.01,
p < 0.001
Table 5:
Smoking Among Non-Smokers Prior to Pregnancy, Longitudinal, DD
| (1) | (2) | (3) | (4) | (5) | (6) | (7) | (8) | |
|---|---|---|---|---|---|---|---|---|
| All | Urban/Suburban | Rural | Rural, White NH | Rural, Black NH | Rural, Hispanic | Rural, Medicaid | Rural, First Birth | |
| Smoking | 0.000 | 0.000 | 0.000 | 0.001 | 0.002 | −0.001+ | 0.000 | 0.000 |
| Participation | (0.000) | (0.000) | (0.001) | (0.001) | (0.003) | (0.001) | (0.001) | (0.001) |
| Obs | 1,200,680 | 1,025,660 | 175,020 | 95,512 | 13,048 | 54,040 | 132,068 | 157,584 |
| MLSA Law Mean | 0.353 | 0.368 | 0.261 | 0.293 | 0.243 | 0.202 | 0.265 | 0.263 |
| Dep. Var. Mean | 0.001 | 0.000 | 0.001 | 0.001 | 0.001 | 0.000 | 0.001 | 0.001 |
| Adjusted R^2 | 0.000 | 0.000 | 0.001 | 0.001 | 0.007 | 0.002 | 0.001 | 0.001 |
| # Clusters | 1989 | 700 | 1289 | 1245 | 463 | 883 | 1244 | 1283 |
| Alt. Cluster p-value | 0.623 | 0.681 | 0.590 | 0.327 | 0.462 | 0.068 | 0.756 | 0.536 |
| Alt. # Clusters | 561 | 290 | 484 | 481 | 277 | 420 | 482 | 484 |
| >=5 Cigarettes Daily | 0.000 | 0.000 | −0.000 | 0.000 | 0.000 | −0.001+ | 0.000 | −0.000 |
| (0.000) | (0.000) | (0.000) | (0.001) | (0.000) | (0.001) | (0.000) | (0.000) | |
| Obs | 1,200,680 | 1,025,660 | 175,020 | 95,512 | 13,048 | 54,040 | 132,068 | 157,584 |
| MLSA Law Mean | 0.353 | 0.368 | 0.261 | 0.293 | 0.243 | 0.202 | 0.265 | 0.263 |
| Dep. Var. Mean | 0.000 | 0.000 | 0.001 | 0.001 | 0.000 | 0.000 | 0.001 | 0.001 |
| Adjusted R^2 | 0.000 | 0.000 | 0.001 | 0.000 | −0.003 | 0.001 | 0.000 | 0.001 |
| # Clusters | 1989 | 700 | 1289 | 1245 | 463 | 883 | 1244 | 1283 |
| Alt. Cluster p-value | 0.644 | 0.516 | 0.938 | 0.887 | 0.585 | 0.084 | 0.595 | 0.999 |
| Alt. # Clusters | 561 | 290 | 484 | 481 | 277 | 420 | 482 | 484 |
| >=10 Cigarettes | 0.000 | 0.000 | −0.000 | 0.000 | - | −0.001 | 0.000 | −0.000 |
| Daily | (0.000) | (0.000) | (0.000) | (0.000) | (0.001) | (0.000) | (0.000) | |
| Obs | 1,200,680 | 1,025,660 | 175,020 | 95,512 | 13,048 | 54,040 | 132,068 | 157,584 |
| MLSA Law Mean | 0.353 | 0.368 | 0.261 | 0.293 | 0.243 | 0.202 | 0.265 | 0.263 |
| Dep. Var. Mean | 0.000 | 0.000 | 0.000 | 0.000 | 0.000 | 0.000 | 0.000 | 0.000 |
| Adjusted R^2 | 0.000 | 0.000 | 0.000 | 0.001 | . | 0.001 | 0.001 | 0.000 |
| # Clusters | 1989 | 700 | 1289 | 1245 | 463 | 883 | 1244 | 1283 |
| Alt. Cluster p-value | 0.974 | 0.865 | 0.684 | 0.984 | . | 0.147 | 0.919 | 0.749 |
| Alt. # Clusters | 561 | 290 | 484 | 481 | 277 | 420 | 482 | 484 |
Standard errors in parentheses
Population of women giving birth <18 years of age that were conceived between 1/1/2010 and 1/1/2016. We control for pregnancy fixed effects, trimester-by-year-by-month fixed effects, cigarette taxes, and cigarette and ENDS indoor air laws in bars, private workplaces, and restaurants. Standard errors are clustered at the level of county, and alternative p-values are provided for clustering at the level of health service area. – indicates convergence not achieved.
p < 0.1,
p < 0.05,
p < 0.01,
p < 0.001
The estimates support this hypothesis. ENDS MLSAs had virtually no effect on teens who were non-smokers prior to pregnancy and had sizable effects (although sometimes imprecisely estimated) on rural smokers prior to pregnancy. For example, ENDS MLSAs increased smoking with a given trimester by 2.5 pp (p<0.10, 3.4% of the mean) among rural pregnant teens who smoked in the three months prior to their pregnancy.17
Table 6 shows estimates of the effects of ENDS MLSAs on birth outcomes for all rural teens. These estimates are from equation (2). ENDS MLSAs may improve birth outcomes by reducing overall nicotine exposure from traditional cigarettes and ENDS combined, but they could also harm birth outcomes by reducing smoking cessation and hence increasing exposure to the other toxicants besides nicotine that are present in traditional cigarettes. Given the conflicting direction in which ENDS MLSAs could impact birth outcomes, as well as the relatively small 0.6 pp increase in prenatal smoking, we likely have limited power to detect statistically significant effects.18
Table 6:
Birth Outcomes, Cross Sectional, Rural Underage Pregnant Women, DD
| (1) | (2) | (3) | (4) | (5) | (6) | (7) | (8) | (9) | |
|---|---|---|---|---|---|---|---|---|---|
| Continuous Birthweight | Low Birthweight | Very Low Birthweight | Weeks of Gestation | Premature | Very Premature | Small for Gestational Age | Apgar 5 | Weight Gain During Pregnancy | |
| ENDS MLSA | 3.0195 | 0.0016 | 0.0016 | 0.0285 | 0.0019 | −0.0063* | −0.0055 | −0.0152 | −0.2606 |
| (9.3590) | (0.0045) | (0.0020) | (0.0472) | (0.0062) | (0.0027) | (0.0081) | (0.0198) | (0.2928) | |
| Obs | 52,906 | 52,906 | 52,906 | 52,931 | 52,931 | 52,931 | 52,906 | 52,786 | 51,696 |
| MLSA Law Mean | 0.242 | 0.242 | 0.242 | 0.242 | 0.242 | 0.242 | 0.242 | 0.242 | 0.241 |
| Dep. Var. Mean | 3196.617 | 0.079 | 0.014 | 38.608 | 0.138 | 0.027 | 0.293 | 8.693 | 33.341 |
| Adjusted R^2 | 0.023 | 0.003 | 0.002 | 0.013 | 0.005 | 0.004 | 0.010 | 0.050 | 0.035 |
| # Clusters | 1298 | 1298 | 1298 | 1298 | 1298 | 1298 | 1298 | 1298 | 1297 |
| Alt. Cluster p-value | 0.744 | 0.725 | 0.426 | 0.537 | 0.761 | 0.019 | 0.514 | 0.482 | 0.395 |
| Alt. # Clusters | 486 | 486 | 486 | 486 | 486 | 486 | 486 | 486 | 486 |
Standard errors in parentheses
Population of women giving birth <18 years of age that were conceived between 1/1/2010 and 1/1/2016. Controlling for mother’s race, age, payment source, order of birth, cigarette taxes at point of gestation, cigarette and ENDS indoor air laws in bars, private workplaces, and restaurants, month-year of gestation, and county. Standard errors are clustered at the level of county, and alternative p-values are provided for clustering at the level of health service area.
p < 0.1,
p < 0.05,
p < 0.01,
p < 0.001
There is in fact little evidence of any significant effect on birth outcomes among all rural teens. While very premature birth declined by 0.6 pp (p<0.05), the coefficient on gestational length is positive, so there is no consistent evidence that ENDS MLSAs affected gestation. In Appendix Table 8 we restrict the sample to just rural white teens, since they experienced the largest increase in smoking.19 None of the coefficients are statistically significant in this subsample.
The corresponding event study for the birth outcomes, using one year intervals of time, is provided in Table 7 and Figure 3. Similar results for rural white only are provided in Appendix Table 9 and Appendix Figure 4.
Table 7:
Birth Outcomes, Cross Sectional, Rural Underage Pregnant Women, Event Study
| (1) | (2) | (3) | (4) | (5) | (6) | (7) | (8) | (9) | |
|---|---|---|---|---|---|---|---|---|---|
| Continuous Birthweight | Low Birthweight | Very Low Birthweight | Weeks of Gestation | Premature | Very Premature | Small for Gestational Age | Apgar 5 | Weight Gain During Pregnancy | |
| Conception Started >3 Years Before MLSA | 6.9128 | −0.0053 | −0.0048 | −0.0795 | 0.0078 | 0.0048 | −0.0141 | 0.0084 | 0.5600 |
| (13.5779) | (0.0072) | (0.0031) | (0.0733) | (0.0088) | (0.0043) | (0.0115) | (0.0300) | (0.4241) | |
| Conception Started 2–3 Years Before MLSA | 1.4343 | 0.0039 | −0.0035 | 0.0109 | 0.0063 | 0.0014 | −0.0065 | 0.0085 | 0.2166 |
| (10.2495) | (0.0051) | (0.0023) | (0.0564) | (0.0066) | (0.0032) | (0.0083) | (0.0184) | (0.2990) | |
| Conception Started 0–1 Years Before MLSA | 17.1571+ | −0.0040 | −0.0047* | 0.0716 | −0.0035 | −0.0036 | −0.0131 | 0.0133 | −0.3414 |
| (9.8961) | (0.0050) | (0.0023) | (0.0530) | (0.0064) | (0.0030) | (0.0083) | (0.0202) | (0.3104) | |
| Conception Started 0–1 Years After MLSA | 19.0813 | 0.0000 | −0.0005 | 0.1033 | −0.0006 | −0.0098** | −0.0168 | 0.0101 | −0.5954 |
| (13.3193) | (0.0068) | (0.0030) | (0.0675) | (0.0088) | (0.0037) | (0.0111) | (0.0273) | (0.4180) | |
| Conception Started >1 Years After MLSA | 4.9940 | 0.0022 | −0.0023 | 0.1688+ | −0.0111 | −0.0143** | 0.0008 | −0.0497 | −1.1450+ |
| (18.6346) | (0.0098) | (0.0041) | (0.0950) | (0.0123) | (0.0054) | (0.0154) | (0.0377) | (0.6293) | |
| Obs | 52,906 | 52,906 | 52,906 | 52,931 | 52,931 | 52,931 | 52,906 | 52,786 | 51,696 |
| MLSA Law Mean | 0.242 | 0.242 | 0.242 | 0.242 | 0.242 | 0.242 | 0.242 | 0.242 | 0.241 |
| Dep. Var. Mean | 3196.617 | 0.079 | 0.014 | 38.608 | 0.138 | 0.027 | 0.293 | 8.693 | 33.341 |
| Adjusted R^2 | 0.023 | 0.003 | 0.002 | 0.013 | 0.005 | 0.004 | 0.011 | 0.050 | 0.035 |
| # Clusters | 1298 | 1298 | 1298 | 1298 | 1298 | 1298 | 1298 | 1298 | 1297 |
| Policy Lead Joint p-Value | 0.850 | 0.190 | 0.258 | 0.257 | 0.603 | 0.516 | 0.473 | 0.899 | 0.415 |
Standard errors in parentheses
Population of women giving birth <18 years of age that were conceived between 1/1/2010 and 1/1/2016. Controlling for mother’s race, age, payment source, order of birth, cigarette taxes at point of gestation, cigarette and ENDS indoor air laws in bars, private workplaces, and restaurants, month-year of gestation, and county. Standard errors are clustered at the level of county.
p < 0.1,
p < 0.05,
p < 0.01,
p < 0.001
Figure 3:

Birth Outcomes for Rural Underage Pregnant Women, Cross Sectional, Event Study
Results are also presented in Table 7.
Discussion
This paper suggests that increases in teen prenatal cigarette smoking may be an unintended consequence of ENDS MLSAs among rural teens. Increases in prenatal smoking were entirely accounted for by pre-pregnancy smokers, suggesting that the mechanism through which ENDS MLSAs affected prenatal smoking was by reducing smoking cessation rather than by causing new initiation of cigarette smoking during pregnancy. The results from this paper are broadly consistent with, although of a smaller magnitude, than the results in Pesko and Cooper (2017) which explored the effect of ENDS indoor vaping restrictions on adult prenatal smoking.
Our best estimate of a 0.6 pp increase in smoking in a given trimester among rural teens is slightly smaller than previous estimates for teens generally (not specifically rural, nor pregnant) from cross-sectional difference-in-differences models. Three other studies found that ENDS MLSAs increased teen smoking by approximately 0.8 to 1.0 pp (Dave et al., 2019; Friedman, 2015; Pesko et al., 2016), while a fourth study used Monitoring the Future data to find that ENDS MLSAs decreased high school senior smoking participation by 2.0 pp (Abouk & Adams, 2017). One reason that our estimate may be smaller than those in the first three studies is that our results are for a subset of women rather than for both men and women, and women generally have lower tobacco use rates than men.
One limitation of our study is that we are unable to look at the future health of the mother and their infants. Teens who miss an opportunity to quit smoking during pregnancy may be less likely to quit smoking later in life leading to greater health risks to both themselves and to their infants. While 55% of women quit smoking during pregnancy, 40% of these mothers have historically relapsed within 6 months of giving birth (Centers for Disease Control and Prevention, 2015). If ENDS could help reduce both prenatal smoking and postnatal smoking (by preventing relapse), then the reduction in postnatal smoking from ENDS MLSAs could be a significant mechanism through which these laws affect population health. However, this is a hypothesis that we are unable to explore using birth certificate data.
We are also unable to look at future health of the infant. Higher postnatal smoking rates could adversely impact infant health through higher secondhand smoke exposure. The Surgeon General concluded that while ENDS aerosol is not harmless, it generally contains fewer toxicants than combustible tobacco products (U.S. Department of Health and Human Services, 2016).
A strength of our study is that we exploit the trimester-specific smoking information provided in revised birth records to examine the within-pregnancy effects of ENDS MLSAs. However, a second limitation of our study is that birth records have no information about vaping, so we are unable to examine this behavior directly. With the increasing use of ENDS, states should consider adding ENDS use information to the birth records. Additionally, states may wish to consider adding questions on smoking cessation behavior, such as through the use of nicotine replacement therapy.
Our study suggests that there may be a high unmet demand among pregnant rural teenage women for smoking cessation products, which is why we believe that some turn to vaping. Pregnancy may provide a unique window when women are open to guidance about resources and products available to help them to quit smoking. In the absence of such guidance, pregnant women may be more likely to use ENDS. Tobacco cessation pharmacotherapy interventions for pregnant women have received an “incomplete” grade from the United States Preventive Services Task Force due to uncertain evidence about their overall health benefits (U.S. Preventive Services Task Force, 2015). There may be substantial value in encouraging pregnant women’s use of tobacco cessation interventions to reduce prenatal smoking, and in physicians providing counselling and assistance to pregnant women who are trying to quit smoking.
Acknowledgements:
We appreciate helpful comments from Michael French and conference participants at the 2016 American Society for Health Economists conference. We thank Joanna Seirup for excellent data management. Research reported in this publication was supported by the National Institute on Drug Abuse of the National Institutes of Health under Award Number R01DA045016 (PI: Michael Pesko), P30DA040500 (PI: Bruce Schackman), and R01DA039968 (PI: Dhaval Dave). The content is solely the responsibility of the authors and does not necessarily represent the official views of the National Institutes of Health.
Appendix Table 1:
ENDS MLSA Law Enactment Dates
| State | Date of ENDS MLSA Law |
|---|---|
| Alabama+ | 8/1/2013 |
| Alaska^ | 8/22/2012 |
| Arizona+ | 9/13/2013 |
| Arkansas+ | 8/16/2013 |
| California | 9/27/2010 |
| Colorado | 3/25/2011 |
| Connecticut+ | 10/1/2014 |
| Delaware | 6/12/2014 |
| District of Columbia | 10/1/2015 |
| Florida | 7/1/2014 |
| Georgia* | 7/1/2014 |
| Hawaii+ | 6/27/2013 |
| Idaho | 7/1/2012 |
| Illinois | 1/1/2014 |
| Indiana | 7/1/2013 |
| Iowa | 7/1/2014 |
| Kansas | 7/1/2012 |
| Kentucky | 4/10/2014 |
| Louisiana^ | 5/28/2014 |
| Maine+ | 7/4/2015 |
| Maryland | 10/1/2012 |
| Massachusetts* | 9/25/2015 |
| Michigan* | 8/8/2016 |
| Minnesota^ | 8/1/2010 |
| Mississippi^ | 7/1/2013 |
| Missouri | 10/10/2014 |
| Montana | 1/1/2016 |
| Nebraska | 4/9/2014 |
| Nevada | 10/1/2015 |
| New Hampshire | 7/31/2010 |
| New Jersey+ | 3/12/2010 |
| New Mexico | 6/19/2015 |
| New York | 1/1/2013 |
| North Dakota | 8/1/2015 |
| North Carolina^ | 8/1/2013 |
| Ohio | 8/2/2014 |
| Oklahoma | 11/1/2014 |
| Oregon | 1/1/2016 |
| Pennsylvania* | 8/8/2016 |
| Rhode Island+ | 1/1/2015 |
| South Carolina | 6/7/2013 |
| South Dakota | 7/1/2014 |
| Tennessee | 7/1/2011 |
| Texas | 10/1/2015 |
| Utah | 5/11/2010 |
| Vermont | 7/1/2013 |
| Virginia^ | 7/1/2014 |
| Washington | 7/28/2013 |
| West Virginia+ | 6/6/2014 |
| Wisconsin^ | 4/20/2012 |
| Wyoming | 3/13/2013 |
| County | Date of ENDS MLSA Law |
| Santa Fe County, NM | 2/13/2014 |
| New York, Kings, Bronx, Richmond, and Queens Counties, NY | 11/19/2013 |
| Suffolk County, NY | 11/1/2009 |
| Cattaraugus County, NY | 2/14/2012 |
| Multnomah County, OR | 4/4/2015 |
| Philadelphia County, PA | 3/27/2014 |
| King County, WA | 12/16/2010 |
| Spokane County, WA | 3/31/2011 |
| Pierce County, WA | 6/2/2011 |
| Clark County, WA | 6/23/2011 |
Note:
Excluded states (see Data section for details).
These states adopted revised birth records after January 1, 2010 and on or before January 1, 2013.
These states revised birth records after January 1, 2013.
Appendix Table 2:
Descriptive Statistics from Birth Records for Births in Rural Counties, 2010–2016
| No Treatment | Partial Treatment | Full Treatment | ||||
|---|---|---|---|---|---|---|
| mean | sd | mean | sd | mean | sd | |
| Smoking Participation Before Pregnancy | 0.172 | 0.378 | 0.152 | 0.359 | 0.165 | 0.371 |
| Smoking Participation in First Trimester | 0.130 | 0.337 | 0.115 | 0.319 | 0.123 | 0.329 |
| Smoking Participation in Second Trimester | 0.108 | 0.310 | 0.095 | 0.293 | 0.097 | 0.296 |
| Smoking Participation in Third Trimester | 0.101 | 0.301 | 0.090 | 0.286 | 0.092 | 0.288 |
| White non-Hispanic | 0.573 | 0.495 | 0.593 | 0.491 | 0.667 | 0.471 |
| Black non-Hispanic | 0.069 | 0.254 | 0.059 | 0.236 | 0.061 | 0.240 |
| Hispanic | 0.290 | 0.454 | 0.268 | 0.443 | 0.197 | 0.398 |
| Other non-Hispanic or Missing | 0.068 | 0.251 | 0.080 | 0.271 | 0.074 | 0.263 |
| 14 or younger | 0.037 | 0.189 | 0.037 | 0.189 | 0.035 | 0.183 |
| 15 | 0.114 | 0.318 | 0.109 | 0.311 | 0.116 | 0.320 |
| 16 | 0.294 | 0.456 | 0.287 | 0.452 | 0.280 | 0.449 |
| 17 | 0.555 | 0.497 | 0.567 | 0.495 | 0.570 | 0.495 |
| Medicaid | 0.758 | 0.428 | 0.766 | 0.424 | 0.774 | 0.418 |
| Private Insurance | 0.158 | 0.364 | 0.162 | 0.369 | 0.161 | 0.368 |
| Self-pay | 0.035 | 0.184 | 0.035 | 0.185 | 0.030 | 0.171 |
| Indian Health Service | 0.008 | 0.086 | 0.006 | 0.076 | 0.003 | 0.052 |
| CHAMPUS/TRICARE | 0.003 | 0.051 | 0.003 | 0.051 | 0.003 | 0.058 |
| Other government insurance | 0.009 | 0.092 | 0.010 | 0.102 | 0.009 | 0.093 |
| Other | 0.022 | 0.146 | 0.012 | 0.108 | 0.008 | 0.091 |
| Unknown | 0.009 | 0.092 | 0.006 | 0.076 | 0.012 | 0.109 |
| Mother’s birth count (living and dead) | 1.123 | 0.379 | 1.116 | 0.378 | 1.114 | 0.374 |
| Urban | 0.000 | 0.000 | 0.000 | 0.000 | 0.000 | 0.000 |
| Suburban | 0.000 | 0.000 | 0.000 | 0.000 | 0.000 | 0.000 |
| Rural | 1.000 | 0.000 | 1.000 | 0.000 | 1.000 | 0.000 |
| Birth weight (in grams) | 3190.647 | 544.748 | 3213.516 | 545.527 | 3211.791 | 553.588 |
| Low Birth Weight (<2500 grams) | 0.079 | 0.270 | 0.073 | 0.260 | 0.077 | 0.267 |
| Very Low Birth Weight (<1500 grams) | 0.014 | 0.119 | 0.013 | 0.113 | 0.014 | 0.117 |
| Gestation Length (in weeks) | 38.593 | 2.830 | 38.642 | 2.734 | 38.665 | 2.752 |
| Premature Birth (<37 weeks) | 0.140 | 0.347 | 0.132 | 0.338 | 0.135 | 0.342 |
| Very Premature Birth (<32 weeks) | 0.027 | 0.163 | 0.027 | 0.162 | 0.024 | 0.154 |
| Apgar 5 Score | 8.688 | 1.012 | 8.717 | 1.005 | 8.699 | 1.006 |
| Small for Gestational Age (<=25th Percentile) | 0.296 | 0.456 | 0.285 | 0.452 | 0.289 | 0.453 |
| Weight Gain During Pregnancy (in pounds) | 33.354 | 15.979 | 33.470 | 16.227 | 33.305 | 16.337 |
| ENDS MLSA | 0.000 | 0.000 | 0.323 | 0.467 | 1.000 | 0.000 |
| Cigarette taxes ($) | 1.215 | 0.638 | 1.189 | 0.785 | 1.184 | 0.930 |
| Cigarette private workplace indoor use law: None | 0.403 | 0.491 | 0.302 | 0.459 | 0.141 | 0.348 |
| Cigarette private workplace indoor use law: Partial | 0.143 | 0.350 | 0.176 | 0.381 | 0.191 | 0.393 |
| Cigarette private workplace indoor use law: Full | 0.454 | 0.498 | 0.521 | 0.500 | 0.668 | 0.471 |
| Cigarette restaurant indoor use law: None | 0.398 | 0.490 | 0.302 | 0.459 | 0.141 | 0.348 |
| Cigarette restaurant indoor use law: Partial | 0.207 | 0.405 | 0.224 | 0.417 | 0.300 | 0.458 |
| Cigarette restaurant indoor use law: Full | 0.395 | 0.489 | 0.474 | 0.499 | 0.558 | 0.497 |
| Cigarette bar indoor use law: None | 0.600 | 0.490 | 0.552 | 0.497 | 0.494 | 0.500 |
| Cigarette bar indoor use law: Partial | 0.059 | 0.236 | 0.082 | 0.275 | 0.098 | 0.298 |
| Cigarette bar indoor use law: Full | 0.341 | 0.474 | 0.366 | 0.482 | 0.408 | 0.491 |
| ENDS private workplace indoor use law: percent of population affected | 0.008 | 0.085 | 0.011 | 0.094 | 0.032 | 0.166 |
| ENDS restaurant indoor use law: percent of population affected | 0.008 | 0.085 | 0.012 | 0.095 | 0.039 | 0.185 |
| ENDS bar indoor use law: percent of population affected | 0.008 | 0.085 | 0.012 | 0.095 | 0.039 | 0.185 |
| Observations | 35970 | 5664 | 10873 | |||
Population of women giving birth <18 years of age from rural areas of 32 states meeting inclusion criteria. Policy variables are as of the start of the first trimester.
Appendix Table 3:
Underage Teen Births, Cross Sectional, DD
| (1) | (2) | (3) | |
|---|---|---|---|
| Urban | Suburban | Rural | |
| ENDS MLSA | 4.9565* | 0.3008** | 0.0192 |
| (1.8595) | (0.1125) | (0.0215) | |
| Obs | 3,310 | 32,363 | 32,541 |
| MLSA Law Mean | 0.423 | 0.341 | 0.269 |
| Dep. Var. Mean | 36.740 | 4.873 | 1.631 |
| Adjusted R^2 | 0.941 | 0.862 | 0.338 |
| # Clusters | 46 | 654 | 1298 |
| Alt. Cluster p-value | 0.008 | 0.007 | 0.377 |
| Alt. # Clusters | 38 | 288 | 486 |
Standard errors in parentheses
County-by-year/month counts of women giving birth <18 years of age that were conceived between 1/1/2010 and 1/1/2016. Controlling for female population 14–17 years of age, cigarette taxes at point of gestation, cigarette and ENDS indoor air laws in bars, private workplaces, and restaurants, month-year of gestation, and county. Standard errors are clustered at the level of county, and alternative p-values are provided for clustering at the level of health service area.
p < 0.1,
p < 0.05,
p < 0.01,
p < 0.001
Appendix Table 4:
Underage Teen Births, Cross Sectional, Event Study
| (1) | (2) | (3) | |
|---|---|---|---|
| Urban | Suburban | Rural | |
| Conception Started >3 Years Before MLSA | 3.8541 | −0.6349** | −0.0112 |
| (2.7851) | (0.2271) | (0.0288) | |
| Conception Started 2–3 Years Before MLSA | −0.2048 | −0.3189** | 0.0020 |
| (1.0939) | (0.0992) | (0.0204) | |
| Conception Started 0–1 Years Before MLSA | 1.5119 | 0.3514** | −0.0191 |
| (1.0869) | (0.1219) | (0.0215) | |
| Conception Started 0–1 Years After MLSA | 4.4769+ | 0.7121** | −0.0043 |
| (2.2408) | (0.2191) | (0.0317) | |
| Conception Started >1 Years After MLSA | 6.8280* | 0.9435*** | 0.0388 |
| (3.2481) | (0.2798) | (0.0467) | |
| Obs | 3,310 | 32,363 | 32,541 |
| MLSA Law Mean | 0.423 | 0.341 | 0.269 |
| Dep. Var. Mean | 36.740 | 4.873 | 1.631 |
| Adjusted R^2 | 0.942 | 0.863 | 0.338 |
| # Clusters | 46 | 654 | 1298 |
| Policy Lead Joint p-Value | 0.083 | 0.006 | 0.857 |
Standard errors in parentheses
County-by-year/month counts of women giving birth <18 years of age that were conceived between 1/1/2010 and 1/1/2016. Controlling for female population 14–17 years of age, cigarette taxes at point of gestation, cigarette and ENDS indoor air laws in bars, private workplaces, and restaurants, month-year of gestation, and county. Standard errors are clustered at the level of county.
p < 0.1,
p < 0.05,
p < 0.01,
p < 0.001
Appendix Table 5:
Smoking, Longitudinal, Event Study
| (1) | (2) | (3) | (4) | (5) | (6) | (7) | (8) | |
|---|---|---|---|---|---|---|---|---|
| All | Urban/Suburban | Rural | Rural, White NH | Rural, Black NH | Rural, Hispanic | Rural, Medicaid | Rural, First Birth | |
| Panel A: >=5 Cigarettes Daily | ||||||||
| Trim. Started >30 | 0.013** | 0.013** | −0.004 | −0.007 | −0.019 | −0.003 | −0.002 | −0.004 |
| Months Before MLSA=1 | (0.005) | (0.005) | (0.005) | (0.008) | (0.013) | (0.006) | (0.006) | (0.006) |
| Trim. Started 21–30 | 0.009** | 0.009** | −0.005 | −0.006 | −0.022* | −0.003 | −0.002 | −0.006 |
| Months Before MLSA=1 | (0.003) | (0.003) | (0.004) | (0.006) | (0.010) | (0.004) | (0.005) | (0.004) |
| Trim. Started 12–21 | 0.005** | 0.006*** | −0.003 | −0.003 | −0.005 | −0.000 | −0.003 | −0.004 |
| Months Before MLSA=1 | (0.002) | (0.002) | (0.003) | (0.004) | (0.006) | (0.003) | (0.003) | (0.003) |
| Trim. Started 0–3 | 0.001 | 0.001 | 0.002 | 0.005 | 0.006 | 0.001 | 0.003 | 0.002 |
| Months Before MLSA=1 | (0.001) | (0.001) | (0.003) | (0.004) | (0.005) | (0.003) | (0.003) | (0.003) |
| Trim. Started 0–9 | 0.004* | 0.003* | 0.006 | 0.010+ | 0.014 | −0.002 | 0.008+ | 0.005 |
| Months After MLSA=1 | (0.002) | (0.002) | (0.004) | (0.006) | (0.010) | (0.004) | (0.004) | (0.004) |
| Trim. Started >9 | 0.003 | 0.004 | −0.002 | 0.012 | 0.028* | −0.015* | −0.000 | −0.001 |
| Months After MLSA=1 | (0.003) | (0.003) | (0.006) | (0.008) | (0.013) | (0.006) | (0.007) | (0.006) |
| Obs | 1,313,612 | 1,103,072 | 210,540 | 125,320 | 13,968 | 56,416 | 160,456 | 187,924 |
| MLSA Law Mean | 0.346 | 0.362 | 0.259 | 0.284 | 0.239 | 0.204 | 0.263 | 0.261 |
| Dep. Var. Mean | 0.045 | 0.035 | 0.094 | 0.141 | 0.027 | 0.014 | 0.101 | 0.088 |
| Adjusted R^2 | 0.026 | 0.021 | 0.048 | 0.068 | 0.027 | 0.015 | 0.049 | 0.048 |
| # Clusters | 1998 | 700 | 1298 | 1259 | 496 | 910 | 1258 | 1292 |
| Policy Lead Joint p-Value | 0.017 | 0.009 | 0.584 | 0.780 | 0.078 | 0.870 | 0.854 | 0.386 |
| Panel B: >=10 Cigarettes Daily | ||||||||
| Trim. Started >30 | 0.014** | 0.013** | −0.000 | −0.003 | −0.011 | 0.000 | 0.002 | 0.003 |
| Months Before MLSA=1 | (0.004) | (0.004) | (0.005) | (0.008) | (0.010) | (0.005) | (0.006) | (0.006) |
| Trim. Started 21–30 | 0.009** | 0.008** | −0.002 | −0.004 | −0.013+ | 0.001 | 0.000 | −0.000 |
| Months Before MLSA=1 | (0.003) | (0.003) | (0.004) | (0.006) | (0.007) | (0.004) | (0.005) | (0.004) |
| Trim. Started 12–21 | 0.005** | 0.005** | −0.002 | −0.002 | −0.003 | 0.001 | −0.002 | −0.001 |
| Months Before MLSA=1 | (0.002) | (0.002) | (0.003) | (0.004) | (0.005) | (0.003) | (0.003) | (0.003) |
| Trim. Started 0–3 | 0.002 | 0.002+ | −0.002 | 0.001 | 0.006 | −0.002 | −0.002 | −0.001 |
| Months Before MLSA=1 | (0.001) | (0.001) | (0.003) | (0.004) | (0.004) | (0.003) | (0.003) | (0.003) |
| Trim. Started 0–9 | 0.003+ | 0.002 | 0.001 | 0.007 | 0.009 | −0.003 | 0.001 | 0.001 |
| Months After MLSA=1 | (0.002) | (0.002) | (0.004) | (0.005) | (0.007) | (0.003) | (0.004) | (0.004) |
| Trim. Started >9 | 0.002 | 0.002 | −0.005 | 0.012 | 0.019* | −0.013* | −0.006 | −0.005 |
| Months After MLSA=1 | (0.003) | (0.003) | (0.006) | (0.008) | (0.009) | (0.006) | (0.007) | (0.006) |
| Obs | 1,313,612 | 1,103,072 | 210,540 | 125,320 | 13,968 | 56,416 | 160,456 | 187,924 |
| MLSA Law Mean | 0.346 | 0.362 | 0.259 | 0.284 | 0.239 | 0.204 | 0.263 | 0.261 |
| Dep. Var. Mean | 0.030 | 0.023 | 0.066 | 0.101 | 0.015 | 0.009 | 0.072 | 0.061 |
| Adjusted R^2 | 0.024 | 0.020 | 0.047 | 0.068 | 0.023 | 0.016 | 0.049 | 0.046 |
| # Clusters | 1998 | 700 | 1298 | 1259 | 496 | 910 | 1258 | 1292 |
| Policy Lead Joint p-Value | 0.015 | 0.018 | 0.828 | 0.859 | 0.215 | 0.987 | 0.737 | 0.687 |
Standard errors in parentheses
Population of women giving birth <18 years of age that were conceived between 1/1/2010 and 1/1/2016. We control for pregnancy fixed effects, trimester-by-year-by-month fixed effects, cigarette taxes, and cigarette and ENDS indoor air laws in bars, private workplaces, and restaurants. Standard errors are clustered at the level of county.
p < 0.1,
p < 0.05,
p < 0.01,
p < 0.001
Appendix Table 6:
Smoking, Longitudinal, DD, Years 2013–2016
| (1) | (2) | (3) | (4) | (5) | (6) | (7) | (8) | |
|---|---|---|---|---|---|---|---|---|
| All | Urban/Suburban | Rural | Rural, White NH | Rural, Black NH | Rural, Hispanic | Rural, Medicaid | Rural, First Birth | |
| Smoking | 0.000 | −0.000 | 0.007** | 0.008+ | 0.000 | −0.002 | 0.006+ | 0.006+ |
| Participation | (0.002) | (0.002) | (0.003) | (0.004) | (0.005) | (0.004) | (0.003) | (0.003) |
| Obs | 632,832 | 516,696 | 116,136 | 63,744 | 14,832 | 27,388 | 91,352 | 104,176 |
| MLSA Law Mean | 0.599 | 0.605 | 0.572 | 0.608 | 0.695 | 0.421 | 0.577 | 0.576 |
| Dep. Var. Mean | 0.057 | 0.046 | 0.104 | 0.158 | 0.019 | 0.024 | 0.109 | 0.099 |
| Adjusted R^2 | 0.025 | 0.021 | 0.043 | 0.059 | 0.012 | 0.018 | 0.042 | 0.043 |
| # Clusters | 2482 | 924 | 1558 | 1437 | 504 | 888 | 1489 | 1542 |
| Alt. Cluster p-value | 0.955 | 0.898 | 0.066 | 0.131 | 0.928 | 0.347 | 0.123 | 0.147 |
| Alt. # Clusters | 39 | 39 | 37 | 37 | 31 | 37 | 37 | 37 |
| >=5 Cigarettes Daily | 0.001 | 0.001 | 0.007** | 0.007 | 0.004 | −0.003 | 0.008* | 0.006* |
| (0.001) | (0.002) | (0.003) | (0.004) | (0.004) | (0.004) | (0.003) | (0.003) | |
| Obs | 632,832 | 516,696 | 116,136 | 63,744 | 14,832 | 27,388 | 91,352 | 104,176 |
| MLSA Law Mean | 0.599 | 0.605 | 0.572 | 0.608 | 0.695 | 0.421 | 0.577 | 0.576 |
| Dep. Var. Mean | 0.041 | 0.033 | 0.077 | 0.122 | 0.010 | 0.013 | 0.081 | 0.073 |
| Adjusted R^2 | 0.024 | 0.020 | 0.042 | 0.064 | 0.012 | 0.012 | 0.042 | 0.042 |
| # Clusters | 2482 | 924 | 1558 | 1437 | 504 | 888 | 1489 | 1542 |
| Alt. Cluster p-value | 0.777 | 0.864 | 0.072 | 0.254 | 0.362 | 0.422 | 0.062 | 0.104 |
| Alt. # Clusters | 39 | 39 | 37 | 37 | 31 | 37 | 37 | 37 |
| >=10 Cigarettes | −0.001 | −0.001 | 0.005+ | 0.006 | 0.001 | −0.000 | 0.004 | 0.004 |
| Daily | (0.001) | (0.001) | (0.003) | (0.004) | (0.004) | (0.003) | (0.003) | (0.003) |
| Obs | 632,832 | 516,696 | 116,136 | 63,744 | 14,832 | 27,388 | 91,352 | 104,176 |
| MLSA Law Mean | 0.599 | 0.605 | 0.572 | 0.608 | 0.695 | 0.421 | 0.577 | 0.576 |
| Dep. Var. Mean | 0.027 | 0.021 | 0.053 | 0.085 | 0.006 | 0.008 | 0.057 | 0.050 |
| Adjusted R^2 | 0.022 | 0.019 | 0.040 | 0.062 | 0.010 | 0.018 | 0.040 | 0.039 |
| # Clusters | 2482 | 924 | 1558 | 1437 | 504 | 888 | 1489 | 1542 |
| Alt. Cluster p-value | 0.872 | 0.831 | 0.217 | 0.289 | 0.836 | 0.941 | 0.272 | 0.231 |
| Alt. # Clusters | 39 | 39 | 37 | 37 | 31 | 37 | 37 | 37 |
Standard errors in parentheses
Population of women giving birth <18 years of age that were conceived between 1/1/2013 and 1/1/2016. We control for pregnancy fixed effects, trimester-by-year-by-month fixed effects, cigarette taxes, and cigarette and ENDS indoor air laws in bars, private workplaces, and restaurants. Standard errors are clustered at the level of county, and alternative p-values are provided for clustering at the level of state.
p < 0.1,
p < 0.05,
p < 0.01,
p < 0.001
Appendix Table 7:
Smoking, Longitudinal, DD, No Restrictions on State Revision Date
| (1) | (2) | (3) | (4) | (5) | (6) | (7) | (8) | |
|---|---|---|---|---|---|---|---|---|
| All | Urban/Suburban | Rural | Rural, White NH | Rural, Black NH | Rural, Hispanic | Rural, Medicaid | Rural, First Birth | |
| Smoking | 0.002+ | 0.000 | 0.006** | 0.008* | −0.000 | −0.000 | 0.005* | 0.005* |
| Participation | (0.001) | (0.001) | (0.002) | (0.003) | (0.004) | (0.003) | (0.003) | (0.002) |
| Obs | 1,544,700 | 1,271,516 | 273,184 | 155,352 | 33,344 | 63,924 | 211,440 | 244,560 |
| MLSA Law Mean | 0.377 | 0.387 | 0.326 | 0.337 | 0.387 | 0.247 | 0.329 | 0.329 |
| Dep. Var. Mean | 0.063 | 0.051 | 0.117 | 0.175 | 0.027 | 0.025 | 0.123 | 0.111 |
| Adjusted R^2 | 0.027 | 0.023 | 0.045 | 0.062 | 0.018 | 0.019 | 0.044 | 0.045 |
| # Clusters | 2823 | 1053 | 1770 | 1704 | 769 | 1173 | 1719 | 1763 |
| Alt. Cluster p-value | 0.361 | 0.765 | 0.110 | 0.089 | 0.925 | 0.911 | 0.180 | 0.212 |
| Alt. # Clusters | 48 | 48 | 44 | 44 | 42 | 44 | 44 | 44 |
| >=5 Cigarettes Daily | 0.003** | 0.002* | 0.004+ | 0.005 | 0.002 | −0.001 | 0.005* | 0.003 |
| (0.001) | (0.001) | (0.002) | (0.004) | (0.004) | (0.003) | (0.003) | (0.002) | |
| Obs | 1,544,700 | 1,271,516 | 273,184 | 155,352 | 33,344 | 63,924 | 211,440 | 244,560 |
| MLSA Law Mean | 0.377 | 0.387 | 0.326 | 0.337 | 0.387 | 0.247 | 0.329 | 0.329 |
| Dep. Var. Mean | 0.045 | 0.036 | 0.088 | 0.137 | 0.015 | 0.014 | 0.093 | 0.082 |
| Adjusted R^2 | 0.026 | 0.021 | 0.045 | 0.066 | 0.018 | 0.014 | 0.045 | 0.045 |
| # Clusters | 2823 | 1053 | 1770 | 1704 | 769 | 1173 | 1719 | 1763 |
| Alt. Cluster p-value | 0.291 | 0.365 | 0.295 | 0.353 | 0.627 | 0.657 | 0.199 | 0.397 |
| Alt. # Clusters | 48 | 48 | 44 | 44 | 42 | 44 | 44 | 44 |
| >=10 Cigarettes | 0.002* | 0.002 | 0.003 | 0.005 | 0.001 | −0.001 | 0.003 | 0.003 |
| Daily | (0.001) | (0.001) | (0.002) | (0.003) | (0.004) | (0.002) | (0.002) | (0.002) |
| Obs | 1,544,700 | 1,271,516 | 273,184 | 155,352 | 33,344 | 63,924 | 211,440 | 244,560 |
| MLSA Law Mean | 0.377 | 0.387 | 0.326 | 0.337 | 0.387 | 0.247 | 0.329 | 0.329 |
| Dep. Var. Mean | 0.030 | 0.023 | 0.061 | 0.096 | 0.008 | 0.008 | 0.065 | 0.056 |
| Adjusted R^2 | 0.024 | 0.020 | 0.044 | 0.066 | 0.013 | 0.014 | 0.045 | 0.043 |
| # Clusters | 2823 | 1053 | 1770 | 1704 | 769 | 1173 | 1719 | 1763 |
| Alt. Cluster p-value | 0.395 | 0.475 | 0.416 | 0.280 | 0.791 | 0.775 | 0.444 | 0.427 |
| Alt. # Clusters | 48 | 48 | 44 | 44 | 42 | 44 | 44 | 44 |
Standard errors in parentheses
Population of women giving birth <18 years of age that were conceived between 1/1/2013 and 1/1/2016. We control for pregnancy fixed effects, trimester-by-year-by-month fixed effects, cigarette taxes, and cigarette and ENDS indoor air laws in bars, private workplaces, and restaurants. Standard errors are clustered at the level of county, and alternative p-values are provided for clustering at the level of state.
p < 0.1,
p < 0.05,
p < 0.01,
p < 0.001
Appendix Table 8:
Birth Outcomes, Cross Sectional, Rural White Underage Pregnant Women, DD
| (1) | (2) | (3) | (4) | (5) | (6) | (7) | (8) | (9) | |
|---|---|---|---|---|---|---|---|---|---|
| Continuous Birthweight | Low Birthweight | Very Low Birthweight | Weeks of Gestation | Premature | Very Premature | Small for Gestational Age | Apgar 5 | Weight Gain During Pregnancy | |
| ENDS MLSA | 2.7246 | 0.0034 | 0.0040 | −0.0031 | −0.0003 | −0.0039 | −0.0060 | −0.0287 | −0.3830 |
| (13.1738) | (0.0060) | (0.0027) | (0.0618) | (0.0081) | (0.0035) | (0.0103) | (0.0248) | (0.3866) | |
| Obs | 31,448 | 31,448 | 31,448 | 31,465 | 31,465 | 31,465 | 31,448 | 31,377 | 30,789 |
| MLSA Law Mean | 0.266 | 0.266 | 0.266 | 0.266 | 0.266 | 0.266 | 0.266 | 0.266 | 0.266 |
| Dep. Var. Mean | 3227.107 | 0.075 | 0.014 | 38.732 | 0.130 | 0.025 | 0.276 | 8.702 | 34.738 |
| Adjusted R^2 | 0.010 | 0.002 | 0.002 | 0.011 | 0.002 | 0.001 | 0.004 | 0.044 | 0.019 |
| # Clusters | 1259 | 1259 | 1259 | 1259 | 1259 | 1259 | 1259 | 1259 | 1258 |
| Alt. Cluster p-value | 0.828 | 0.562 | 0.118 | 0.958 | 0.972 | 0.247 | 0.561 | 0.255 | 0.332 |
| Alt. # Clusters | 483 | 483 | 483 | 483 | 483 | 483 | 483 | 483 | 483 |
Standard errors in parentheses
Population of women giving birth <18 years of age that were conceived between 1/1/2010 and 1/1/2016. Controlling for mother’s race, age, payment source, order of birth, cigarette taxes at point of gestation, cigarette and ENDS indoor air laws in bars, private workplaces, and restaurants, month-year of gestation, and county. Standard errors are clustered at the level of county, and alternative p-values are provided for clustering at the level of health service area.
p < 0.1,
p < 0.05,
p < 0.01,
p < 0.001
Appendix Table 9:
Birth Outcomes, Cross Sectional, Rural White Underage Pregnant Women, Event Study
| (1) | (2) | (3) | (4) | (5) | (6) | (7) | (8) | (9) | |
|---|---|---|---|---|---|---|---|---|---|
| Continuous Birthweight | Low Birthweight | Very Low Birthweight | Weeks of Gestation | Premature | Very Premature | Small for Gestational Age | Apgar 5 | Weight Gain During Pregnancy | |
| Conception Started >3 Years Before MLSA | 6.6867 | −0.0003 | −0.0016 | −0.0740 | 0.0010 | 0.0065 | −0.0108 | 0.0310 | 0.2830 |
| (18.4666) | (0.0094) | (0.0044) | (0.0937) | (0.0113) | (0.0057) | (0.0141) | (0.0378) | (0.5510) | |
| Conception Started 2–3 Years Before MLSA | 5.1040 | 0.0023 | −0.0036 | 0.0275 | −0.0009 | 0.0014 | 0.0009 | 0.0171 | 0.2310 |
| (14.2077) | (0.0070) | (0.0031) | (0.0728) | (0.0084) | (0.0040) | (0.0106) | (0.0257) | (0.3997) | |
| Conception Started 0–1 Years Before MLSA | 24.2722+ | −0.0031 | −0.0036 | 0.0760 | −0.0065 | −0.0031 | −0.0254* | 0.0390 | −0.3910 |
| (13.3729) | (0.0065) | (0.0029) | (0.0684) | (0.0085) | (0.0039) | (0.0112) | (0.0252) | (0.4047) | |
| Conception Started 0–1 Years After MLSA | 21.6441 | 0.0021 | 0.0019 | 0.0748 | −0.0044 | −0.0073 | −0.0256+ | 0.0075 | −0.6516 |
| (18.5165) | (0.0085) | (0.0039) | (0.0856) | (0.0111) | (0.0048) | (0.0145) | (0.0358) | (0.5452) | |
| Conception Started >1 Years After MLSA | 21.3063 | −0.0019 | −0.0011 | 0.1398 | −0.0118 | −0.0130* | −0.0185 | −0.0409 | −1.2282 |
| (24.9316) | (0.0122) | (0.0052) | (0.1160) | (0.0148) | (0.0066) | (0.0190) | (0.0505) | (0.7610) | |
| Obs | 31,448 | 31,448 | 31,448 | 31,465 | 31,465 | 31,465 | 31,448 | 31,377 | 30,789 |
| MLSA Law Mean | 0.266 | 0.266 | 0.266 | 0.266 | 0.266 | 0.266 | 0.266 | 0.266 | 0.266 |
| Dep. Var. Mean | 3227.107 | 0.075 | 0.014 | 38.732 | 0.130 | 0.025 | 0.276 | 8.702 | 34.738 |
| Adjusted R^2 | 0.010 | 0.002 | 0.002 | 0.011 | 0.002 | 0.001 | 0.004 | 0.044 | 0.019 |
| # Clusters | 1259 | 1259 | 1259 | 1259 | 1259 | 1259 | 1259 | 1259 | 1258 |
| Policy Lead Joint p-Value | 0.924 | 0.893 | 0.420 | 0.400 | 0.975 | 0.465 | 0.578 | 0.708 | 0.830 |
Standard errors in parentheses
Population of women giving birth <18 years of age that were conceived between 1/1/2010 and 1/1/2016. Controlling for mother’s race, age, payment source, order of birth, cigarette taxes at point of gestation, cigarette and ENDS indoor air laws in bars, private workplaces, and restaurants, month-year of gestation, and county. Standard errors are clustered at the level of county.
p < 0.1,
p < 0.05,
p < 0.01,
p < 0.001
Appendix Figure 1:
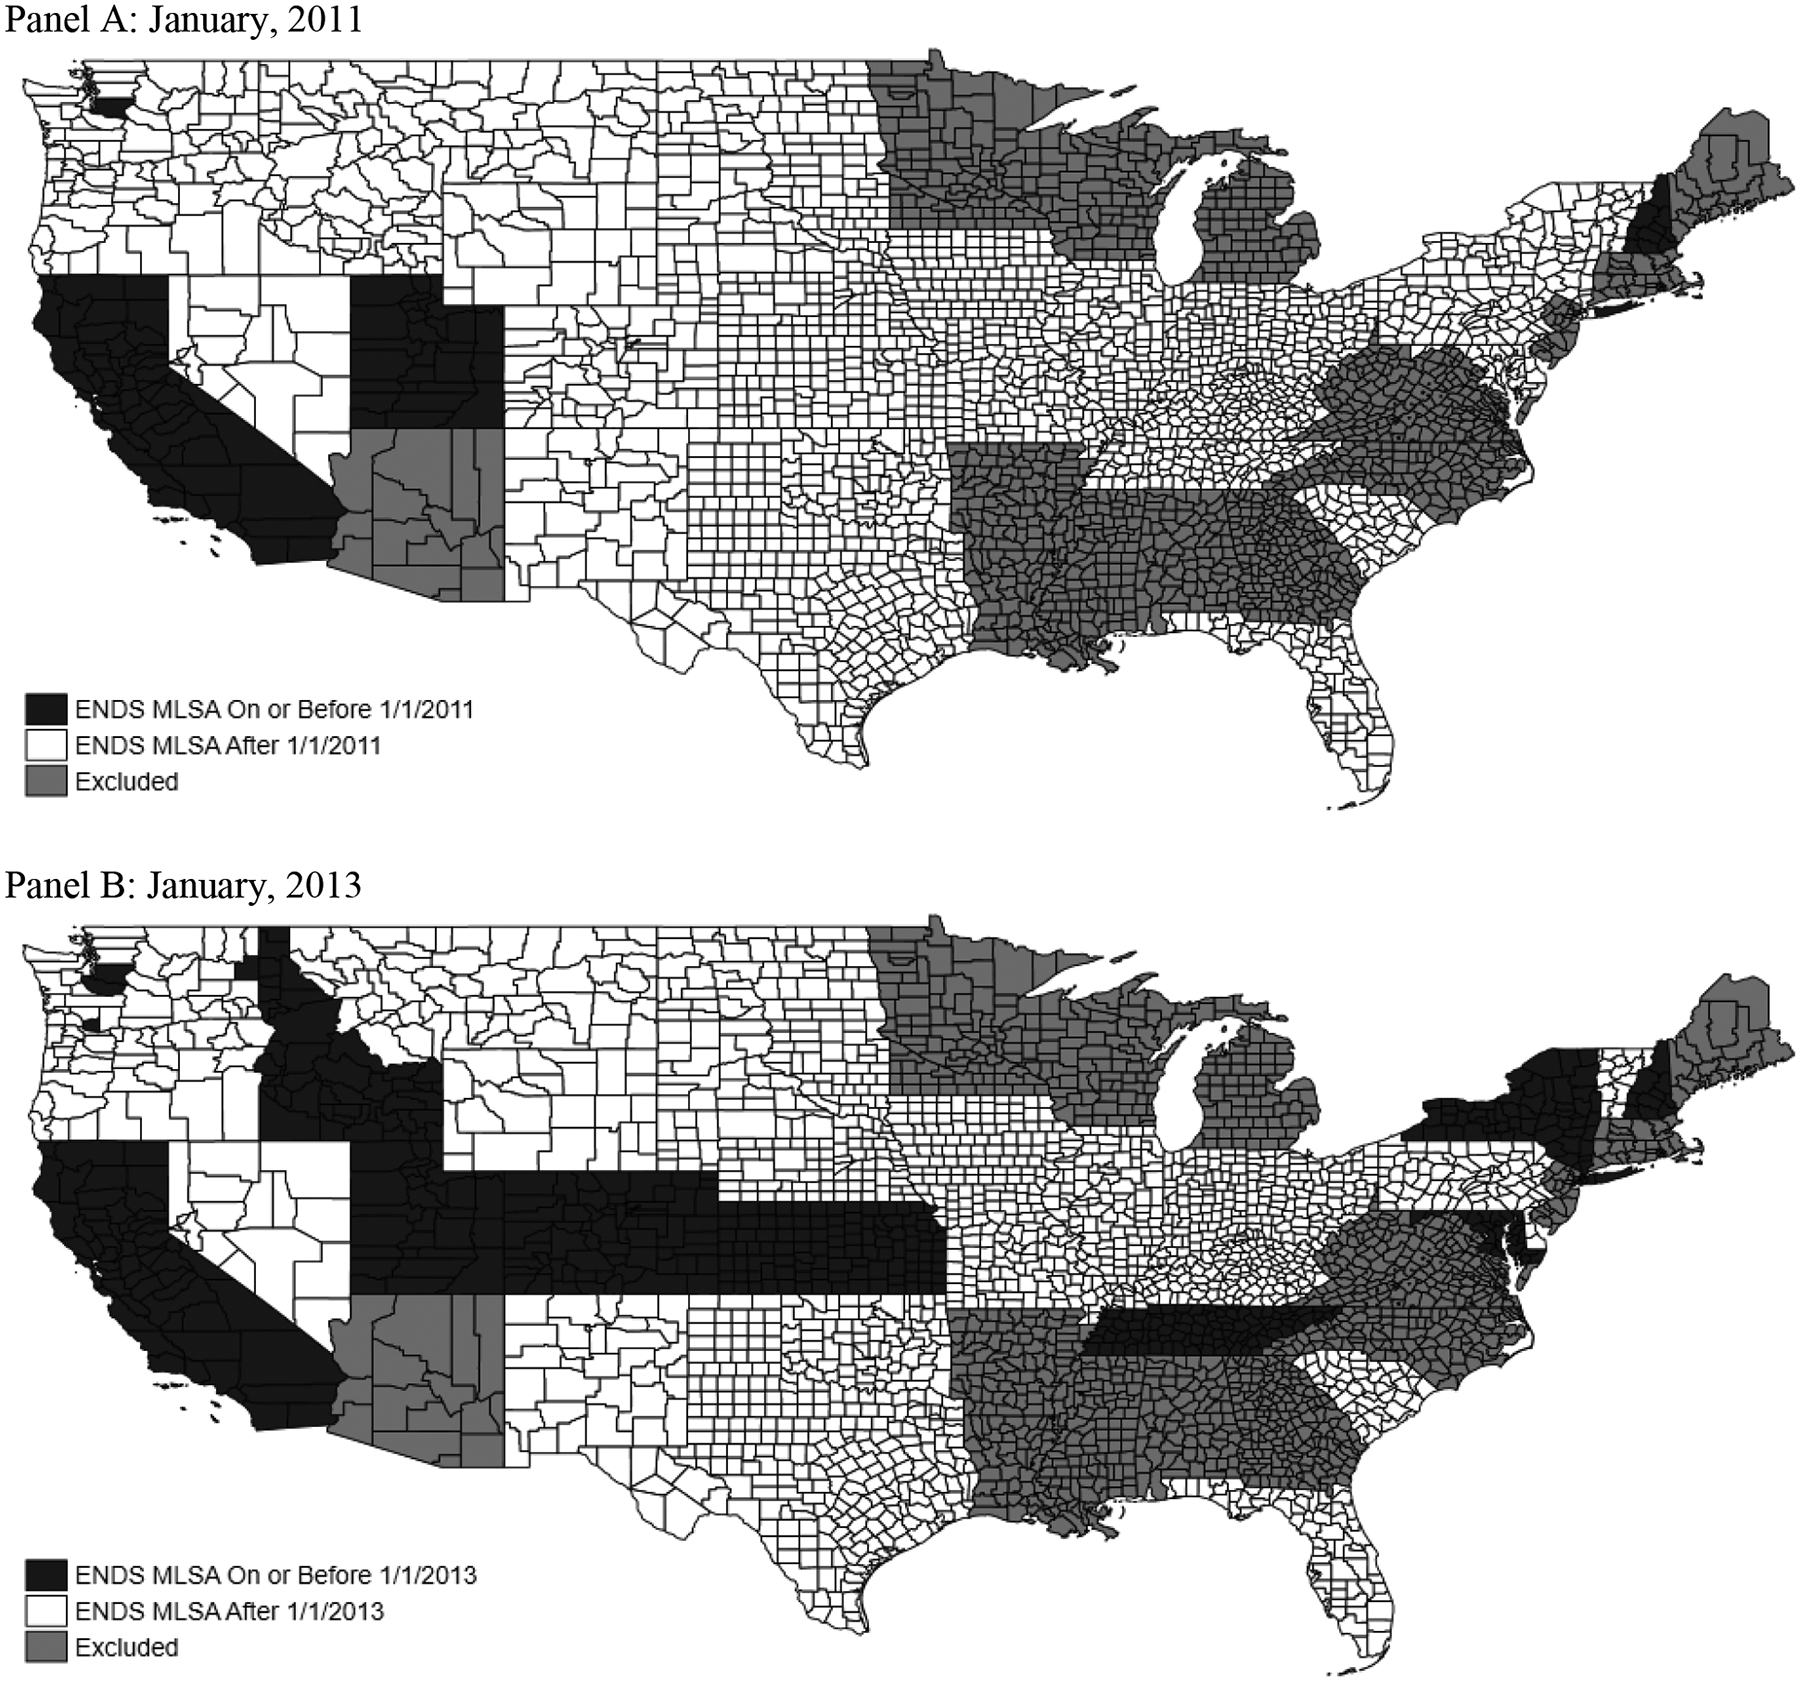
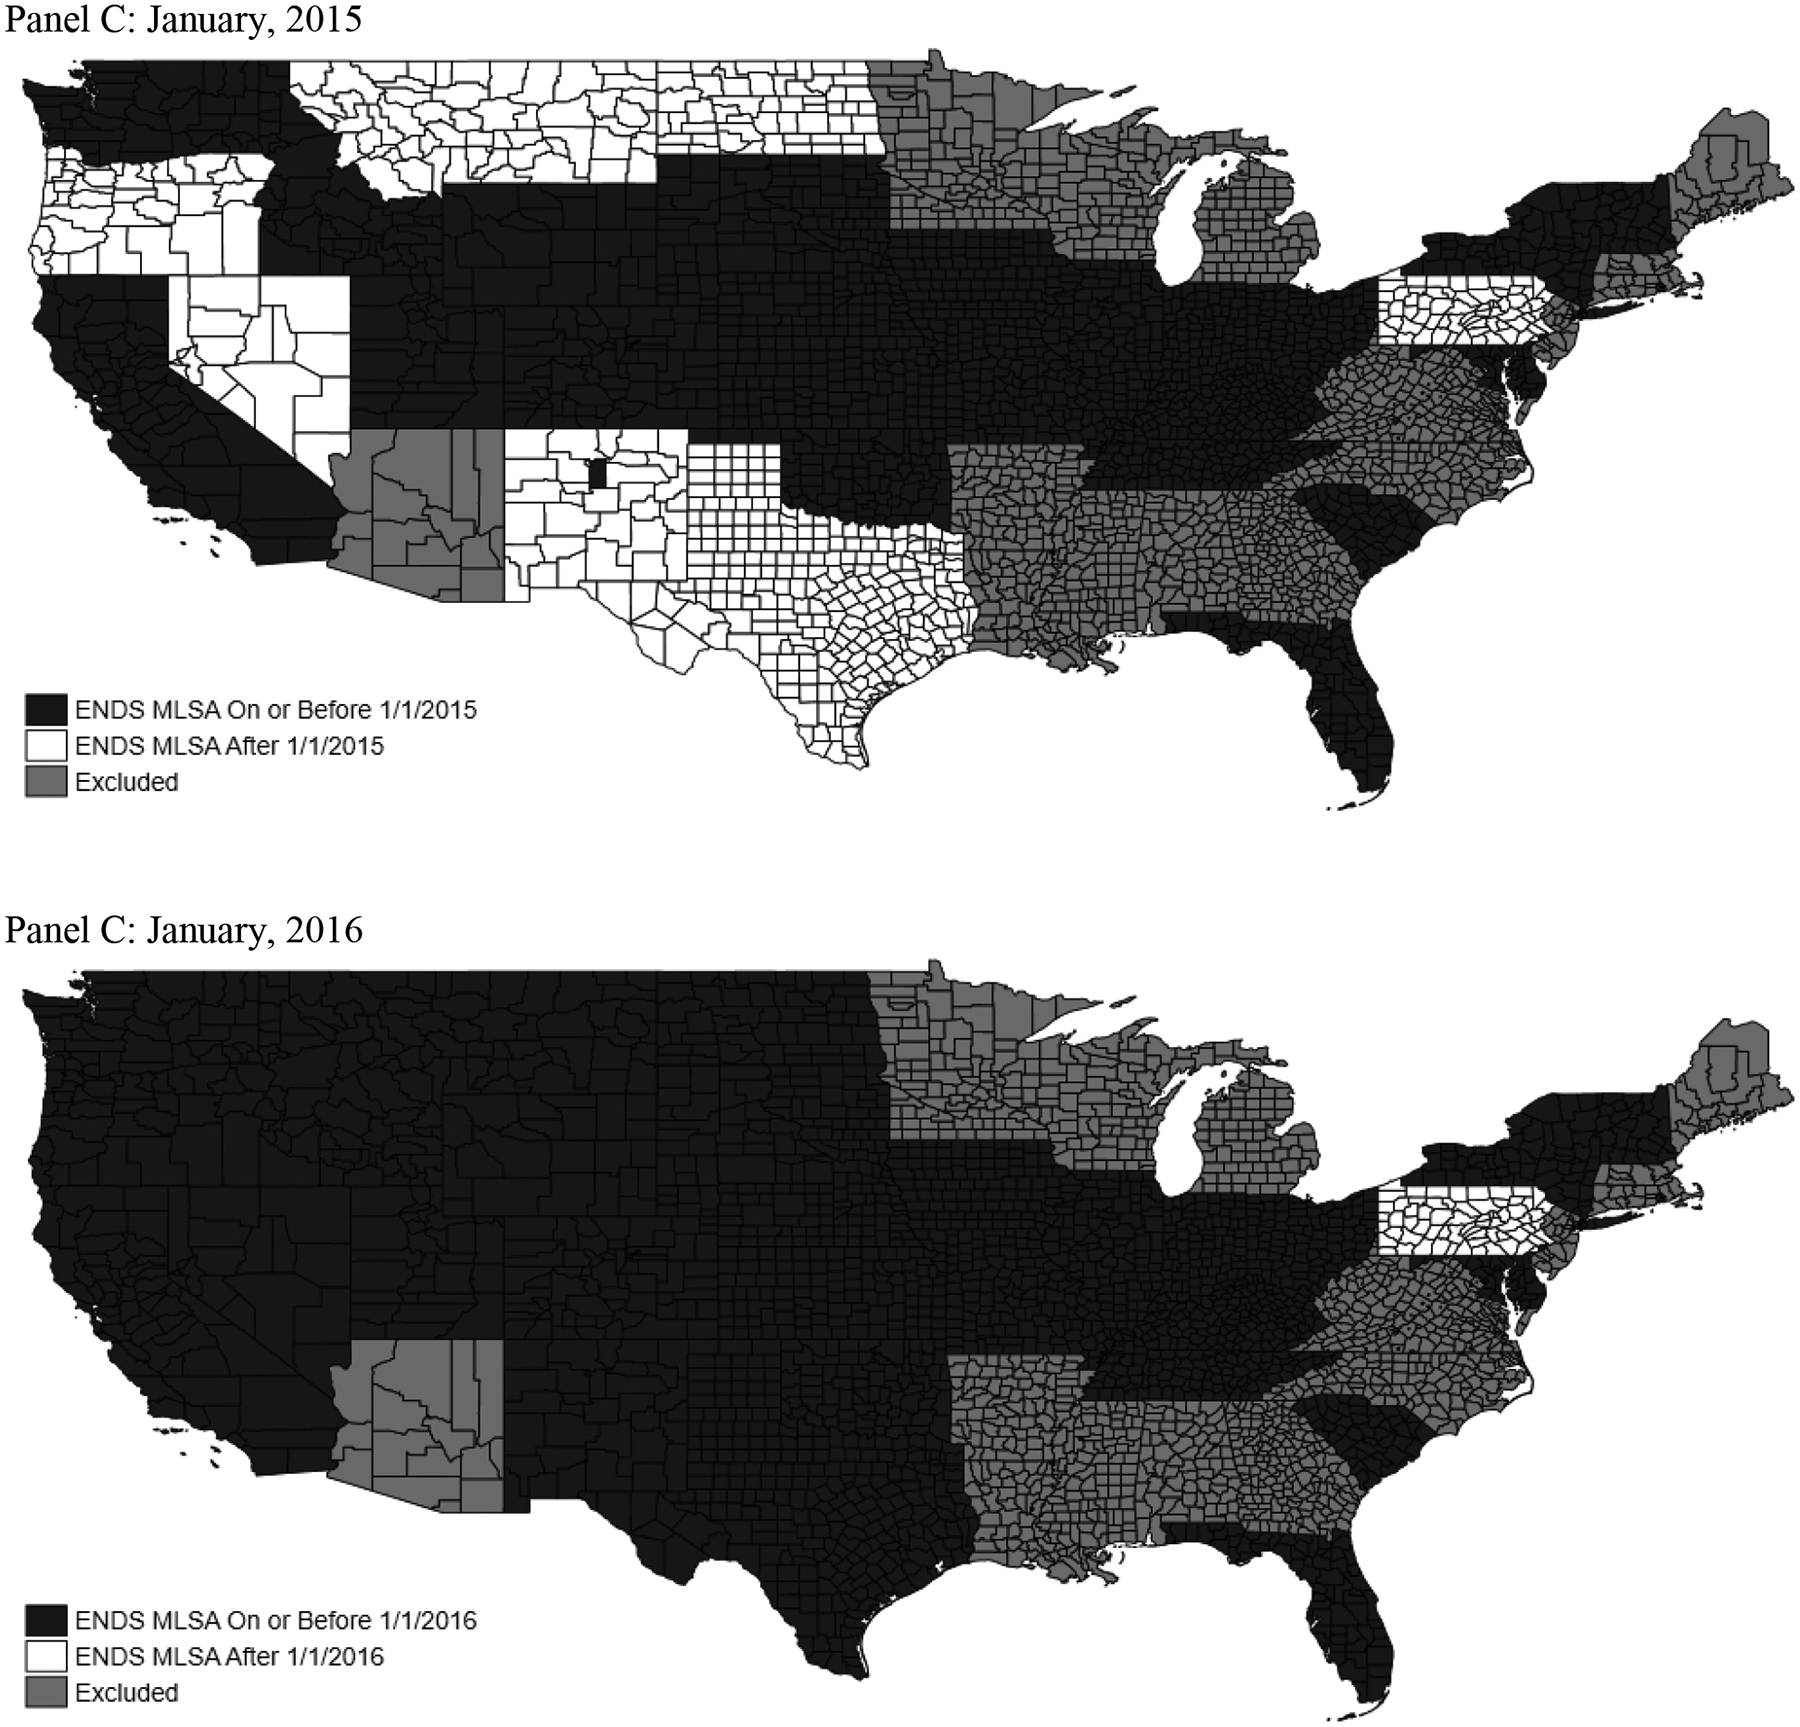
Map of ENDS Policy Environment
Note: Hawaii and Alaska both used unrevised birth records. Records are excluded due to having an MLSA >18, poor data quality, and/or MLSAs primarily being passed at the city level.
Appendix Figure 2:
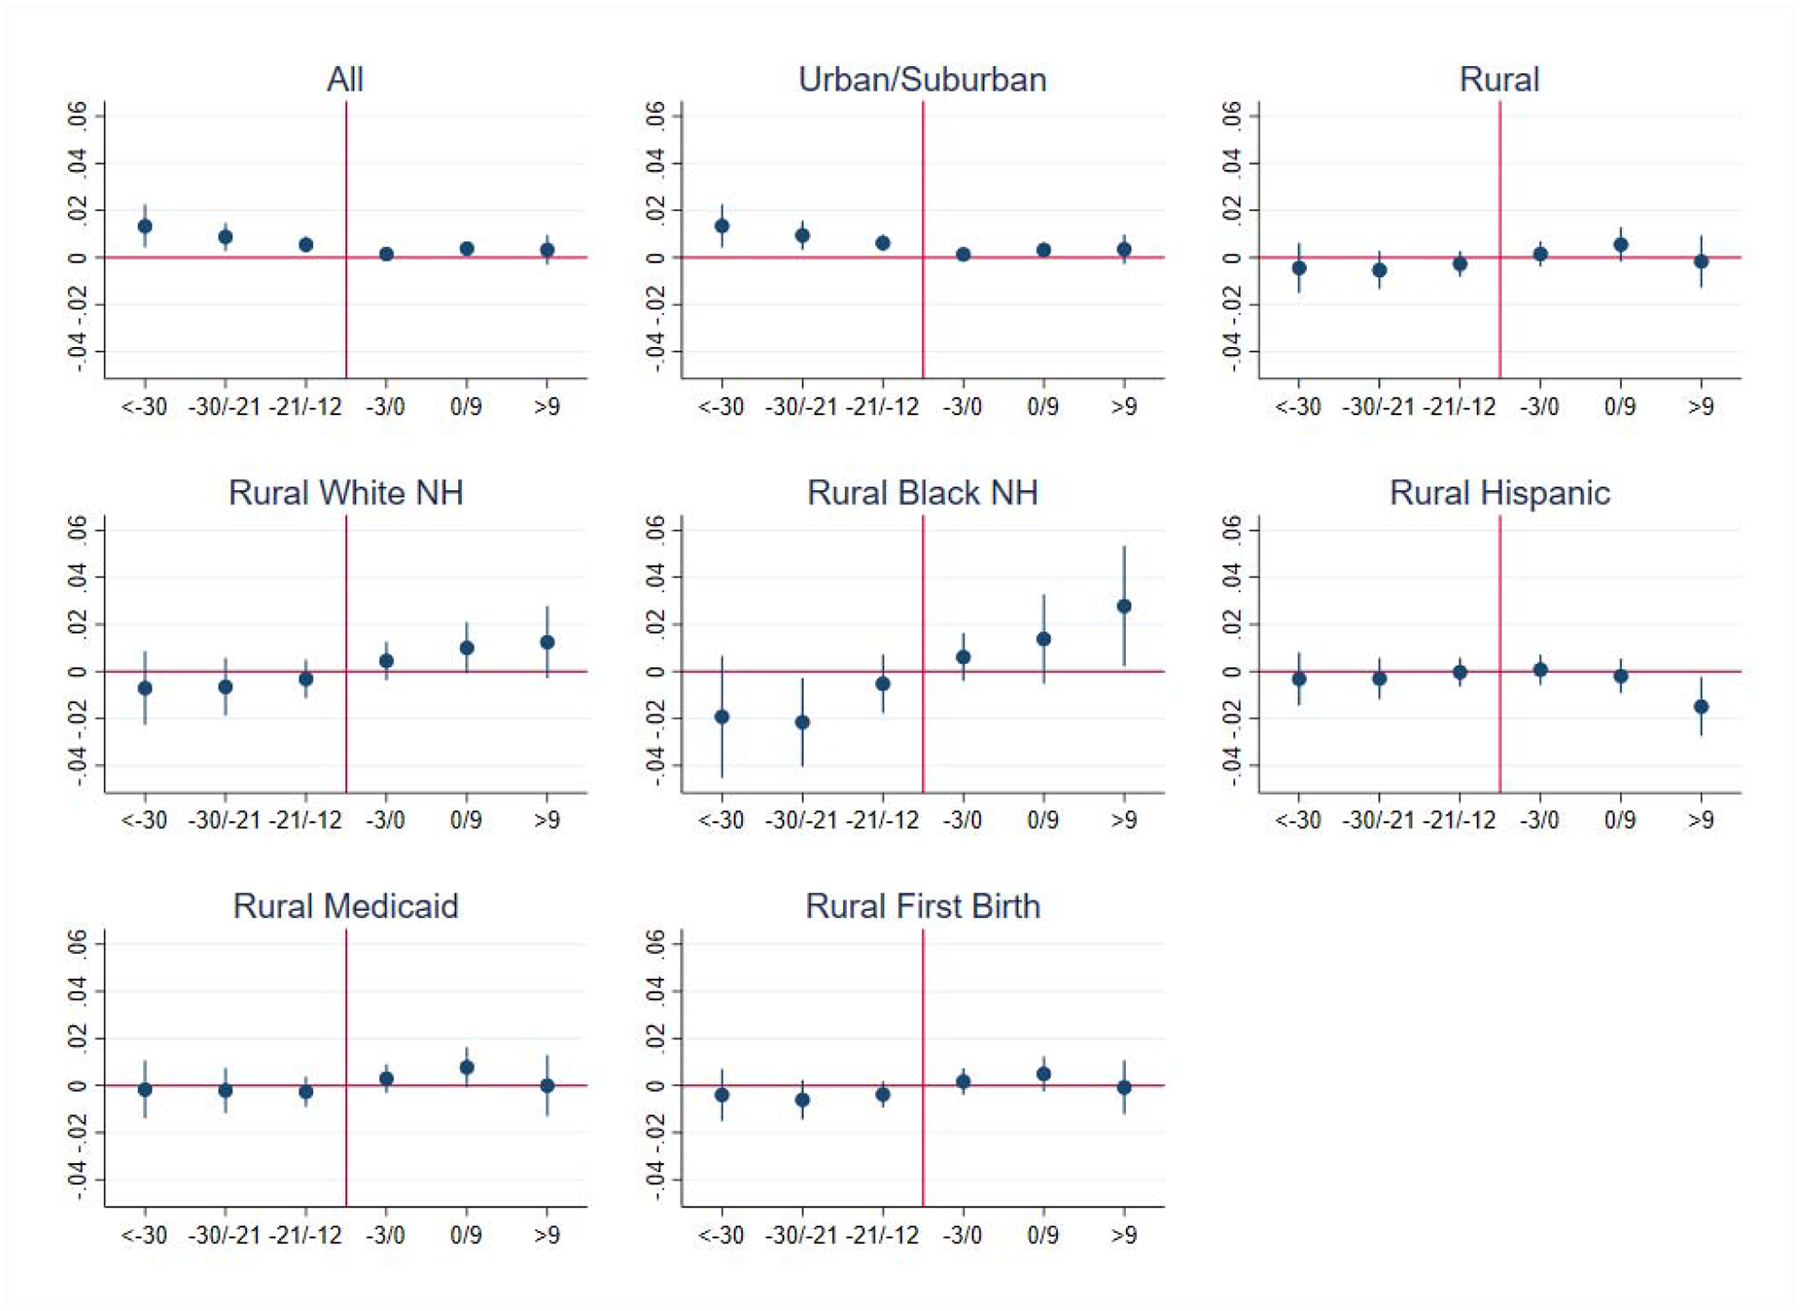
Smoking >=5 Cigarettes Daily, Longitudinal, Event Study
Results are also presented in Appendix Table 5, Panel A.
Appendix Figure 3:
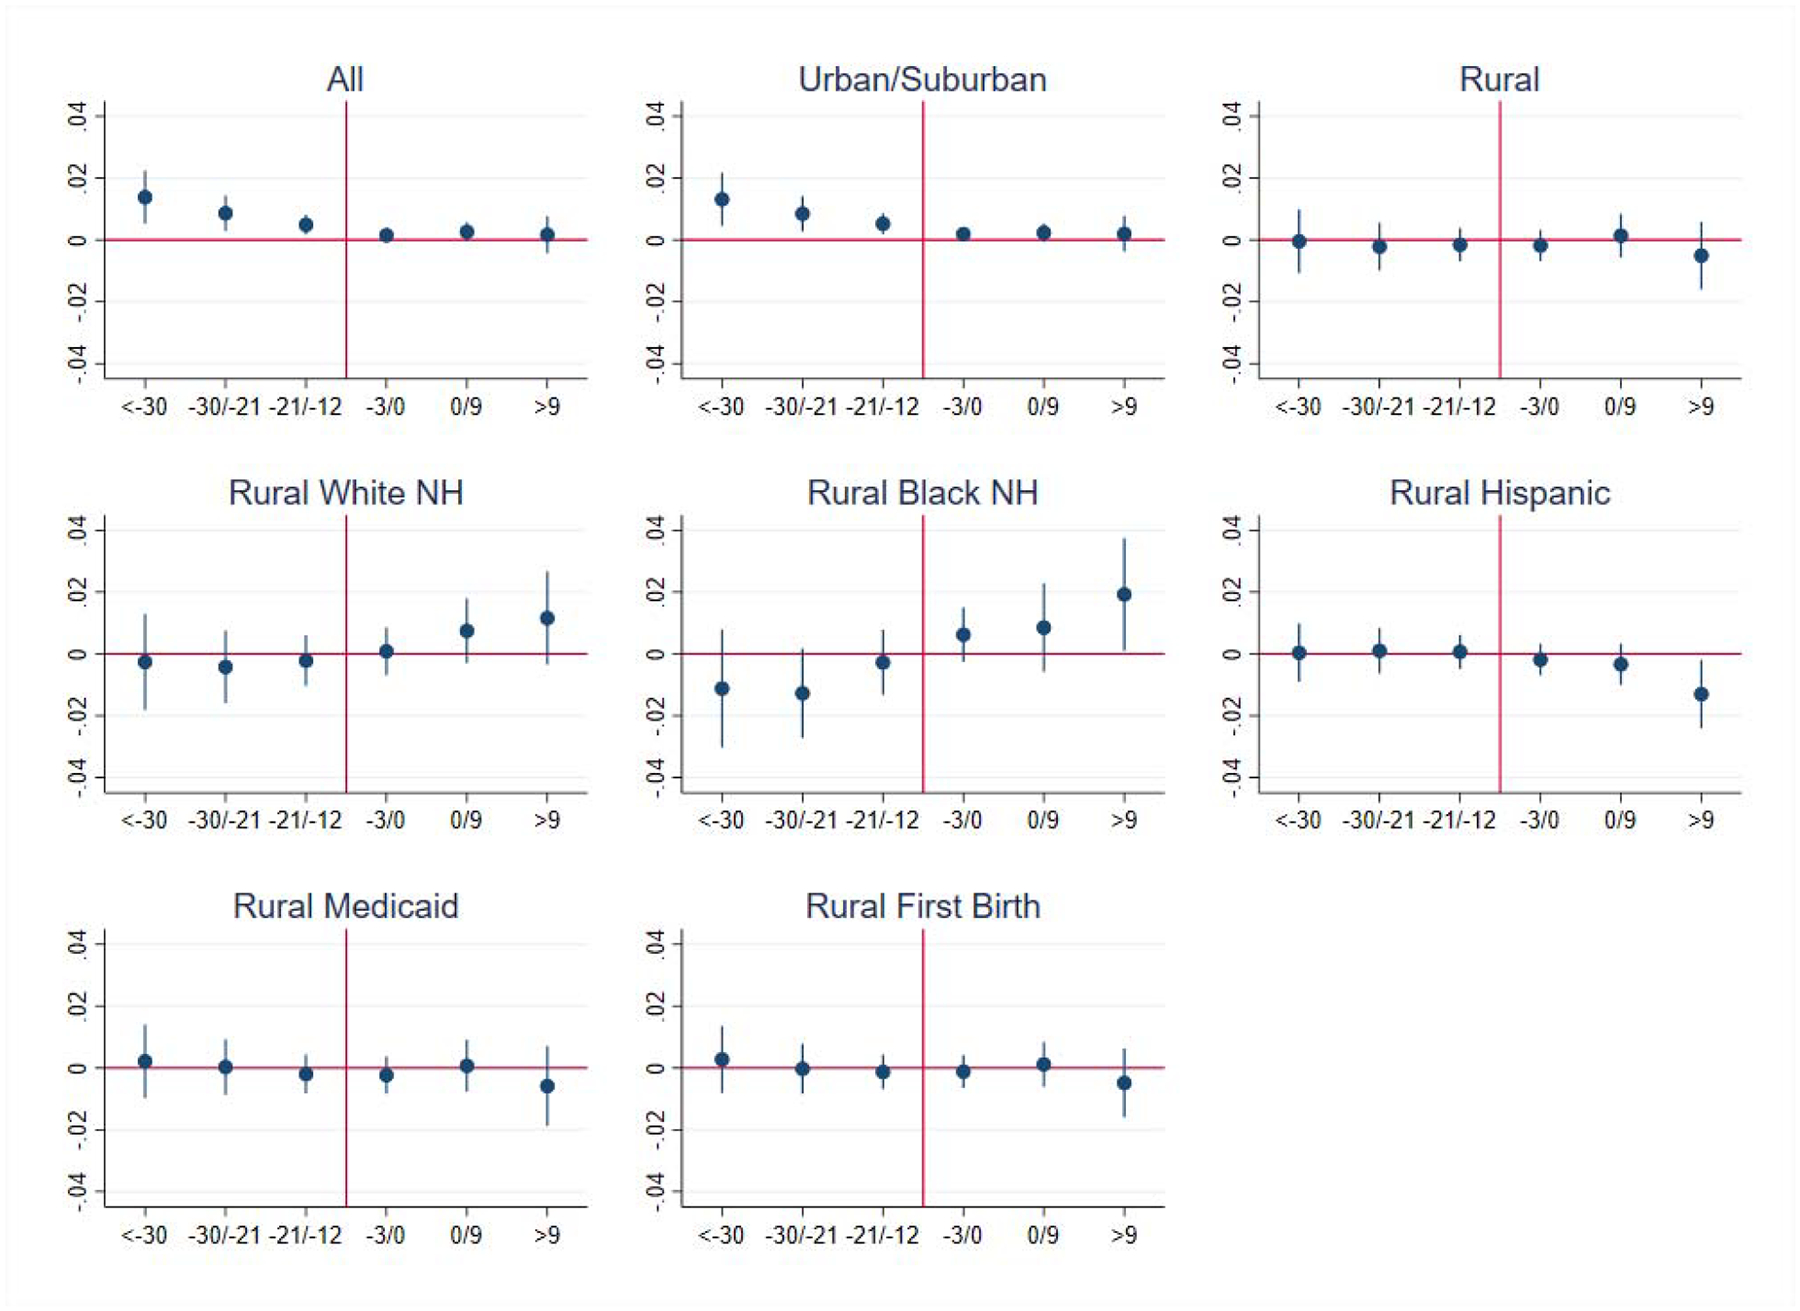
Smoking >=10 Cigarettes Daily, Longitudinal, Event Study
Results are also presented in Appendix Table 5, Panel B.
Appendix Figure 4:

Birth Outcomes, Cross Sectional, Rural White Underage Pregnant Women, Event Study
Results are also presented in Appendix Table 9.
Footnotes
Based on author calculations using birth record data.
Pharmacotherapy interventions for tobacco cessation for pregnant women continue to receive an incomplete grade from the United States Preventive Services Task Force due to uncertain evidence of the overall health benefits (U.S. Preventive Services Task Force, 2015); however, the Affordable Care Act now requires state Medicaid programs to cover pharmacotherapies for smoking cessation without cost sharing for pregnant women (Centers for Medicare & Medicaid Services, 2011) and new private health insurance plans are required to cover smoking cessation products as well (American Lung Association, 2017).
All states were using the revised birth records in 2015 (Centers for Disease Control and Prevention, 2014).
The question specifically asks about cigarette smoking and so is unlikely to be confused with ENDS vaping, especially among teens familiar with these products and their vernacular.
Six of these 32 states were still using unrevised birth records in 2009, and so starting our analysis earlier would significantly reduce our sample. Further, the time period 2010–2016 nicely encompasses almost all of the variation in ENDS MLSAs. The first state (New Hampshire) in our study enacted an ENDS MLSA law in July, 2010.
These states are AK, AL, AR, AZ, CT, HI, LA, ME, MN, MS, NC, NJ, RI, VA, WI, and WV.
This strategy avoids bias arising from our sample being more likely to contain premature births at the end of our data, since only at the point of birth is a birth certificate generated.
Using the month of birth information (provided in the birth records), we assume that the infant was born at the mid-point of the month recorded in the birth record. We then use gestational length in weeks (also provided in the birth records), to identify the estimated point of conception and the start of the three trimesters. The first trimester is defined as the point of ovulation that led to pregnancy. The second trimester is defined as week 14 of pregnancy (14 weeks after last menstrual period). And the third trimester is defined as week 28 of pregnancy.
Two states (MT and OR) passed ENDS MLSA’s on 1/1/2016. This policy variation is used in panel models, affecting 2nd and 3rd trimester smoking for women conceiving in late 2015.
We do not control for ENDS taxes because DC was the only state out of our 32 state sample that adopted an ENDS tax by the trimester start date for women conceiving on or before January 1, 2016, and we do not use DC in our preferred sample of rural counties.
We control for each tobacco type/venue separately using indicators for no restrictions, partial restrictions, or full restrictions.
A synthetic control group model could in theory also be used to establish parallel trends, but these models require significant pre-adoption data. Using data from before 2010 would cause us to lose a considerable number of states that were not using revised birth records before then. Therefore, we believe our approach of selecting a group of counties that does exhibit parallel trends is the strongest feasible methodology.
Payment method also helps control for the mother’s economic condition. Besides payment source, birth records do not provide any direct information on the teen’s employment status, income, or economic support.
The main limitation of using either of these alternative samples for our baseline analysis is that then we would not be able to explore pre-trends using event study design, either because of insufficient pre-policy variation for the sample from 2013–2016 or because of states entering the sample at different points in time when using the 2010–2016 sample. Therefore, we maintain the 2010–2016 sample that imposes the restriction that states must have revised their birth records by 2010 as the baseline.
While outside the time period of this study, ENDS use did peak again in 2018 (Cullen et al., 2018).
We also estimated the same model for only rural pre-pregnancy “heavy” smokers (>=10 cigarettes daily). While we have only 928 rural pre-pregnancy heavy smokers in our sample, the coefficients were larger here, suggesting that ENDS MLSAs disproportionately reduced smoking reduction and cessation among the heaviest pre-pregnancy smokers. ENDS MLSAs increased any smoking participation in a given trimester by 3.2 pp (p<0.10) for pre-pregnancy heavy smokers, increased medium/heavy smoking participation by 3.5 pp (p<0.10) for pre-pregnancy heavy smokers, and increased heavy smoking participation by 2.0 pp (p>0.10) for pre-pregnancy heavy smokers.
For example, the Surgeon General suggests that smoking reduces birth weight by between 200–300 grams (U.S. Department of Health and Human Services, 2014). In our case we observe a 0.6 pp increase in smoking from the law then we can expect a 0.6 pp × 250 = 1.5 gram reduction in birth weight (ignoring any compensating benefit from reducing vaping), which compared to a sample mean of 3,196 is far smaller than the size of the confidence interval for the effect of ENDS MLSAs on birth weight.
In 2010, 30.3% of national births to underage white teens were in rural areas.
Contributor Information
Michael F. Pesko, Department of Economics, Andrew Young School of Policy Studies, Georgia State University.
Janet M. Currie, Princeton University, Woodrow Wilson School of Public and International Affairs.
References
- Abouk R, & Adams S (2017). Bans on electronic cigarette sales to minors and smoking among high school students. Journal of Health Economics, 54, 17–24. [DOI] [PubMed] [Google Scholar]
- American Lung Association. (2017). Affordable Care Act Timeline. Retrieved from https://www.lung.org/our-initiatives/tobacco/cessation-and-prevention/affordable-care-act-timeline.html
- Arrazola RA, Singh T, Corey CG, Husten CG, Neff LJ, Apelberg BJ, … Cox S (2015). Tobacco use among middle and high school students—United States, 2011–2014. MMWR Morb Mortal Wkly Rep, 64(14), 381–385. [PMC free article] [PubMed] [Google Scholar]
- Autor DH (2003). Outsourcing at Will: The Contribution of Unjust Dismissal Doctrine to the Growth of Employment Outsourcing. Journal of Labor Economics, 21, 1–42. [Google Scholar]
- Centers for Disease Control and Prevention. (2013). Data Access - Urban Rural Classification Scheme for Counties. Retrieved from: https://www.cdc.gov/nchs/data_access/urban_rural.htm
- Centers for Disease Control and Prevention. (2014, July 30,2014). The Birth Certificate (Finally) Goes National. Retrieved from http://www.cdc.gov/nchs/features/birth_certificate_goes_final.htm. Accessed: 2016-05-26 (Archived by WebCite® at http://www.webcitation.org/6hnl2Q1nM)
- Centers for Disease Control and Prevention. (2015, September 9, 2015). Tobacco Use and Pregnancy. Retrieved from http://www.cdc.gov/reproductivehealth/maternalinfanthealth/tobaccousepregnancy/. Accessed: 2016-05-26 (Archived by WebCite® at http://www.webcitation.org/6hnmgwdlF)
- Centers for Disease Control and Prevention. (2018). State Tobacco Activities Tracking and Evaluation(STATE) System. Retrieved from: https://www.cdc.gov/statesystem/index.html
- Centers for Medicare & Medicaid Services. (2011). Letter: New Medicaid Tobacco Cessation Services. Retrieved from https://downloads.cms.gov/cmsgov/archived-downloads/SMDL/downloads/SMD11-007.pdf.
- Coleman T, Cooper S, Thornton JG, Grainge MJ, Watts K, Britton J, … Pregnancy Trial T (2012). A randomized trial of nicotine-replacement therapy patches in pregnancy. N Engl J Med, 366(9), 808–818. doi: 10.1056/NEJMoa1109582 [DOI] [PubMed] [Google Scholar]
- Colman G, Grossman M, & Joyce T (2003). The effect of cigarette excise taxes on smoking before, during and after pregnancy. Journal of Health Economics, 22(6), 1053–1072. [DOI] [PubMed] [Google Scholar]
- Cooper MT, & Pesko MF (2017). The effect of e-cigarette indoor vaping restrictions on adult prenatal smoking and birth outcomes. J Health Econ, 56, 178–190. doi: 10.1016/j.jhealeco.2017.10.002 [DOI] [PMC free article] [PubMed] [Google Scholar]
- Cotti C, Nesson E, & Tefft N (2018). The relationship between cigarettes and electronic cigarettes: Evidence from household panel data. Journal of Health Economics, 61, 205–219. [DOI] [PubMed] [Google Scholar]
- Cullen KA, Ambrose BK, Gentzke AS, Apelberg BJ, Jamal A, & King BA (2018). Notes from the Field: Use of Electronic Cigarettes and Any Tobacco Product Among Middle and High School Students — United States, 2011–2018. Retrieved from https://www.cdc.gov/mmwr/volumes/67/wr/mm6745a5.htm [DOI] [PMC free article] [PubMed]
- Curtin SC, & Mathews TJ (2016). Smoking Prevalence and Cessation Before and During Pregnancy: Data from the Birth Certificate, 2014. National Vital Statistics Reports, 65(1), 1–14. [PubMed] [Google Scholar]
- Dave D, Feng B, & Pesko MF (2019). The Effects of E-Cigarette Minimum Legal Sale Age Laws on Youth Substance Use. Health Economics. [DOI] [PMC free article] [PubMed] [Google Scholar]
- Ertan Yörük C, & Yörük BK (2016). Do minimum legal tobacco purchase age laws work? Contemporary Economic Policy, 34(3), 415–429. [Google Scholar]
- Friedman AS (2015). How does electronic cigarette access affect adolescent smoking? J Health Econ, 44, 300–308. doi: 10.1016/j.jhealeco.2015.10.003 [DOI] [PubMed] [Google Scholar]
- Hamilton BE, Rossen LM, & Branum AM (2016). Teen Birth Rates for Urban and Rural Areas in the United States, 2007–2015. NCHS Data Brief(264), 1–8. [PubMed] [Google Scholar]
- Hartmann-Boyce J, McRobbie H, Bullen C, Begh R, Stead LF, & Hajek P (2016). Electronic cigarettes for smoking cessation. Cochrane Database Syst Rev, 9, CD010216. doi: 10.1002/14651858.CD010216.pub3 [DOI] [PMC free article] [PubMed] [Google Scholar]
- Howland RE, Mulready-Ward C, Madsen AM, Sackoff J, Nyland-Funke M, Bombard JM, & Tong VT (2015). Reliability of reported maternal smoking: comparing the birth certificate to maternal worksheets and prenatal and hospital medical records, New York City and Vermont, 2009. Maternal and child health journal, 19(9), 1916–1924. [DOI] [PMC free article] [PubMed] [Google Scholar]
- Kapaya M, Tong V, & Ding H (2015). Nicotine replacement therapy and other interventions for pregnant smokers: Pregnancy Risk Assessment Monitoring System, 2009–2010. Prev Med, 78, 92–100. doi: 10.1016/j.ypmed.2015.07.008 [DOI] [PMC free article] [PubMed] [Google Scholar]
- Kurti AN, Redner R, Lopez AA, Keith DR, Villanti AC, Stanton CA, … Higgins ST (2017). Tobacco and nicotine delivery product use in a national sample of pregnant women. Prev Med, 104, 50–56. doi: 10.1016/j.ypmed.2017.07.030 [DOI] [PMC free article] [PubMed] [Google Scholar]
- Lopez AA, Redner R, Kurti AN, Keith DR, Villanti AC, Stanton CA, … Higgins ST (2018). Tobacco and nicotine delivery product use in a U.S. national sample of women of reproductive age. Prev Med. doi: 10.1016/j.ypmed.2018.03.001 [DOI] [PMC free article] [PubMed] [Google Scholar]
- Miech R, Johnston L, O’Malley P, Bachman J, & Schulenberg J (2014). E-cigarettes surpass tobacco cigarettes among teens. Ann Arbor, MI: University of Michigan News Service. Retrieved from http://monitoringthefuture.org/pressreleases/14cigpr.pdf [Google Scholar]
- National Conference of State Legislatures. (2016). Alternative Nicotine Products | Electronic Cigarettes. Retrieved from http://www.ncsl.org/research/health/alternative-nicotine-products-e-cigarettes.aspx
- New Jersey Global Advisors Smokefree Policy. (2015, January 22,2015). Electronic Smoking Devices. Retrieved from http://www.njgasp.org/wp-content/uploads/2014/05/E-Cigs_White_Paper.pdf
- Oncken C, Ricci KA, Kuo C-L, Dornelas E, Kranzler HR, & Sankey HZ (2017). Correlates of Electronic Cigarettes Use Before and During Pregnancy. Nicotine & Tobacco Research, 19(5), 585–590. [DOI] [PMC free article] [PubMed] [Google Scholar]
- Pesko MF, Hughes JM, & Faisal FS (2016). The influence of electronic cigarette age purchasing restrictions on adolescent tobacco and marijuana use. Prev Med, 87, 207–212. doi: 10.1016/j.ypmed.2016.02.001 [DOI] [PubMed] [Google Scholar]
- Royal College of Physicians. (2016). Nicotine without smoke: Tobacco harm reduction. Retrieved from https://www.rcplondon.ac.uk/projects/outputs/nicotine-without-smoke-tobacco-harm-reduction-0
- Siu AL, & Force USPST (2015). Behavioral and Pharmacotherapy Interventions for Tobacco Smoking Cessation in Adults, Including Pregnant Women: U.S. Preventive Services Task Force Recommendation Statement. Ann Intern Med, 163(8), 622–634. doi: 10.7326/M15-2023 [DOI] [PubMed] [Google Scholar]
- U.S. Department of Health and Human Services. (2014). The health consequences of smoking-50 years of progress: A report of the Surgeon General. Atlanta, GA: US Department of Health and Human Services, Centers for Disease Control and Prevention, National Center for Chronic Disease Prevention and Health Promotion, Office on Smoking and Health; Retrieved from https://www.surgeongeneral.gov/library/reports/50-years-of-progress/full-report.pdf. [Google Scholar]
- U.S. Department of Health and Human Services. (2016). E-cigarette use among youth and young adults: a report of the Surgeon General. Atlanta, GA: US Department of Health and Human Services, Centers for Disease Control and Prevention, National Center for Chronic Disease Prevention and Health Promotion, Office on Smoking and Health; Retrieved from https://e-cigarettes.surgeongeneral.gov/documents/2016_sgr_full_report_non-508.pdf. [Google Scholar]
- U.S. Preventive Services Task Force. (2015, September, 2015). Tobacco Smoking Cessation in Adults and Pregnant Women: Behavioral and Pharmacotherapy Interventions. Retrieved from http://www.uspreventiveservicestaskforce.org/Page/Document/RecommendationStatementFinal/tobacco-use-in-adults-and-pregnant-women-counseling-and-interventions1. Accessed: 2016-05-26 (Archived by WebCite® at http://www.webcitation.org/6hnna7KGx)
- Wang TW, Gentzke A, Sharapova S, Cullen KA, Ambrose BK, & Jamal J (2018). Tobacco Product Use Among Middle and High School Students — United States, 2011–2017. Retrieved from https://www.cdc.gov/mmwr/volumes/67/wr/mm6722a3.htm [DOI] [PMC free article] [PubMed]