

Summary
BACKGROUND:
After a steady decline for 20 years, the pace of decline of TB incidence in the United States has slowed.
METHODS:
Trends in TB incidence rates and case counts since 1993 were analyzed using national US surveillance data. Patient characteristics reported during 2014–2017 were compared with those for 2010–2013.
RESULTS:
TB rates and case counts have slowed to an annual decline 2.2% (95% confidence interval (CI): –3.4– –1.0) and 1.5% (95% CI: –2.7– –0.3) respectively, since 2012, with declines among US-born persons and no change among non-US–born persons. Overall, persons with TB diagnosed during 2014–2017 were older, more likely to have combined pulmonary and extrapulmonary disease compared with exclusively extrapulmonary disease, more likely to be of nonwhite race, and less likely to be human immunodeficiency virus-positive, or have cavitary pulmonary disease. During 2014–2017, non-US–born persons with TB were more likely to have diabetes while the US-born were more likely to have smear positive TB and use noninjecting drugs.
CONCLUSION:
Changes in epidemiologic trends are likely to affect TB incidence for coming decades. CDC has called for increased attention toward preventing TB through detection and treatment of latent TB infection.
Keywords: tuberculosis, Mycobacterium tuberculosis, incidence trends, vulnerable populations
Introduction
Since the early 1990s, cases of reported tuberculosis (TB) in the United States have declined from 26 673 in 1992, to 9105 in 2017.1 The decline is attributable in large part to improved TB case management, more consistent use of directly observed therapy, and widespread implementation of drug susceptibility testing.2,3,4 During 1995–2014, up to 319 000 cases were averted by improved TB control funding and management practices in the United States.5 However, after 20 years of steady decline, the United States has experienced a slowing in progress toward TB elimination1,6 Annual TB incidence in the United States declined steadily from 9.7/100,000 persons during 1993 to approximately 3.0/100,000 during 2013–2017 (range 3.0 to 2.8/100,000 during 2013–2017). As US TB incidence has declined, the proportion of TB patients in the United States who were born in high TB burden countries has shifted.1 We analyzed epidemiologic changes associated with the slowing of the pace of decline during 2014–2017.
Methods
Study population
We conducted the analysis by using the US National Tuberculosis Surveillance System (NTSS) data for as of June 1, 2018, for data regarding verified cases of TB reported from the 50 states and the District of Columbia. A standardized report form, the Report of Verified Case of TB,7 with standard variable definitions has been used since 1993 to collect patient-level data related to demographics, clinical characteristics, laboratory results, and social risk factors within the previous year before TB diagnosis. Additional variables (e.g., diabetes, immunosuppression not caused by human immunodeficiency virus [HIV] infection, end-stage renal disease, and interferon-gamma release assay or nucleic acid amplification test results for diagnosis) were added in 2009 and have been collected by all TB program areas since 2010.7 Persons with TB are considered US-born if they are born in the United States, a US territory (Puerto Rico, Guam, US Virgin Islands, American Samoa, or the Commonwealth of the Northern Mariana Islands), or abroad of a US-citizen parent.
Analyses
Incidence rates of TB by racial/ethnic and nativity subcategories were calculated by using population denominator data from the American Community Survey.8 To assess changes in time trends that were significant by Monte Carlo permutation test at the P <.05 level, we used Joinpoint regression version 4.0.4 (National Institutes of Health, National Cancer Institute),9,10 using the default number of joinpoints of four to examine average annual percentage change (APC) for TB incidence rates and case counts overall and by origin of birth (nativity). An APC that is not significant indicates a flat slope or no significant change over time, i.e. the APC is not significantly different from a slope of zero. To determine if increased TB transmission might account for increases in TB cases, we examined the percentage of TB cases attributed to recent TB transmission on the basis of an algorithm that uses genotyping and epidemiologic information for plausible source cases over the previous 2 years.11 Recent transmission analyses based on genotyping results were first applied nationwide in 2011; therefore, results for recent transmission are described for 2011–2017. We compared the frequency and proportion of TB patient demographic, diagnostic, and clinical characteristics for 2014–2017 with 2010–2013 to assess recent changes in the epidemiology of TB; 2010 was the starting point for that analysis to capture new NTSS variables adapted by all reporting areas that year and 2014 was chosen as the starting year for the comparison group because that was the first year after the joinpoint signifying the slowing of decline in incidence for both the US-born and the non-US–born. The binary outcome in multivariable models estimating relative risk for a TB patient having a certain characteristic was the patient being reported in 2014–2017, compared with 2010–2013. SAS® version 9.4 (SAS Institute, Inc., Cary, North Carolina) was used for all bivariate and multivariable analyses, with P <.01 considered statistically significant. Multivariable models stratified by nativity were selected through backward elimination.
Institutional Review Board review was not required for this analysis, which used routinely reported de-identified national surveillance data. NTSS operates under an Assurance of Confidentiality issued by CDC under Section 308(d) of the Public Health Service Act (42 USC 242m(d)).
Results
TB incidence trends
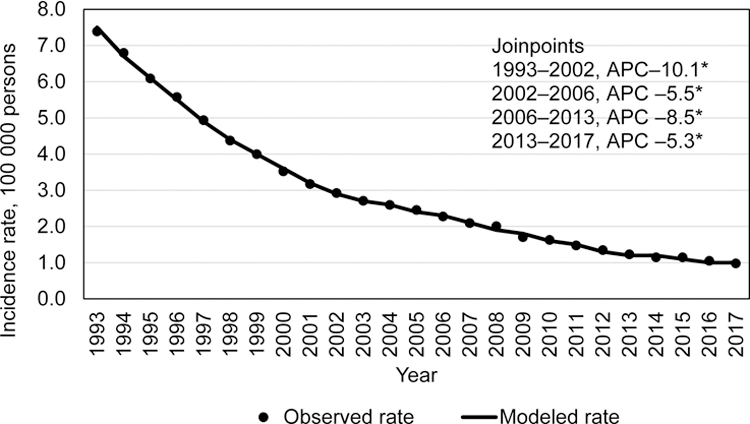
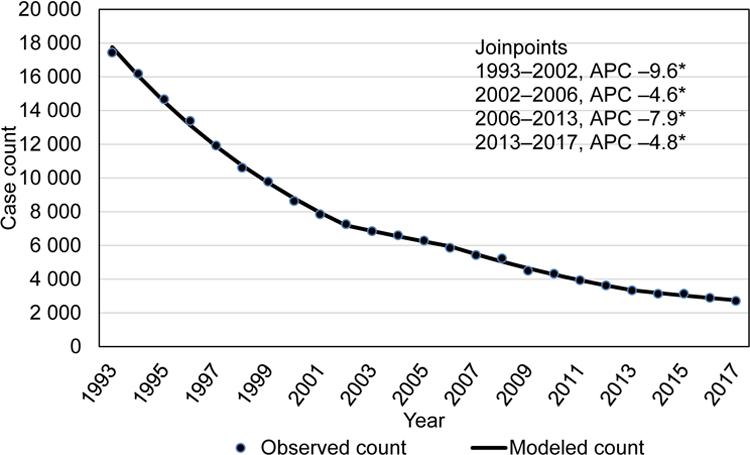
During 1993–2017, a total of 369 300 confirmed TB cases were reported in the United States. The 1993 incidence was 9.7/100 000 and declined by varying degrees throughout the years (Figure 1a). During 2012–2017, incidence declined more slowly from 3.2/100,000 persons in 2012 to 2.8/100,000 persons in 2017 (–2.2% APC; 95% CI: –3.4%– –1.0%). TB case counts followed a similar trend, with the exception of a rise in case count in 2015, but the overall trend was a statistically significant slight decline from 2012 to 2017, (–1.5% APC, 95% CI: –2.7– –0.3) (Figure 1b). When analyzing case counts for 24 states reporting at least 100 cases in 2017, there was no discernable geographic pattern of states with increasing or decreasing counts since 2015 or 2016.
Figure 1a.
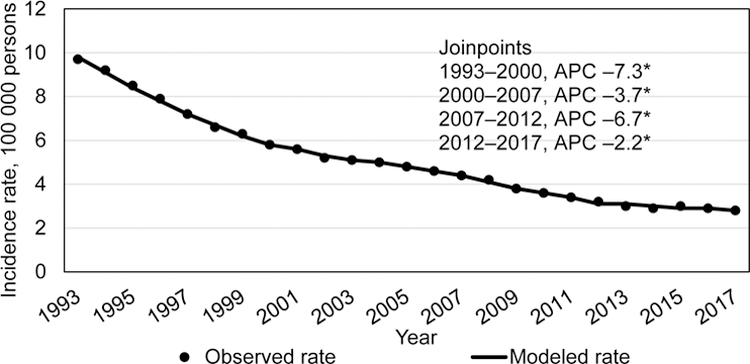
Trends in tuberculosis incidence, US National Tuberculosis Surveillance System, 1993–2017.
Figure 1b.
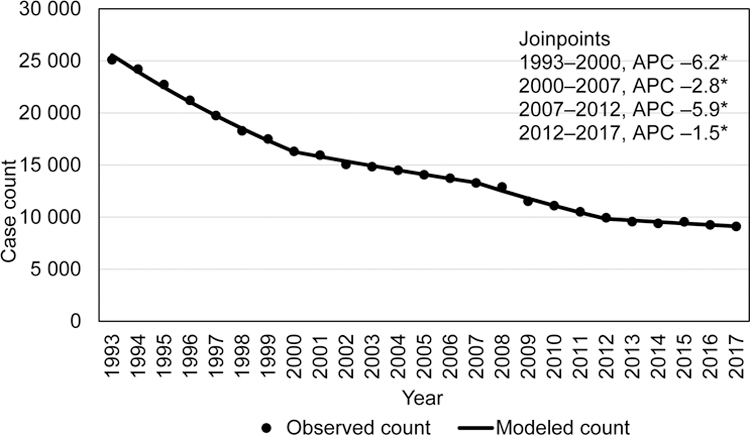
Tuberculosis case counts, US National Tuberculosis Surveillance System, 1993–2017
Among non-US–born persons with TB (total 182 429 cases), a rapid decline in incidence rates occurred during 1995–1998 (–8.5% APC; 95% CI: –13.1%– –3.7%), with declines in subsequent years (2001–2013 (–4.4 APC; 95% CI: –4.7– –4.0)), followed by a slower decline during 2013–2017 (–1.6% APC; 95% CI: –3.4– 0.2) that was not statistically significantly different from a zero APC slope (Figure 2a). The trend in yearly TB case counts among non-US–born persons (Figure 2b), however, was substantially different from those of incidence rates. TB case counts among non-US–born persons were level during 1993–2007 (0.2% APC; 95% CI: –0.1%– 0.4%), then declined during 2007–2012 (–4.5% APC; 95% CI: –6.3%– –2.7%), and were level again during 2013–2017 (0.5% APC; 95% CI: –0.9%–2.0%).
Figure 2a.
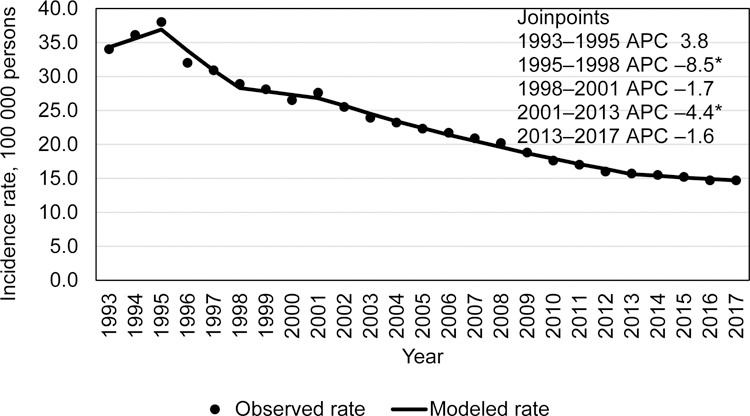
Incidence trends among non-US–born tuberculosis patients, US National Tuberculosis Surveillance System, 1993–2017.
Figure 2b.
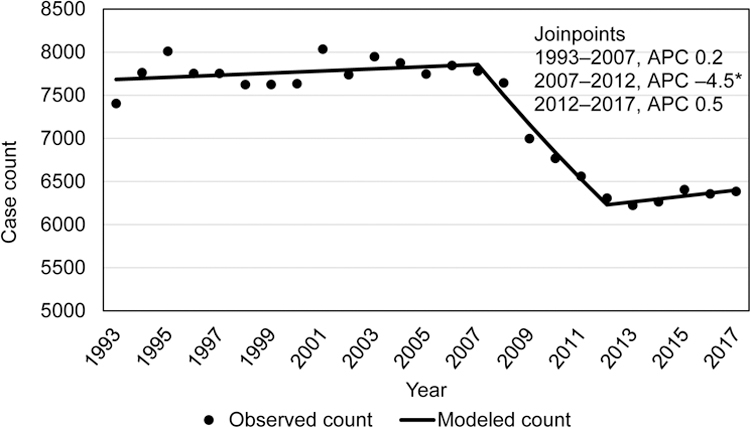
Trends in case counts among non-US–born tuberculosis patients, US National Tuberculosis Surveillance System, 1993–2017.
Similar to the overall TB incidence rates and case counts, US-born persons during 1993–2017 (total 185 554 cases) experienced declining TB trends (Figure 3a and b). An incidence of 7.4/100,000 persons occurred in 1993, then declined at significant rates through 2013, (2006–2013 (–8.5 APC; 95% CI: –9.6– –7.4)). Thereafter, the incidence rate declined from 1.2/100,000 in 2013 to 1.0/100,000 in 2017 (–5.3% APC; 95% CI: –7.9%– –2.6%). During 2015, an increase of 149 TB cases was reported, compared with 2014 (142 cases among non-US–born persons, 7 cases among US-born persons), but the case count continued to decline significantly during 2013–2017 (Figure 3b).
Figure 3a.
Incidence trends among among US-born tuberculosis patients, US National Tuberculosis Surveillance System, 1993–2017.
Figure 3b.
Trends in case counts among among US-born tuberculosis patients, US National Tuberculosis Surveillance System, 1993–2017.
Recent transmission estimates and TB confirmation
The estimated percentage of new TB cases attributed to recent transmission declined slightly during years for which these data were available (2011–2017). An average of 14.3% of TB cases were attributed to recent transmission during 2011–2013, compared with 13.7% during 2014–2017. Estimates of recent transmission among US-born persons was 26.5% for both time periods. Among non-US–born persons, an estimated 7.6% in 2011–2013 were attributed to recent transmission, compared with 8.1% during 2014–2017. Culture confirmation of TB infection is the reference standard for TB diagnosis and is necessary for genotyping analyses to estimate recent transmission. Since 2011, culture confirmation has remained constant at approximately 77% for all verified TB cases.1
Characteristics associated with recent epidemiology
Using multivariable regression, we analyzed characteristics of TB patients reported during 2014–2017, compared with those reported during 2010–2013. Non-US–born TB patients in recent years were more likely to be older (≥45 years), nonwhite, have been in the United States <1 year or ≥10 years before TB diagnosis, or have diabetes (Table 1). Non-US–born TB patients in recent years were less likely to have cavitary disease at diagnosis, or have positive or unknown HIV status. Patients with other risk factors, such as, end-stage renal disease, contact with an infectious TB patient, or diagnosis with a non-HIV immunocompromising condition, did not differ statistically significantly when reported during the earlier or later time frame.
Table 1.
Demographic and Clinical Characteristics of Non-US–Born Tuberculosis Patients by Period, US National Tuberculosis Surveillance System, 2010–2013, compared with 2014–2017.
| Characteristic | 2010–2013 n = 25856 No. (%) |
2014–2017 n = 25410 No. (%) |
Adjusted Risk Ratio (99% Confidence Interval)a | P-value |
|---|---|---|---|---|
| Age (years) | ||||
| 0–4 | 152 (0.6) | 127 (0.5) | 1.0 (0.8–1.2) | .92 |
| 5–14 | 363 (1.4) | 277 (1.1) | 0.9 (0.8–1.0) | .11 |
| 15–24 | 2878 (11.1) | 2570 (10.1) | 1.0 (1.0–1.0) | .72 |
| 25–44 | 9842 (38.1) | 8721 (34.3) | Ref. | |
| 45–64 | 7217 (27.9) | 7464 (29.4) | 1.1 (1.0–1.1) | <.0001 |
| ≥65 | 5403 (20.9) | 6245 (24.6) | 1.2 (1.1–1.2) | <.0001 |
| Race/Ethnicity | ||||
| White, non-Hispanic | 1283 (5.0) | 1092 (4.3) | Ref. | |
| Asian, non-Hispanic | 11919 (46.1) | 12266 (48.3) | 1.1 (1.1–1.2) | <.0001 |
| Black, non-Hispanic | 3488 (13.5) | 3498 (13.8) | 1.1 (1.0–1.2) | .0002 |
| Hispanic | 8783 (34.0) | 8088 (31.8) | 1.1 (1.0–1.1) | .15 |
| Other, non-Hispanicb | 383 (1.5) | 466 (1.9) | 1.2 (1.1–1.3) | <.0001 |
| Years in the United States before tuberculosis diagnosis | ||||
| <1 year | 3958 (15.3) | 4239 (16.7) | 1.1 (1.1–1.2) | <.0001 |
| 1–4 years | 4514 (17.5) | 4019 (15.8) | 1.0 (1.0–1.1) | .009 |
| 5–9 years | 3851 (14.9) | 3179 (12.5) | Ref. | |
| ≥10 years | 11194 (43.3) | 11644 (45.8) | 1.1 (1.1–1.1) | <.0001 |
| Unknown | 2339 (9.1) | 2329 (9.2) | 1.1 (1.1–1.2) | <.0001 |
| HIV status (referent = HIV status negative) | ||||
| Positive | 1201 (4.6) | 1075 (4.2) | 0.9 (0.9–1.0) | .0007 |
| Unknownc | 4824 (18.7) | 2628 (10.3) | 0.6 (0.6–0.7) | <.0001 |
| Site of Disease (referent = Extra-pulmonary disease only) | ||||
| Pulmonary disease only | 17159 (66.4) | 17022 (67.0) | 1.0 (1.0–1.1) | .01 |
| Pulmonary and extra-pulmonary disease | 2662 (10.3) | 2750 (10.8) | 1.1 (1.0–1.1) | .005 |
| Chest radiology (referent = Normal chest radiograph) | ||||
| Cavitary disease | 4743 (18.3) | 4484 (17.7) | 0.9 (0.9–1.0) | <.0001 |
| No cavitary disease | 15306 (59.2) | 15124 (59.5) | 1.0 (0.9–1.0) | .01 |
| Other Risk Factors | ||||
| Diabetesd (referent = diabetes no or unknown) | 4408 (17.1) | 5340 (21.0) | 1.1 (1.1–1.1) | <.0001 |
AIDS, acquired immunodeficiency syndrome; HIV, human immunodeficiency virus.
Adjusted risk ratio and 99% confidence intervals shown for patient characteristics left in the final multivariable model. Variables were adjusted for sex; homelessness, excess alcohol use, injecting-drug use or non-injecting drug use within the year prior to diagnosis; living in a longterm care or a correctional facility at the time of diagnosis of TB; end-stage renal disease, previous history of TB, sputum smear results, history of incomplete treatment with tumor necrosis factor-alpha antagonist drugs, contact with an MDR TB patient, being missed contact of a person with TB disease, post-organ transplantation, immunosuppression not associated with HIV/AIDS, treatment for latent tuberculosis infection, contact with an infectious TB or a multidrug-resistant TB patient, missed contact with active TB patient.
“Other” race/ethnicity includes persons of unknown or missing race (2010–2013, n = 62, 2014–2017, n = 75), more than one race selected (2010–2013, n = 120; 2014–2017, n = 164), and Native Americans/Alaskan Natives (2010–2013, n = 7, 2014–2017, n = 4), and Native Hawaiians/Pacific Islanders (2010–2013, n = 194; 2014–2017, n = 223).
HIV, Human immunodeficiency virus status unknown is a combination of test result unknown, test refused, test not done, test not offered, and test result indeterminate.
We analyzed the trends in case counts of non-US–born TB patients by the number of years since they had arrived in the United States before their TB diagnosis. Persons in the United States <1 year, 1–4 years, and ≥10 years after arrival had increasing TB case counts during during 2014–2017 (Table 2) compared to those in the United States during 2010 to 2013. Joinpoint analysis found those in the United States <1 year had no increase in case counts during 1993–2007 (0.15% APC; CI: –0.8%–1.1%), followed by a significant decline from 2007 to 2011 (–12.0 APC; CI: –21.4%– –1.5%) and then were again level (3.1% APC; CI: –1.2%– 7.5%) during 2011–2017. TB cases among those in the United States ≥10 years increased significantly throughout all years (1993–1998: 10.5% APC; CI: 8.9%– 12.1%; 1998–2006: 2.3% APC; CI: 1.6%– 3.0%; 2006–2017: 0.96% APC; CI: 0.6%– 1.3%).
Table 2.
Demographic and Clinical Characteristics of US–Born Tuberculosis Patients by Period, US National Tuberculosis Surveillance System, 2010–2013, compared with 2014–2017.
| Characteristic | 2010–2013 n = 15217 No. (%) |
2014–2017 n = 11859 No. (%) |
Adjusted Risk Ratio (95% Confidence Interval)a | P-value |
|---|---|---|---|---|
| Age (years) | ||||
| 0–4 | 1119 (7.4) | 832 (7.0) | 0.98 (0.9–1.1) | .53 |
| 5–14 | 549 (3.6) | 477 (4.0) | 1.1 (1.0–1.2) | .05 |
| 15–24 | 1334 (8.9) | 1110 (9.4) | 0.98 (0.9–1.0) | .38 |
| 25–44 | 3244 (21.3) | 2539 (21.4) | Ref. | |
| 45–64 | 5545 (36.4) | 4106 (34.6) | 1.0 (1.0–1.1) | .30 |
| ≥65 | 3426 (22.5) | 2792 (23.5) | 1.1 (1.0–1.2) | <.0001 |
| Race/Ethnicity | ||||
| White, non-Hispanic | 5088 (33.4) | 3667 (30.9) | Ref. | |
| Asian, non-Hispanic | 535 (3.5) | 560 (4.7) | 1.3 (1.2–1.4) | <.0001 |
| Black, non-Hispanic | 5905 (38.8) | 4399 (37.1) | 1.0 (1.0–1.1) | .29 |
| Hispanic | 2917 (19.2) | 2507 (21.1) | 1.1 (1.1–1.2) | <.0001 |
| American Indian/Alaskan Native, non-Hispanic | 536 (3.5) | 462 (3.9) | 1.1 (1.0–1.2) | .003 |
| Native Hawaiian/Pacific Islander, non-Hispanic | 110 (0.7) | 158 (1.3) | 1.5 (1.3–1.7) | <.0001 |
| Other, non-Hispanicb | 126 (0.8) | 106 (0.9) | 1.1 (0.9–1.3) | .21 |
| HIV status (referent = HIV status negative) | ||||
| Positive | 1271 (8.4) | 804 (6.8) | 0.8 (0.8–0.9) | <.0001 |
| Unknownc | 3039 (20.0) | 1530 (12.9) | 0.7 (0.6–0.7) | <.0001 |
| Site of disease (referent = extra-pulmonary disease) | ||||
| Pulmonary disease only | 11267 (74.0) | 8748 (73.8) | 1.0 (1.0–1.1) | .036 |
| Pulmonary and extra-pulmonary disease | 1318 (8.7) | 1121 (9.5) | 1.1 (1.0–1.2) | .005 |
| Chest radiology (referent = normal chest radiograph) | ||||
| Cavitary disease | 3561 (23.4) | 2719 (22.9) | 0.9 (0.9–1.0) | .005 |
| No cavitary disease | 8793 (57.8) | 6867 (57.9) | 1.0 (0.9–1.0) | .08 |
| Sputum smear results (referent = smear negative) | ||||
| Positive | 5585 (36.7) | 4516 (38.1) | 1.1 (1.0–1.1) | .002 |
| Unknown | 3274 (21.5) | 2573 (21.7) | 1.1 (1.0–1.2) | <.0001 |
| Other Risk Factors (referent = not having risk factor) | ||||
| Residing in a correctional institution | 743 (4.9) | 515 (4.3) | 0.8 (0.7–0.9) | <.0001 |
| Excess alcohol use | 3067(20.2) | 2089 (17.6) | 0.9 (0.8–0.9) | <.0001 |
| Noninjecting-drug use | 2158 (14.2) | 1846 (15.6) | 1.2 (1.1–1.2) | <.0001 |
AIDS, acquired immunodeficiency syndrome; HIV, human immunodeficiency virus.
Adjusted risk ratio and 99% confidence intervals shown for patient characteristics left in the final multivariable model. Variables were adjusted for sex; homelessness, injecting-drug use within the year prior to diagnosis; living in a longterm care facility at the time of diagnosis of TB; diabetes, end-stage renal disease, previous history of TB, history of incomplete treatment with tumor necrosis factor-alpha antagonist drugs, contact with an MDR TB patient, being missed contact of a person with TB disease, post-organ transplantation, immunosuppression not associated with HIV/AIDS, treatment for latent tuberculosis infection, contact with an infectious TB or a multidrug-resistant TB patient, missed contact with active TB patient.
“Other” race/ethnicity includes persons of unknown or missing race (2010–2013, n = 42, 2014–2017, n = 12) and more than one race selected (2010–2013, n = 84; 2014–2017, n = 94).
HIV, Human immunodeficiency virus status unknown is a combination of test result unknown, test refused, test not done, test not offered, and test result indeterminate.
Among US-born TB patients, relative to whites, all racial/ethnic groups except non-Hispanic blacks were significantly more likely to be reported during 2014–2017, compared with 2010–2013 (Table 2). US-born TB patients reported in 2014–2017, were more likely to be ≥65 years of age, have combined pulmonary and extrapulmonary disease, have a positive sputum smear result at diagnosis, and report noninjecting drug use during the year before diagnosis. Among US-born TB patients, HIV infection, unknown HIV status, cavitary TB disease, excess alcohol use, and living in a correctional institution were less likely to be reported during 2014–2017, compared with 2010–2013.
Discussion
The slowing decline in the TB incidence rate was widespread during 2014–2017 across age, racial/ethnic, and geographic groups. No patterns were identified for changes in case verification by culture or recent transmission to account for the slowing decline.
Through multiple analyses, we describe the recent epidemiology of TB in the United States that might have contributed to the slowing incidence rate declines. Compared with 2010–2013, both US-born and non-US–born TB patients were more likely to be nonwhite, be older, and have less cavitary disease at TB diagnosis during 2014–2017. Older age at TB diagnosis is consistent with a US population that is growing at a faster rate among those aged ≥45 years than younger age groups.12 Along with older age, nonwhite minority racial/ethnic groups were more likely to receive a TB diagnosis in recent years among both non-US–born and US-born persons. Since race/ethnicity information regarding “whites” and “other races” was first collected in 1970,13 TB rates in the United States have been higher among nonwhite racial/ethnic groups and a recent report, showed all nonwhite racial/ethnic groups were approximately 3–54 times higher than for US-born whites.14
Other findings that may contribute to the slowing incidence of TB rates in recent years are that US-born TB patients were less likely to report excess alcohol use or to reside in a correctional institution at the time of diagnosis. Both US-born and non-US–born TB patients were more likely have been tested for HIV infection and have negative results. This is encouraging news for TB programs; HIV-testing in TB case management has been a longstanding goal for reaching elimination as have targeting TB in other marginalized populations, such as those in correctional institutions and homelessness. 3,15,16 Social determinants of health in the United States have long been linked to health disparities for nonwhite racial/ethnic groups.17 Our findings also indicate that noninjecting-drug use is increasing in recent years among the US-born. Thus, in spite of the good news, work remains to reduce TB in marginalized populations. Without screening for TB risk and treatment of latent TB infection among persons with prior exposures to TB, socioeconomic determinants and an aging population are likely to remain factors for increased risk for TB in the United States for future years.
Non-US–born TB patients reported during 2014–2017 were of older age and more likely to have been in the United States ≥10 years or <1 year before their TB diagnosis and have diabetes, compared with persons reported in prior years. A 2016 report18 noted that the smallest percentage decline in case counts during 2007–2011 occurred among non-US–born persons with TB who arrived in the United States ≥6 years before their TB diagnosis, and that epidemiologic patterns varied by country of birth and immigration. Another recent report highlighted the increased proportion of cases among non-US–born persons arriving in the United States ≥10 years before their TB diagnosis.19 TB cases among non-US–born persons who arrived in the United States ≥10 years before their diagnosis have increased during the last 2 decades which is consistent with immigration trends to the United States. The number of persons entering the United States from Mexico, China, India, Vietnam, and the Philippines has increased steadily for decades. Among these countries, only immigration from Mexico has declined slightly since 2010, after a rapid increase in immigration during previous decades.20
Diabetes among persons with latent TB infection is associated with increased progression to active disease21 and a delay in diagnosis of TB.22 Rates of diabetes among Hispanics, blacks,23 Pacific Islanders, 24 and certain Asian groups25 are substantially higher than rates for whites in the United States. Diabetes and TB comorbidity was independently associated with TB cases reported during 2014–2017 among non-US–born but not US-born patients. This finding was expected, given that the percentage of diabetics among non-US–born TB patients has increased during 2010–2017, along with the increase in TB cases reported among older age groups. In contrast, among US-born persons, the percentage of diabetics and the number of cases among the older age groups has remained stable.
Conclusions
The slowing of the decline in TB rates demonstrated in this report emphasizes the concern that the aging of the US population and other factors (e.g. homelessness, immunosuppression caused by chronic medical conditions or medications, and progression to TB disease among persons infected with TB earlier in life) are likely to affect TB incidence for coming decades. To avert these trends, CDC has called for increased attention toward preventing TB through detection and treatment of latent TB infection among groups at high risk, including a call for standardized case-based surveillance of latent TB infection and expanded testing of these groups.26, 27
Figure 4.

Tuberculosis case counts among non-US–born persons by time since arrival in the United States, US National Tuberculosis Surveillance System, 1993–2017.
Acknowledgements
We gratefully acknowledge the contributions and efforts of state and local public health TB programs that report data to CDC. We thank J. Steve Kammerer, Robert Pratt, and Jorge L. Salinas, CDC, for their assistance and advice on the project and C. Kay Smith, CDC, for her editorial services.
The findings and conclusions in this article are those of the authors and do not necessarily represent the official position of the CDC.
Footnotes
Conflict of interests: non declared.
References
- 1.Centers for Disease Control and Prevention (CDC). Reported tuberculosis in the United States, 2017 Atlanta, GA: US Department of Health and Human Services, CDC; 2018. [Google Scholar]
- 2.Cantwell MF, Snider DE Jr, Cauthen GM, Onorato IM. Epidemiology of tuberculosis in the United States, 1983 through 1992. JAMA 1994; 272: 535–539. [PubMed] [Google Scholar]
- 3.Institute of Medicine (US), Committee on the Elimination of Tuberculosis in the United States. Ending neglect: the elimination of tuberculosis in the United States Washington, DC: The National Academies of Sciences; 2000. [PubMed] [Google Scholar]
- 4.Centers for Disease Control and Prevention. Essential components of a tuberculosis prevention and control program. MMWR Recommend Rep 1995; 44(No. RR-11): 1–16. [PubMed] [Google Scholar]
- 5.Castro KG, Marks SM, Chen MP, Hill AN, Becerra JE, Miramontes R, et al. Estimating tuberculosis cases and their economic costs averted in the United States over the past two decades. Int J Tuberc Lung Dis 2016; 20: 926–933. [DOI] [PMC free article] [PubMed] [Google Scholar]
- 6.Salinas JL, Mindra G, Haddad MB, Pratt R, Price SF, Langer AJ. Leveling of tuberculosis incidence—United States; 2013–2015. MMWR Morb Mortal Wkly Rep 2016; 65: 273–278. [DOI] [PubMed] [Google Scholar]
- 7.Centers for Disease Control and Prevention (CDC). Report of verified case of tuberculosis (RVCT) self-study modules Atlanta, GA: US Department of Health and Human Services, CDC; 2009. [Google Scholar]
- 8.US Census Bureau, American Community Survey. One-year public use microdata sample (PUMS), 2015 Washington, DC: US Department of Commerce, Census Bureau; 2017. [Google Scholar]
- 9.National Institutes of Medicine (NIH), National Cancer Institute (NCI). Joinpoint regression program, Version 4.3.1.0—April 2016 Bethesda, MD: NIH, NCI; 2016. [Google Scholar]
- 10.Kim HJ, Fay MP, Feuer EJ, Midthune DN. Permutation tests for joinpoint regression with applications to cancer rates. Stat Med. 2000; 19: 335–351: (correction: 2001; 20: 655). [DOI] [PubMed] [Google Scholar]
- 11.France AM, Grant J, Kammerer JS, Navin TR. A validated approach using surveillance and genotyping data to estimate tuberculosis attributable to recent transmission in the United States. Am J Epidemiol 2015; 182: 799–807. [DOI] [PMC free article] [PubMed] [Google Scholar]
- 12.Howden LM, Meyer JA. Age and sex composition: 2010 Washington, DC: US Department of Commerce, Census Bureau, 2010; 2011. https://www.census.gov/prod/cen2010/briefs/c2010br-03.pdf. [Google Scholar]
- 13.Center for Disease Control (CDC). Reported tuberculosis data 1970 Atlanta, GA: US Department of Health, Education, and Welfare, CDC; 1972. [Google Scholar]
- 14.Schmit KM, Wansula Z, Pratt R, Price SF, Langer AJ. Tuberculosis—United States, 2016. MMWR Morb Mortal Wkly Rep 2017; 66: 289–294. [DOI] [PMC free article] [PubMed] [Google Scholar]
- 15.Centers for Disease Control and Prevention (CDC). CDC’s response to ending neglect: the elimination of tuberculosis in the United States Atlanta, GA: US Department of Health and Human Services, CDC; 2002. https://www.cdc.gov/tb/about/pdf/iomresponse.pdf. [Google Scholar]
- 16.Centers for Disease Control and Prevention (CDC). A strategic plan for the elimination of tuberculosis in the United States. MMWR Morb Mortal Wkly Rep 1989; 38(Suppl S3): 1–25. https://www.cdc.gov/MMWR/preview/MMWRhtml/00001375.htm. [PubMed] [Google Scholar]
- 17.Cantwell MF, McKenna MT, McCray E, Onorato IM. Tuberculosis and race/ethnicity in the United States. impact of socioeconomic status. Am J Respir Crit Care Med 1997; 159: 1016–1020. [DOI] [PubMed] [Google Scholar]
- 18.Baker BJ, Winston CA, Liu Y, France AM, Cain KP. Abrupt decline in tuberculosis among foreign-born persons in the United States. Plos One 2016; 11: e0147353. doi: 10.1371/journal.pone.0147353. [DOI] [PMC free article] [PubMed] [Google Scholar]
- 19.Tsang CA, Langer AJ, Navin TR, Armstrong LR. Tuberculosis among foreign-born persons diagnosed ≥10 years after arrival in the United States, 2010–2015. MMWR Morb Mortal Wkly Rep 2017; 66: 295–298. [DOI] [PMC free article] [PubMed] [Google Scholar]
- 20.Migration Policy Institute. Migration data hub Washington, DC: Migration Policy Institute; 2017. http://migrationpolicy.org/programs/data-hub. [Google Scholar]
- 21.Hensel RL, Kempker RR, Tapia J, Oladele A, Blumberg HM, Magee MJ. Increased risk of latent tuberculosis infection among persons with pre-diabetes and diabetes mellitus. Int J Tuberc Lung Dis 2016; 20: 71–78. [DOI] [PMC free article] [PubMed] [Google Scholar]
- 22.Chen H-G, Liu M, Jiang S-W, Gu FH, Huang SP, Gao TJ, et al. Impact of diabetes on diagnostic delay for pulmonary tuberculosis in Beijing. Int J Tuberc Lung Dis 2014; 18: 267–271. [DOI] [PubMed] [Google Scholar]
- 23.Centers for Disease Control and Prevention (CDC). National Diabetes Statistics Report, 2017 Atlanta, GA: US Department of Health and Human Services, CDC; 2017. https://www.cdc.gov/diabetes/pdfs/data/statistics/national-diabetes-statistics-report.pdf [Google Scholar]
- 24.Karter AJ, Schillinger D, Adams AS, Moffet HH, Liu J, Adler NE, et al. Elevated rates of diabetes in Pacific Islanders and Asian subgroups. The Diabetes Study of Northern California (DISTANCE). Diabetes Care 2013; 36: 574–579. [DOI] [PMC free article] [PubMed] [Google Scholar]
- 25.Oza-Frank R, Ali MK, Vaccarino V, Venkat Narayan KM. Asian Americans: diabetes prevalence across U.S. and World Health Organization weight classifications. Diabetes Care 2009; 32: 1644–1646. [DOI] [PMC free article] [PubMed] [Google Scholar]
- 26.Lobue PA, Mermin JH. Latent tuberculosis infection: the final frountier of tuberculosis elimination in the USA. Lancet 2017; doi: 10.1016/S1473-3099(17)30248-7. [DOI] [PMC free article] [PubMed] [Google Scholar]
- 27.US Preventive Services Task Force. Screening for latent tuberculosis infection in adults: US Preventive Services Task Force recommendation statement. JAMA 2016; 316: 962–969. doi: 10.1001/jama.2016.11046. [DOI] [PubMed] [Google Scholar]