Abstract
To facilitate computational toxicology, we developed an approach for generating high-resolution lung-anatomy and particle-deposition mouse models. Major processing steps of our method include mouse preparation, serial block-face cryomicrotome imaging, and highly automated image analysis for generating three-dimensional (3D) mesh-based models and volume-based models of lung anatomy (airways, lobes, sublobes, and near-acini structures) that are linked to local particle-deposition measurements. Analysis resulted in 34 mouse models covering 4 different mouse strains (B6C3F1: 8, BALB/C: 11, C57Bl/6: 8, and CD-1: 7) as well as both sexes (16 male and 18 female) and different particle sizes [2 μm (n = 15), 1 μm (n = 16), and 0.5 μm (n = 3)]. On average, resulting mouse airway models had 1,616.9 ± 298.1 segments, a centerline length of 597.6 ± 59.8 mm, and 1,968.9 ± 296.3 outlet regions. In addition to 3D geometric lung models, matching detailed relative particle-deposition measurements are provided. All data sets are available online in the lapdMouse archive for download. The presented approach enables linking relative particle deposition to anatomical structures like airways. This will in turn improve the understanding of site-specific airflows and how they affect drug, environmental, or biological aerosol deposition.
NEW & NOTEWORTHY Computer simulations of particle deposition in mouse lungs play an important role in computational toxicology. Until now, a limiting factor was the lack of high-resolution mouse lung models and measured local particle-deposition information, which are required for developing accurate modeling approaches (e.g., computational fluid dynamics). With the developed imaging and analysis approach, we address this issue and provide all of the raw and processed data in a publicly accessible repository.
Keywords: aerosol deposition, airway geometries, mouse strains
INTRODUCTION
The mouse is the most commonly used animal model for toxicology risk assessments, such as tobacco smoke exposure and asthma research. Because it is not possible to study every substance exposure or varying exposure conditions, mathematical models and computer simulations are employed to fill the gap or to extend the range of experimental data. However, computational toxicology is limited in its application to mouse inhalation exposure studies because of the lack of high-resolution accurate airway geometries, which are needed for modeling, and site-specific particle-deposition data.
In this paper, we present an approach that combines the unique imaging capabilities of the serial block-face imaging cryomicrotome with highly automated segmentation algorithms to provide high-resolution three-dimensional (3D) mouse lung (e.g., airway) geometries along with site-specific relative (normalized) particle deposition in the same animal. Our objective is to facilitate the computational biology of inhaled particles and gases. Because of the highly automated airway-segmentation methods utilized, airway geometries are obtained, down to the terminal bronchioles, for both sexes of the four most commonly used mouse strains. The high-resolution data sets are shared through an open-access repository and can be used by other investigators to accelerate investigation of health and diseases related to the respiratory system. The ultimate goal is to broaden our understanding of site-specific airflows and how they affect drug, environmental, or biological aerosol deposition in health and diseases related to occupational exposures, air pollution, and tobacco smoke.
Related Work
Other investigators have provided airway geometries of mice using various methods, including airway casting with digestion of lung tissue (11), microcomputerized tomography (7, 28), and tissue optical clearing (25), to name only a few. The abilities of these methods to identify terminal airway branches have been limited. The ability to measure site-specific deposition of aerosol particles has been even more encumbered by the relatively low spatial resolution of imaging methods (13), requiring investigators to use theoretical mathematical models to estimate site-specific aerosol deposition (16). In addition, time-consuming and largely manual analysis precludes the ability to study multiple mice, limiting our understanding of heterogeneity across animals. We have previously demonstrated the ability to image and analyze the airways in rats while estimating regional ventilation with fluorescent aerosol particles (3, 8). In this work, we describe an approach that enables us to process mice. Specifically, to generate airway models with an increased level of detail, we utilize an improved high-resolution imaging setup combined with a new airway segmentation algorithm. Compared with our prior work (3), this approach enables detection and segmentation of smaller airways and avoids inaccuracies at airway bifurcations.
METHODS
In the following sections, we describe all processing steps required to generate combined models of lung anatomy and particle deposition. Animal Models describes the utilized animal models, and Imaging provides details regarding the utilized serial block-face cryomicrotome imaging of lung anatomy and relative particle deposition. Subsequently, image preprocessing (Image Preprocessing), airway segmentation (Airway Segmentation), and lung-region segmentation (Segmentation of Lung Regions) approaches are described. Finally, our methods for relative particle deposition measurement (Particle-Deposition Measurement) as well as quality control (Quality Control and Performance Evaluation) are presented.
Animal Models
All procedures were approved by the Animal Care and Use Committee at the University of Washington and conformed to the Guide for the Care and Use of Laboratory Animals published by the US National Institutes of Health (17). Mice of four different strains were obtained: B6C3F1 (Charles River), BALB/C (Jackson Laboratory), C57BL/6 (Jackson Laboratory), and CD-1 (Charles River). Mice of both sexes were ordered with a targeted age and weight to minimize variability.
Mice were placed in individual plastic holders that secured their noses against a silicone seal to expose them to an airstream containing aerosolized particles (Fig. 1). The animals were not sedated but were restrained in place by a cervical holder that allowed free breathing. Respiratory rate, tidal volumes, and inspiratory/expiratory ratios were measured and recorded in all animals at pre-exposure, mid-exposure, and post-exposure using plethysmography. Four mice were simultaneously exposed to the aerosol, and parameters like respiratory rate, tidal volume, etc., were recorded. Aerosols of red fluorescent microspheres (Thermo Fischer Scientific, Waltham, MA) that were uniformly spherical with densities of 1.055 g/mL and of various diameters were generated using a Small Volume Median Diameter Aeroneb Lab Nebulizer and Lab Controller, which created a wet aerosol of droplets with volumetric mean diameters of 2.5–4.0 μm. Although each droplet may have contained multiple fluorescent microspheres, after passing through the drying column, the aerosol is dry and composed of singlet particles. A volume of stock fluorescent microspheres was diluted with saline and nebulized for 10 s twice each minute (duty cycle = 33%) during each of 2 aerosol exposure times. The numbers of microspheres per milliliter in the stock solution were 2.1 × 10¹¹, 5.5 × 10¹⁰, and 5.9 × 10⁹ for the 0.5 μm, 1.0 μm, and 2.0 μm diameter microspheres, respectively. The dilution ratios used for nebulization were 1:4, 1:4, and 1:3 for the 0.5 μm, 1.0 μm, and 2.0 μm diameter microspheres, respectively. The aerosol settled within a large chamber that had a bias flow rate that was 1.5 times the combined minute ventilation of the mice. The aerosol leaving the chamber passed through a drying column and then into a manifold system that directed the flow to the nose of each animal (Fig. 1). The manifold had ports for 4 mice and 1 additional sampling port connected through a filter paper to the inlet side of a Harvard minivent set at 300 μL volume and a rate of 100 strokes/min. This filter was used to document the amount of aerosol delivered to the mice across all of the experiments. Prior to animal experiments, the stream of aerosols was sampled by collection on filter paper just before the manifold system and inspected with a fluorescent microscope. All polystyrene microspheres were observed to be singlets. Groups of animals received one of three monodispersed aerosols with diameters of 0.5 μm, 1.0 μm, or 2.0 μm. As documented by the manufacturer’s certificate of analysis for each lot, the means and standard deviations of the particle diameters were 0.56 ± 0.020 μm, 1.1 ± 0.035 μm, and 1.9 ± 0.085 μm. Each mouse experienced 2 consecutive exposure periods, with the total time (10–15 min) estimated to provide adequate fluorescent signals depending on the size of the particle and the dilution from stock. On average, the estimated number of particles per milliliter of air to which the animals were exposed were 2.4 × 10⁶, 5.1 × 10⁵ and 1.8 × 10⁴ for the 0.5 μm, 1.0 μm, and 2.0 μm microspheres, respectively.
Fig. 1.
Overview of aerosol exposure setup.
At the end of the exposure time, the mice were given an anesthetic overdose. Their lungs and heart were excised en bloc, filled to total lung capacity with optimal cutting temperature media (OCT; Sakura Finetek, Incorporated, Torrance, CA), placed in a silicone mold to maintain an anatomical shape and orientation, and frozen in a −80°C freezer. The frozen lungs and heart were then embedded in mixture of 99.25% OCT and 0.75% carbon black particles for imaging. White polystyrene rods 1.0 mm in diameter were placed perpendicular to the face of the tissue block at each of the four corners to serve as fiducial markers and facilitate registration of serial images.
Imaging
Serial block-face imaging cryomicrotome.
The serial block-face imaging cryomicrotome (Barlow Scientific, Incorporated, Olympia, WA) determines the spatial distribution of fluorescence at the microscopic level in frozen tissue blocks. Details of the instrument configuration have been previously reported (3, 6), but components of the instrument have been upgraded. The instrument now consists of a Nikon D7100 digital SLR camera (Nikon Corporation, Tokyo, Japan) with a resolution of 6,000 × 4,000 pixels, an AF Micro-Nikkor 200 mm f/4D IF-ED lens (Nikon Corporation), excitation and emission filter-changer wheels, a cryostatic microtome, and a xenon arc lamp (PE300BF Cermax, Excelitas Technologies, Fremont, CA). A computer (Dell Computer Corporation, Round Rock, TX) controls the microtome motors, filter wheels, image capture and display, and image storage through a program written in LabVIEW (National Instruments Incorporated, Austin, TX).
Image acquisition.
The cryomicrotome sectioned the frozen lungs with a slice thickness of 9.52 μm. Digital images of the remaining tissue surface were acquired with appropriate excitation and emission filters to isolate each fluorescent color. Airways and lung parenchyma took advantage of the tissue autofluorescence and were best imaged with an excitation filter with a maximum at 485 nm and a full-width half maximum of 20 nm [485 (20)] and an emission filter of 535 (30). The red aerosol particles were best imaged with an excitation and emission pair of 560 (20) and 635 (30), respectively. There was no signal spillover between the airway and particle windows.
The imaging system may take multiple images of the aerosol channel to accommodate large differences in the light intensity because of local deposition. If an aerosol image saturates, then the exposure is repeatedly reduced by ~75% until the saturation is resolved.
Prior to imaging the sample, we acquire two auxiliary sets of images. The first set comprises bright-field images for each of the filter pairs. Any shaping of the excitation and emission light by the filters will be captured in these images. The second set, the calibration layer, is multiple images of a highly textured surface, using white incident light and normal emission filters. These images are used to correct for shifts between channels as well as chromatic aberration introduced by the camera lens.
The spatial resolution of the system depends on the magnification used to image the tissue and was between 4.56 μm and 4.73 μm in the x and y directions for this study (mean: 4.66 ± 0.05 μm). The 14-bit color images are saved in Nikon RAW format.
Measuring relative aerosol deposition.
To establish and verify that measured intensities (i.e., image gray values) of the aerosol-signal images were indeed proportional to the microsphere/particle concentration in a given volume, the following experiment was conducted. First, a stock solution of OCT with red aerosol was prepared. The number of aerosol particles in the stock solution was estimated by sampling the stock solution and further diluting the concentration of particles with OCT until they could be visually counted using a hemocytometer. Second, three mouse lungs were prepared; each mouse lung was filled with clear OCT doped with different dilutions of the stock OCT and aerosol particles. Third, the lungs were imaged and preprocessed (Image Preprocessing). Fourth, the three image data sets were analyzed, and a regression analysis was performed. For this purpose, lung masks were used to calculate the average image intensity (gray value) in the mouse lungs. Results comparing known concentrations and measured average intensities are depicted in Fig. 2, confirming that aerosol image intensities are linearly proportional to the concentration of microspheres. Note that intensity range (y-axis) covered by Fig. 2 is representative for the typical intensity range for lung tissue in aerosol images (mean ± SD: 429.74 ± 240.34) before any normalization is applied. Consequently, we denote measured intensities as aerosol deposition values. In this context, note that it is not feasible with our imaging approach to measure absolute particle concentration because of factors like drift in light source intensity, etc. Therefore, we normalize all particle-deposition measurements as described in Size reduction and normalization, resulting in relative particle measurements with a unit of one.
Fig. 2.
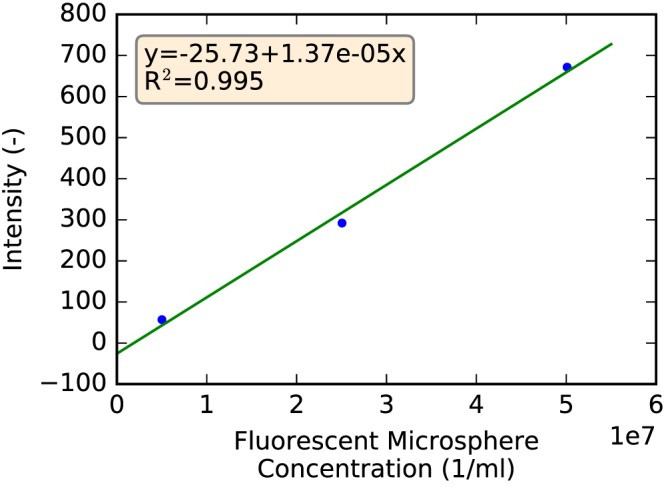
Correlation between known concentration of fluorescent miscrospheres in mouse lungs and average intensity measured in the corresponding serial block-face imaging cryomicrotome volumes.
Image Preprocessing
Before image data were analyzed, the acquired raw imaging data were preprocessed in several steps as described below, resulting in multispectral image volumes.
Slice-based processing.
Starting with the raw cryomicrotome data, the following slice-based preprocessing steps were applied. First, the red (aerosol signal) and green (autofluorescence signal) color channels were extracted, and the Bayer filter mosaic pattern was removed. Note that for the green color channel, only one of the two green pixels of the Bayer mosaic was used. This step reduces the original image size of aerosol and autofluorescence images by a factor of two in each dimension. Second, to cover the high dynamic range of the data, images of the same slice were automatically obtained with different exposure/gain settings. These were normalized and combined into one floating point precision image per slice with standardized exposure/gain values. Third, light-field inhomogeneities in the imaging plane were removed using the bright-field images (Image acquisition).
Volume-based processing.
After processing of individual image slices, autofluorescence and aerosol image stacks were assembled into three-dimensional volumes. Subsequently, the following artifact-removal steps were performed: First, shards (i.e., parts from the prior tissue slice stuck on the sample’s block-face during imaging) were manually identified and removed by using interpolation between neighboring shard-free image slices (Fig. 3). Second, a misalignment between neighboring images can occur because of mechanical issues (e.g., tolerances and wear) of the imaging system. They were removed (Fig. 4) by aligning the fiducial markers embedded in the sample (bright disks in Fig. 3; Animal Models) by means of pixel-based shifts in the image plane. Third, light fluctuations between neighboring slices were removed (Fig. 4) by adjusting the slices’ tissue intensities to those of neighboring slices.
Fig. 3.
Shard removal. A: image slice with shards (dark areas marked with arrows). B: result after removal. The four white dots in the corners of each image are fiducial markers that run through the entire tissue block to aid in serial image alignment (Volume-based processing).
Fig. 4.
Correction of misalignments and light fluctuations. A: before correction. B: after correction of miss-alignments. C: result after correction for light fluctuations.
Deconvolution.
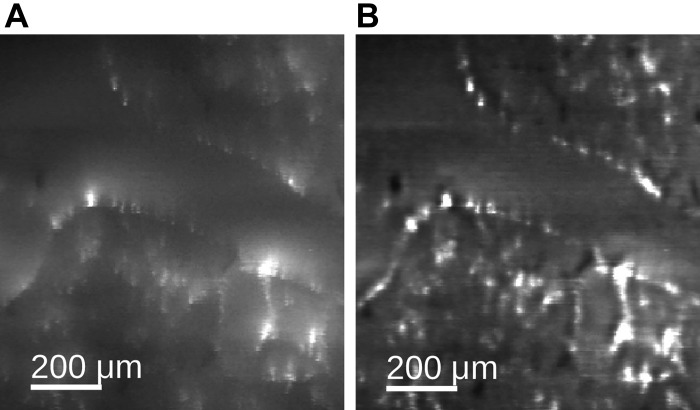
The image data acquired with the imaging cyromictrotome show a slight directional blur, which is caused by tissue and filling-material properties (Fig. 5). This blur can be removed by using an image restoration (deconvolution) approach. As with all image restoration approaches, the quality of the restored image depends on the successful estimation of several parameters (12, 24, 27).
Fig. 5.
Example of aerosol deposition volume deconvolution. Data set before (A) and after (B) deconvolution.
Aerosol image volume deconvolution.
For the aerosol image volume, which is used to measure relative aerosol-particle deposition, we used Richardson–Lucy (RL) deconvolution (15, 22) (Fig. 5) because this method was found to produce good results for removal of subsurface fluorescence in cryoimaging (12).
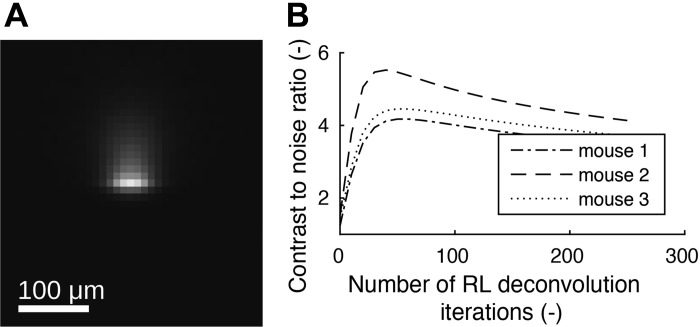
We utilized different sizes of fluorescent microspheres (0.5 μm, 1.0 μm, and 2.0 μm), and therefore corresponding point spread function (PSF) and number of RL deconvolution iterations had to be determined individually. For each microsphere size, measurements were performed using two mouse lung data sets. For this purpose, lungs were filled with a mixture of clear OCT doped with a low number of fluorescent microspheres, such that mostly individual microspheres and their directional blur were visible with low overlap in the image volume. After imaging, microspheres without overlapping blurs inside the lung tissue were identified manually, and a subvolume around each microsphere was extracted and stored. Each of these subvolumes were subsequently aligned, normalized, and averaged, resulting in a PSF volume per data set. Each of the two PSF volumes were mirrored along x- and y-axes and combined by averaging to produce an axial-symmetric PSF volume (Fig. 6A).
Fig. 6.
Richardson–Lucy (RL) deconvolution point spread function (A) and contrast-to-noise ratio plots (B) for 1 μm particle-deposition image data.
RL deconvolution is an iterative process that will start to produce more noise if too many iterations are performed, leading to a lower image quality of the restored image. Therefore, an optimal number of iterations was determined by maximizing the contrast-to-noise ratio (CNR) on three mouse lung data sets per microsphere size. For our application, we define the CNR as follows: the average airway-wall deposition was subtracted by the average deposition in the airway lumen and subsequently divided by the standard deviation of the signal in the airway lumen. Using the airway mask (Airway Segmentation), CNR measures were obtained for all airway segments. The CNR measurements were combined for each mouse lung data set by averaging. For the selected three mouse data sets, this procedure was performed after every 10th RL iteration. The 3 resulting CNR curves for 1-μm microspheres are depicted in Fig. 6B, showing a maximum of around 50 iterations for all 3 curves. Thus, the number of deconvolution iterations was set to 50 for all data sets with 1-μm microspheres. Similarly, the optimal number of deconvolution iterations was determined to be 110 and 140 for 0.5-μm and 2-μm microspheres, respectively. Figure 5 depicts the effect of deconvolution on a real data set.
Autofluorescent image volume deconvolution.
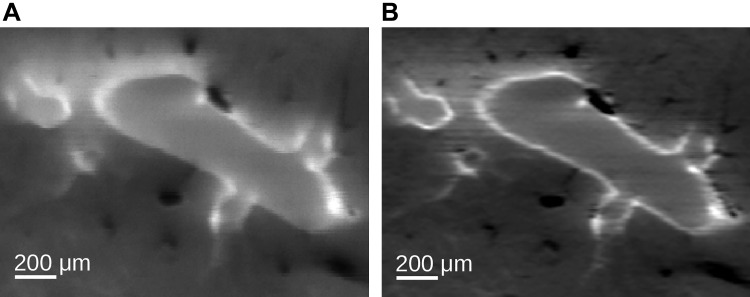
Although the aerosol image signal is produced by utilizing (discrete) fluorescent microspheres, several different tissues will contribute to the signals found in the autofluorescent image volume. Consequently, it is hard to experimentally derive an estimate of a suitable PSF for tissue. Therefore, we applied a different deconvolution approach for the autofluorescent image volume. The next-image deconvolution method (27) with estimated parameters (σ = 5 μm, k = 0.9) was utilized to enhance the visibility of airway-wall structures for subsequent airway segmentation (Airway Segmentation). Figure 7 depicts the effect of deconvolution on a real data set.
Fig. 7.
Example of autofluorescent image volume deconvolution. Data set before (A) and after (B) deconvolution.
Chromatic aberration correction.
To correctly measure particle deposition on anatomical structures like airways, the chromatic aberration between red and green spectral image volumes needs to be corrected (Fig. 8). For this purpose, a B-spline registration (23) between the calibration layer’s textured images (Imaging) was performed. The resulting displacement field was then utilized to align the aerosol signal with the autofluorescent structures.
Fig. 8.
Example of chromatic aberration correction between aerosol-deposition channel (red) and airway-autofluorescent channel (green). Overlay of both spectral image channels before (A) and after (B) correction.
Size reduction and normalization.
The preprocessed volumetric images were cropped to contain only the lung and trachea. Furthermore, data sets were reoriented so that all mouse data sets had the same orientation. To calculate relative aerosol deposition, aerosol-deposition volumes were normalized as described below. First, segmentation masks of lobes and airways (described below) were combined into one mask and dilated by 0.2 mm (fringe) to define a volume of interest as depicted in Fig. 9. Using a fringe enables calculating weighted relative particle-deposition measurements at object boundaries (e.g., airway) without introducing a measurement error. Also, note that this and subsequent renderings of complete airway/lung anatomy are displayed with the ventral surface facing the reader (right lobe on the left side). Second, all aerosol-deposition voxel values inside the mask were normalized by dividing their values by the average value inside the mask. Furthermore, all aerosol deposition voxels outside of this mask were set to zero. Consequently, a voxel value <1 indicates below average deposition and a value >1 indicates above average deposition.
Fig. 9.

Example of a mask utilized for aerosol deposition normalization (white outline) (A), which consists of the lobes and airways plus a 0.2 mm wide region around it (shaded mesh) (B).
Airway Segmentation
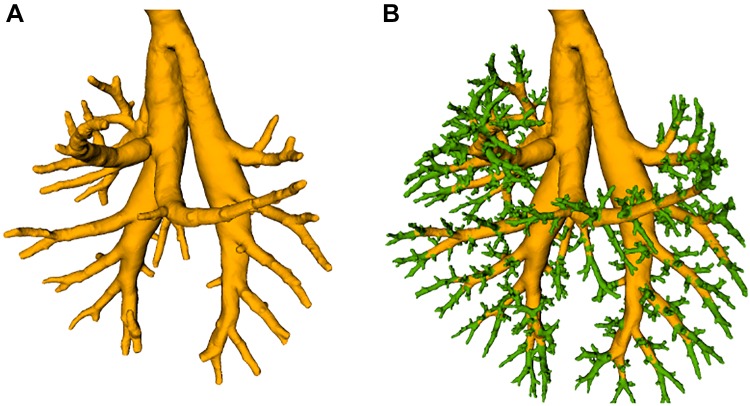
In the following, we describe how the airways’ inner walls were segmented in autofluorescent image volumes to produce a mesh (Inner airway-wall surface): outlet regions of the airway mesh where small airways transition into alveolar ducts (Fig. 12A) were identified (Outlet regions) and centerline and radius-based descriptions for all airway segments were generated (Airway skeleton and segments). For all mesh-based operations, the resolution was adapted according to the size of modeled structures to keep mesh complexity low while providing sufficient details for small airways (Fig. 10).
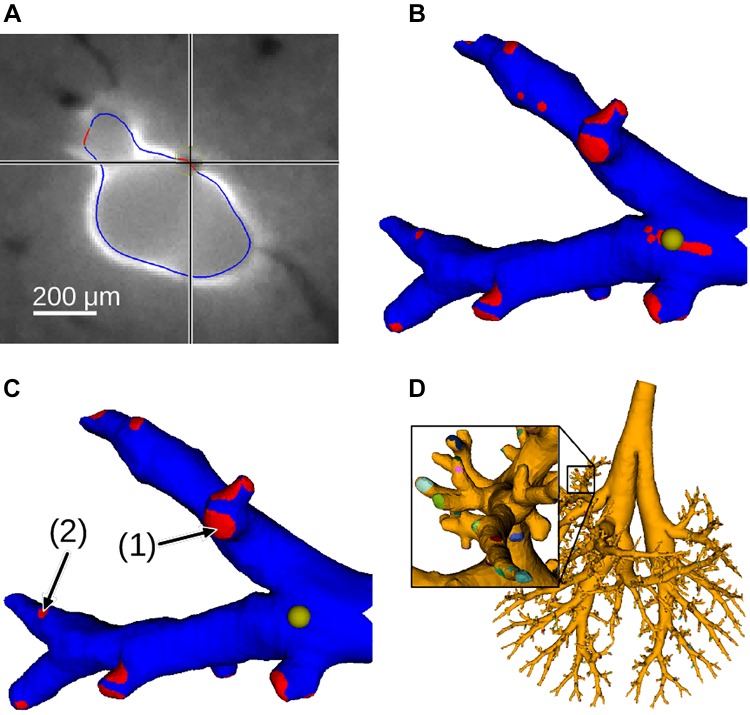
Fig. 12.
Example of outlet regions. A: segmented inner-airway wall with automatically identified outlet regions shown in red (one correct and one wrong) in full-resolution axial slice. B: subtree with automatically detected outlet regions. The yellow sphere indicates the location that matches the crosshair’s location in A. C: subtree after correction of outlet regions. Note the different sizes of outlets (1) and (2) (arrows). D: full tree with labeled outlets.
Fig. 10.

Example showing adaptive mesh resolution for smaller airways as well as around outlet regions (airway wall is shown in yellow; outlet regions are shown in blue).
Inner airway-wall surface.
The inner airway wall was segmented in 2 steps to deal with the large size (~15 GB) of the input image volume (Fig. 11). First, larger airways were segmented in the subsampled data set, resulting in an initial mesh (Fig. 11A). Second, smaller airway subtrees were processed independently in full-resolution subvolumes. In both stages, the following processing steps were performed: airways were identified (identification of airways) and surface meshes were built around them, which were subsequently adjusted to the image data (inner airway-wall mesh generation). Merging all subtrees’ meshes into the initial mesh structure resulted in the final airway-surface mesh (Fig. 11B).
Fig. 11.
Airway segmentation. A: initial airway surface mesh for only larger airways. B: final airway surface mesh after adding smaller airways (green).
identification of airways.
In the autofluorescent image data, airway walls are discernable as bright sheet-like structures (Fig. 12A). To enhance these structures and suppress background inhomogeneity, a sheetness filter was applied. To identify structures surrounded by a bright wall, a slice-based hole-filling method was applied. The result was subtracted from the initial sheetness-filter output. This slice-based operation was applied to all axial, sagittal, and coronal image slices, and results were merged into one response volume using the maximum operator. To generate a rough segmentation of the airway lumen, a threshold and, subsequently, a morphological opening operation were applied to the volume. Then, a skeleton-based representation of the airway tree was obtained that facilitated manual removal of unrelated structures.
inner airway-wall mesh generation.
After identification and representation of airways by centerline and radius estimates, surface meshes were constructed around them and were then adapted to the inner-airway wall using an active contour approach (Fig. 12A). The active contour was driven by two forces: an external force, pulling the surface toward the highest gradient in the normal direction of the surface, and an internal force, keeping the surface smooth. The smoothness constraint also keeps the surface from propagating into alveolar ducts (i.e., no visible airway wall). For larger airways, the length of mesh edges was kept between 50 μm and 100 μm, and for smaller airways, the length was kept between 15 μm and 25 μm (Fig. 10). Thus, longer edges were subdivided, and shorter edges collapsed.
Outlet regions.
Regions of the airway mesh in which small airways transition into alveolar ducts can be identified by an algorithm because they form holes in the airway wall (Fig. 12A). Outlets were identified after increasing the mesh resolution (i.e., edge length <10 μm). For each mesh vertex, the algorithm searched for the maximum sheetness-filter response in the perpendicular direction of the surface within a 20-μm range. If the response was below a given threshold, the vertex was labeled as not having an adjacent airway wall. To remove small artifact regions and generate smoother outlet contours, a morphological closing was performed on the airway wall mesh (range: 20 μm). Although this approach identifies outlet regions, it also includes other regions that do not have a visible airway wall (e.g., areas with adjacent blood vessels marked by a cross in Fig. 12A). Thus, a visual inspection of all main trees and subtrees was performed, and surface patches were corrected if needed (Fig. 12, A and B), as described in Quality Control and Performance Evaluation. Subsequently, edges <25 μm were collapsed unless they were at a transition between regions (Fig. 10). Furthermore, individual outlet regions were assigned unique labels (Fig. 12D).
Airway skeleton and segments.
A skeleton-based representation of the airway segmentation (Fig. 13A) was obtained and partitioned into airway segments (Fig. 13B). For this purpose, the airway surface segmentation (Inner airway-wall surface) was voxelized, and a skeletonization was performed (21). The skeleton was split between branch points into segment centerlines, and each centerline point was assigned a radius estimate based on its distance to the closest surface point in the voxelized segmentation. From the skeleton, terminal segments that were shorter than 0.5 times the maximum radius of the segment were pruned. To obtain a label-map-based representation of the airway segments, each voxel within the airway mask was assigned the label of the closest skeleton segment (defined by its centerline points and radius estimates). Similarly, each of the mesh’s vertices was assigned a segment label. Furthermore, as an alternative representation that is frequently used in the literature, we approximated each airway segment by a cylindrically shaped tube, and for each segment, its length, average radius, orientation, and parent segment were stored in a table.
Fig. 13.
Example of generated airway tree structures. A: skeleton. B: labeled segments.
Segmentation of Lung Regions
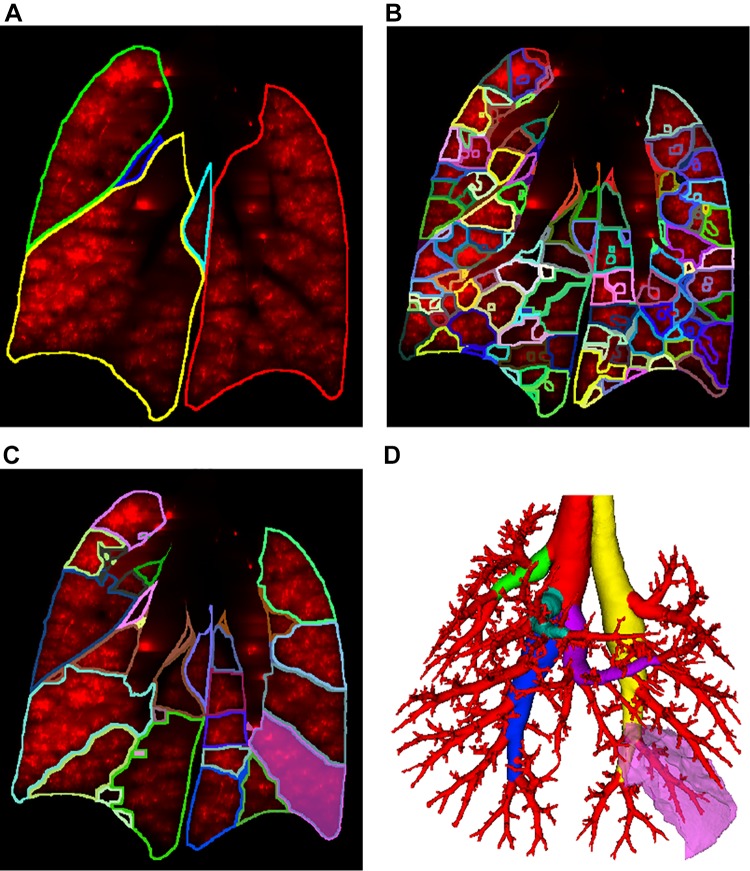
The lung tissue was identified and partitioned into lobes, sublobes, and near-acini structures (Fig. 14) using a previously developed approach (8). To define sublobar regions for each lobe (Fig. 14C), we identified the main branch for each lobe by following the thickest branch until a transition from a monopodal branching pattern to a bipodal branching pattern occurred. For each lobe, this was typically the nth bifurcation coming off in direction d (n and d for each lobe are provided in Table 1). An example is given in Fig. 14D.
Fig. 14.
Lung regions overlaid on coronal slice of aerosol image channel. A: lobes. B: near-acini structures. C: sublobes. D: relation between sublobe (bright pink) and airway subtree surrounding it. Main airway branches for each lobe are shown in colors other than red.
Table 1.
Information for definition of the main branches for each lobe
| Lobe | Count (n) | Direction (d) |
|---|---|---|
| Left | 5th | Left lateral |
| Cranial | 2nd | Anterior |
| Middle | 4th | Right inferior |
| Caudal | 4th | Right interior |
| Accessory | 5th | Left inferior |
Particle-Deposition Measurement
After segmentation of anatomical structures, the corresponding relative particle deposition was measured by utilizing the normalized aerosol-deposition volume (Size reduction and normalization).
Airway wall-based deposition measurements.
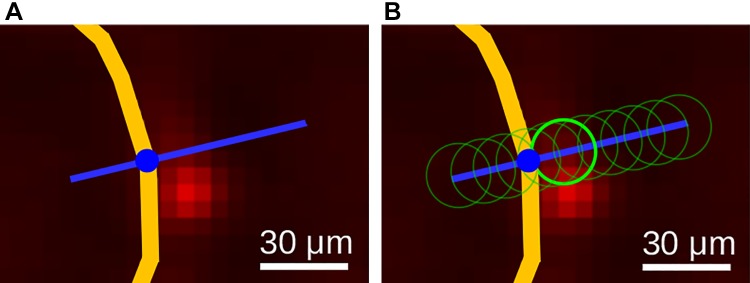
We utilize a sampling-based approach to link the airway mesh vertices to the information provided by the relative particle-measurement volume. For each of the airway-surface mesh’s vertices (Airway Segmentation), aerosol deposition near the airway wall (Fig. 15) is measured. Because particle deposition might appear slightly misaligned relative to the airway wall (Fig. 15, A and B), we obtained a measurement for each vertex by searching for the region with the highest deposition along the vertex normal vector within a distance of −25 (inside) to 50 μm (Fig. 16A). The vertex normal vector was determined by averaging all adjacent triangle normal vectors. To avoid obtaining noisy measurements, locally weighted (Gaussian kernel with σ = 10 μm) relative particle-deposition values were utilized, as illustrated by the circles in Fig. 16B. Resulting measurements for each vertex represent a relative particle-deposition concentration and were stored combined with the mesh. Furthermore, for each airway mesh segment (Fig. 13B), summary measurement statistics were calculated. Each segment consists of a set of vertices in which each vertex has an aerosol deposition and surface area (Fig. 17) value. Based on these, the segment’s area-weighed mean, standard deviation, and median aerosol deposition were calculated and are reported along with the segment’s surface area, center of gravity, and minimum and maximum aerosol deposition measurements. Results for all airway segments were stored in a table.
Fig. 15.
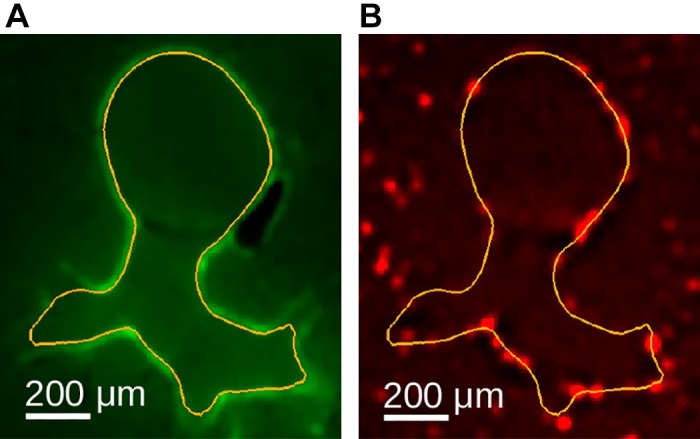
Example of airway wall particle deposition. A: airway wall outline in autofluorescent image after deconvolution. B: corresponding aerosol-deposition image after deconvolution with airway wall outline. The aerosol fluorescence outside of this airway wall outline in B belongs to other airways and alveoli not outlined.
Fig. 16.
Airway wall (yellow) deposition measurement for a mesh vertex. A: given the vertex and its surface normal direction (blue line), a search profile is defined. B: along the search profile, the Gaussian-weighted region with the highest deposition is identified (bright green circle).
Fig. 17.
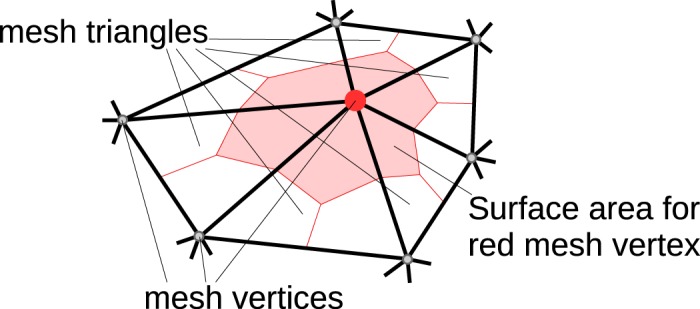
Example of mesh vertex (red circle) shared by 6 triangles with its corresponding surface area depicted in light red. Each shared mesh triangle is divided into three subparts using the triangle center of gravity and edge midpoints.
Lung region-based measurements.
For each lobe, sublobe, and near-acini structure, we measured the region’s mean, standard deviation, median, and minimum and maximum relative aerosol deposition as well as its volume and center of gravity. Results were stored in the form of a table.
Quality Control and Performance Evaluation
Our goal is to produce high-quality models. Therefore, each automated processing step was followed by a manual inspection of the result, and, if needed, a correction of local errors was performed to deal with variation in image quality, artifacts, etc.
For quality assurance of the automated airway-tree segmentation, a human observer visually inspected the meshes of the airway main tree as well as all subtrees for each data set for errors by utilizing a custom visualization software, which is critical for efficiently inspecting the large mouse data sets. The software enabled a 3D rendering of the airway mesh as well as displaying two-dimensional cross sections laid over the autofluorescent image data similar to the depiction in Fig. 12, A–C. Furthermore, the software allowed the expert to correct local errors in the airway-wall segmentation by deforming the airway mesh.
The same software was used for inspection of outlet areas on the airway mesh. If needed, the expert manually deleted falsely identified outlets (e.g., caused by an adjacent vessel) or added an outlet label to airway mesh vertices in the case of a missing outlet.
To assess the quality of the segmentation and outlet detection process, the above described interactions were captured in a log file and subsequently analyzed to report the number of corrected airway regions as well as false positive (FP) and false negative (FN) outlets on the airway mesh surface.
RESULTS
Lung Anatomy and Particle Models
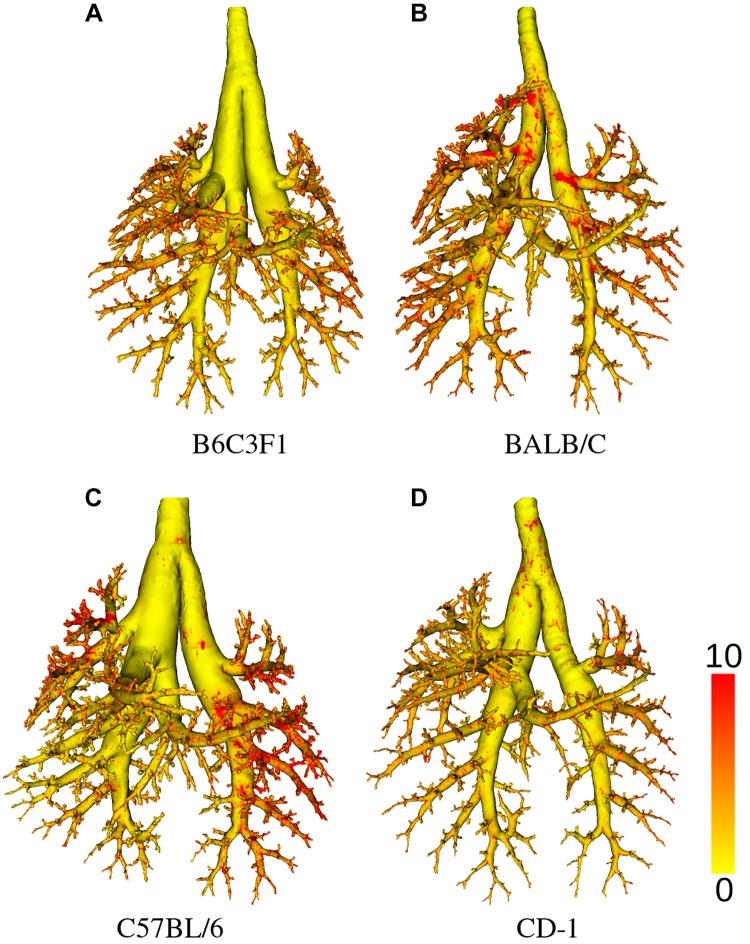
By applying the methods described in methods, a total of 62 mice were studied, out of which 34 were successfully processed and passed all quality-control steps; mice were excluded if a complete airway geometry could not be generated because of either lung preparation problems or instrument malfunction. Table 2 gives an overview of how many mice per aerosol size, strain, and sex are included in the final data set. For each mouse strain, examples of airway segmentations with relative deposition measurements are shown in Fig. 18. Summary statistics per mouse strain are provided in Table 3. Boxplots for lung volume, number of airway segments, and near-acini volume measurements for each mouse strain are provided in Fig. 19. As an example, an outlet region area histogram for BALB/C mice is given in Fig. 20.
Table 2.
Summary of mice in data set by aerosol size, strain, and sex
| B6C3F1 |
BALB/C |
C57Bl/6 |
CD-1 |
|||||
|---|---|---|---|---|---|---|---|---|
| Aerosol size | F | M | F | M | F | M | F | M |
| 0.5 μm | 2 | 1 | ||||||
| 1 μm | 2 | 2 | 2 | 2 | 2 | 2 | 2 | 2 |
| 2 μm | 2 | 2 | 2 | 2 | 2 | 2 | 2 | 1 |
F, female; M, male.
Fig. 18.
Examples of airway segmentation meshes shown with relative deposition measurements (color scale) per mouse strain. A: B6C3F1. B: BALB/C. C: C57BL/6. D: CD-1..
Table 3.
Summary statistics per mouse strain
| Strain |
|||||
|---|---|---|---|---|---|
| Measurement | Unit | B6C3F1 | BALB/C | C57BL/6 | CD-1 |
| Body weight | g | 21.7 ± 1.8 | 23.4 ± 1.5 | 22.7 ± 1.7 | 24.4 ± 1.0 |
| Respiratory rate | per min | 200 ± 44 | 245 ± 22 | 262 ± 21 | 189 ± 52 |
| Tidal volume | mL | 0.18 ± 0.05 | 0.25 ± 0.10 | 0.26 ± 0.03 | 0.31 ± 0.03 |
| Minute ventilation | mL/min | 37.4 ± 14.9 | 62.6 ± 26.1 | 67.1 ± 8.1 | 59.9 ± 18.8 |
| Inspiration to expiration ratio | 0.99 ± 0.11 | 0.88 ± 0.05 | 0.87 ± 0.08 | 0.90 ± 0.07 | |
| Age | wk | M:7, F:8 | M:7, F:11 | M:7, F:12 | M:5, F:6 |
| Lung volume | mm3 | 1,104.6 ± 39.3 | 1,093.2 ± 132.5 | 1,155.9 ± 123.7 | 1,195.6 ± 30.4 |
| Left lobe volume | mm3 | 363.7 ± 17.0 | 375.8 ± 48.8 | 379.2 ± 40.0 | 379.4 ± 21.9 |
| Cranial lobe volume | mm3 | 187.6 ± 12.6 | 185.4 ± 23.9 | 190.8 ± 31.6 | 230.8 ± 15.9 |
| Middle lobe volume | mm3 | 133.9 ± 10.0 | 139.2 ± 16.8 | 139.3 ± 14.1 | 150.3 ± 5.1 |
| Caudal lobe volume | mm3 | 310.1 ± 14.8 | 296.3 ± 37.8 | 333.9 ± 35.0 | 322.6 ± 13.3 |
| Accessory lobe volume | mm3 | 109.3 ± 6.6 | 96.5 ± 15.5 | 112.7 ± 7.1 | 112.5 ± 13.9 |
| Number of sublobes | 54.1 ± 1.2 | 54.0 ± 2.4 | 53.6 ± 1.9 | 54.4 ± 2.0 | |
| Sublobe volume | mm3 | 19.8 ± 20.5 | 19.8 ± 20.0 | 20.9 ± 22.0 | 21.4 ± 21.4 |
| Number of near-acini | 362.0 ± 52.8 | 348.7 ± 46.2 | 350.2 ± 91.0 | 390.4 ± 50.6 | |
| Near-acini volume | mm3 | 2.9 ± 1.8 | 3.0 ± 1.9 | 3.1 ± 2.0 | 2.9 ± 1.9 |
| Tree length | mm | 627.4 ± 8.1 | 567.9 ± 51.3 | 646.2 ± 46.7 | 554.8 ± 54.1 |
| Number of segments | 1,773.4 ± 219.8 | 1,448.5 ± 168.1 | 1,900.2 ± 264.2 | 1,379.0 ± 214.4 | |
| Number of outlet regions | 2,075.8 ± 227.5 | 1,972.1 ± 248.5 | 2,092.1 ± 305.9 | 1,700.7 ± 301.8 | |
| Outlet region area | mm2 | 0.012 ± 0.007 | 0.015 ± 0.011 | 0.012 ± 0.008 | 0.013 ± 0.009 |
| Branching angle | degree | 43.7 ± 20.2 | 42.8 ± 21.1 | 43.5 ± 20.1 | 43.9 ± 21.4 |
Measurement values are provided in mean ± SD format. F, female; M, male.
Fig. 19.
Summary plots per mouse strain. A: lung volume. B: number of airway segments. C: near-acini volumes.
Fig. 20.
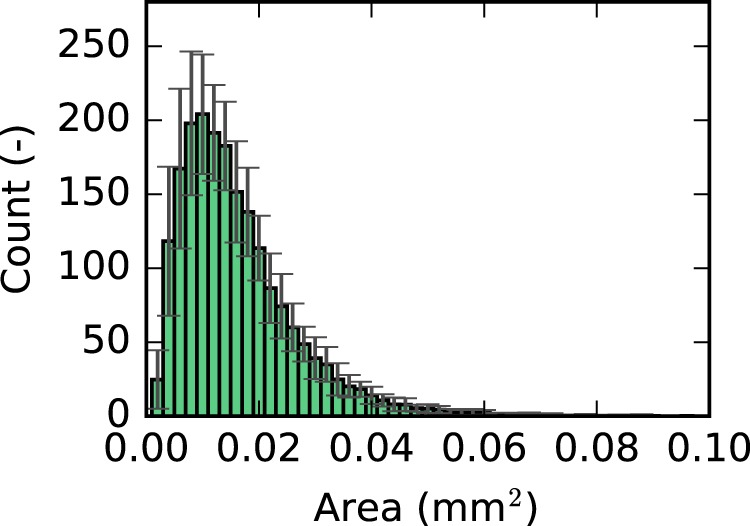
Histogram of outlet region area for BALB/C mice.
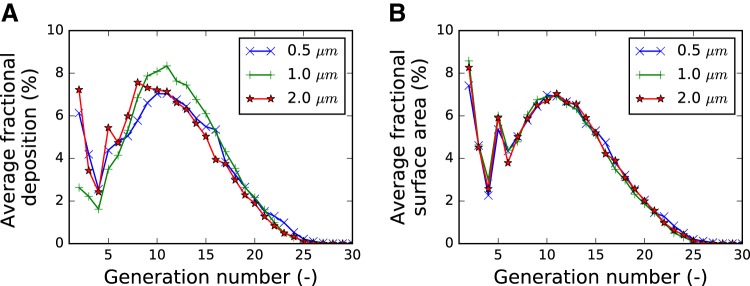
The average airway segment count and diameter as a function of segment generation per mouse strain is depicted in Fig. 21, A and B, respectively. The trachea is counted as generation one. For BALB/C mice, a few other groups reported detected average diameters per generation for BALB/C mice (7, 11, 16, 20, 28), and a comparison is provided in Fig. 21C. A comparison of the distribution of aerosol-deposition fraction and surface fraction in dependence of the airway tree generation is provided in Fig. 22.
Fig. 21.
Average airway-segment count and diameter measurements plotted as a function of generation number. A: comparison of the average number of airway segments between strains. B: comparison of average diameters between strains. C: comparison to measurements reported in literature on BALB/C mice. *Values were reconstructed from plots. **Authors do not provide generation-dependent measurements but measurements for certain labeled airway segments.
Fig. 22.
Average fractional aerosol deposition (A) and surface area (B) as a function of airway generation. Each curve depicts the average over all mice that were exposed to the same particle size (0.5, 1, or 2 μm). The fractional aerosol-deposition pattern changes in dependence of particle size. In contrast, there are only minor differences in surface fraction. Thus, the differences observable in A are caused by different deposition patterns per particle size. Results for 0.5 μm are based on 3 mouse data sets, while results for 1 μm and 2 μm are based on 16 and 15 mouse data sets, respectively.
The results of segmentation and outlet detection performance analysis were as follows: On average, 68.8 local airway wall regions were manually corrected per mouse, which represents 1.79% of the inner airway surface, on average. Among the deformed surface patches, the majority of corrections were small, with only 7.6 surface patches, on average, that were deformed by more than 100 μm. Furthermore, 199.1 outlets were found to be false positives (FP rate: 10.2%) and 20.2 outlets were found missing (FN rate: 1.0%), on average. Note that the outlet-detection algorithm was designed to have a higher FP than FN rate to avoid undetected outlets, and all identified errors were corrected during the quality-control step. In this context, correcting FP outlets is more efficient than FN outlet regions.
Data Archive
All data described above are available online in the lapdMouse Archive (5) under the Creative Commons 4.0 license. For each mouse, the archive includes all acquired raw cryomicrotome and ventilation files, preprocessed volumetric images for autofluorescent and aerosol channels with the normalized aerosol deposition image, generated airway meshes and models, volumetric label maps for all lung regions, and particle-deposition measurement files. In addition, software to access, download, and visualize data are provided. The provided documentation describes each used file format, provides example programs, and demonstrates how to use them. For example, program code demonstrating how to calculate airway branching angles can be found on the lapdMouse Archive website (5).
DISCUSSION
Performance
With the described approach, we were able to process and analyze a large number of mice. This is important because it enables assessment of anatomical variations as well as differences between sexes and/or strains. In contrast, other efforts reported in the literature have only analyzed/processed a lower number (single digits) of mice (e.g., Refs. 7, 11, 16, 20, 25, and 28). Furthermore, analyses were typically focused on diameter, segment length, and branching angle measurements, which were reported in papers. Although some of these approaches (7, 11, 25, 28) utilized image segmentation steps, resulting segmented data sets are typically not publicly available, which makes a meaningful comparison difficult and, at the same time, represents an obstacle for research and developing realistic computational toxicology approaches. In contrast, our focus was on producing high-resolution digital models of mouse lung anatomy (e.g., airways), which can in turn be used to automatically derive measurements as needed. An enabling factor was the utilized high-resolution imaging. In this context, tissue optical clearing imaging approaches are promising, as demonstrated in Refs. 30 and 25, but tissue preparation can influence geometries and limits exist in terms of usable particle size.
We observed two lung-volume outliers in our data (Fig. 19A): one very large C57BL/6 mouse and one BALB/C mouse with low lung volume, which was likely caused by underfilling with OCT during lung preparation. These data sets were not removed because they can still provide valuable insights. In general, one can observe that most measurements provided in Table 3 are in similar ranges across mouse strains. Although the numbers of segments and outlets are quite large (Table 3), the spread in numbers can be explained as follows: the image quality varied between data sets, i.e., in some data sets the airway walls were more discernable from the background, resulting in more detected airway segments.
Looking at diameter distribution as a function of generation (Fig. 21B), one can observe that airway diameters range down to ~100 μm, which is typical for terminal airways (9). Also, some differences between mouse strains, especially for the first few generations, can be observed, with BALB/C mice having narrower trachea and main bronchi compared with other mouse strains. This is also visible when comparing 3D renderings of the airway trees (Fig. 18). Similar results for BALB/C mice have been reported by other groups (7, 11, 16, 20, 28), and comparisons are given in Fig. 21C. Our measurements are well within the expected range of what others have reported. In this context, note that Counter et al. (7) imaged at an inflation level different from TLC, leading to narrower airway diameters. Furthermore, Thiesse et al. (28) reports results in mice that are ~30% heavier.
Figure 22A compares relative aerosol deposition as a function of airway generation. It appears that 2.0-μm-diameter particles deposit more in larger airways compared with the 1.0-μm-diameter particles. Note that we had too few mice (n = 3) with 0.5-μm-diameter particles to be able to identify differences from the other sizes of aerosol. A comparable plot of surface fraction (Fig. 22B) confirms that these differences are not caused by differences in airway segmentation but truly particle deposition. Following simulations with a stochastic particle-deposition model of BALB/C mice (29), such a shift is expected but has, to the best of our knowledge, not been measured previously. Examples of relative aerosol-deposition measurements on airway walls are shown in Fig. 18; one can observe an increased deposition at bifurcations. This observation correlates with simulations (18).
Impact
This work is important because 1) it greatly extends the number of measured airway generations in mice, 2) for the first time to our knowledge, site-specific deposition of aerosols are measured, 3) four of the most commonly employed mouse strains of both sexes are reported, 4) the data are all provided in an archive for others to use, and 5) we provided data on a relatively large number of animals to allow models to incorporate realistic heterogeneities in geometries and particle deposition.
The most commonly used mouse airway geometries have been derived from a study by Oldham and Phalen (19), who created silicone casts of the lungs from BALB/C and B6C3F1 mice. The first 6 generations of these casts were measured by hand, whereas the remaining 29 generations were added based on a mathematical model originally devised by Yeh et al. (31) for the rat lung. Our work now directly measures airway geometries all the way down to the 25th generation (terminal bronchioles) without the need for mathematical extrapolations.
No prior study has measured the site-specific deposition of aerosols in the mouse lung. All “data” of site-specific aerosol deposition are theoretical predictions based on simplified “typical path lung models” and the theoretical behavior of aerosol particles in airstreams (2). We now provide both the airway geometries and the site-specific deposition of three different-sized aerosol particles within the same animals. These data can now be compared with the theoretical models to validate their accuracy.
All prior studies predicting site-specific deposition of aerosol particles in mice use a single mathematical model that has no variation in the airway geometries at similar levels in the airway tree. By providing high-resolution geometries from multiple animals, heterogeneity in anatomical structure can now be added to particle-deposition models to better predict site-specific particle deposition across populations of mice.
A prior study using microcomputed tomography reported airway geometries of three mouse strains (BALB/C, C57BL/6, and A/J) down to the sixth generation (28). Although they visually and quantitatively demonstrated significant differences in the airway geometries of these three strains, they studied only male mice and have not provided their images for others to use. We now provide much higher resolution data in four mouse strains that include both sexes. The data, in various formats, are shared through a data archive and website (Data Archive) for others to use in the hopes of accelerating the investigation of health and diseases related to the respiratory system. This will in turn improve our understanding of site-specific airflows and how they affect drug, environmental, or biological aerosol deposition in health and diseases related to occupational exposures, air pollution, and tobacco smoke.
The numbers of questions that can be asked and explored within these data are numerous. Other than the obvious difference in central airway caliber, are there differences with regard to airway geometry such as branching angles, numbers of bifurcation, and parent-daughter diameter ratios, to name only a few? Are there differences in particle-deposition distributions associated with differences in airway geometries? Are there differences in airway geometries and particle-deposition distribution between sexes?
Limitations
There are a number of limitations to our study that must be understood by those considering using our data.
We were limited in the sizes of the aerosol particles that we were able to use because 1) a large enough fraction of them needed to be able to pass through the nasal cavity and upper airways and 2) they needed to be large enough to be detected with our imaging methods. Asgharian et al. (1) estimated the inhalability of particles in rats as a function of particle size and predicted that 93%, 84%, and 64% of 0.5 μm, 1.0 μm, and 2.0 μm-diameter particles, respectively, would be inhaled into the lungs with nose breathing. The amount of fluorescent dye that can be carried by the microspheres is proportional to their volume. Particles with a diameter of 0.5 μm carry only 1/64 of the dye than particles with a diameter of 2.0 μm and hence provide a weaker fluorescent signal. We therefore chose particle sizes that ranged between 0.5 μm and 2.0 μm in diameter.
Because it is not possible to resolve all of the individual fluorescent particles, we chose to use grayscale intensities in the images as a surrogate measure of particle numbers within each image voxel. This choice is well validated in quantifying fluorescence, in which fluorescent signals are linearly proportional to dye concentrations as long as the signal does not saturate the photon detector (Measuring relative aerosol deposition). The preliminary experiments we conducted demonstrated the linearity of our grayscale intensities across the range of fluorescence observed in our mouse studies.
Although the availability of high-resolution airway geometries enables a finer grain analysis, it also leads to new challenges for analysis approaches. For example, some airway segments can be quite short, as depicted in Fig. 23, which is in contrast to frequently utilized simple models, in which such situations typically do not occur. Such short segments could be merged with adjacent airway segments. Because no rules on how to handle such situations exist, we leave this decision to the user of our data.
Fig. 23.
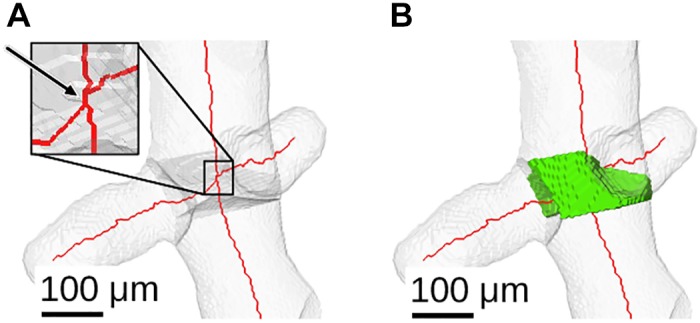
Example showing one short-airway skeleton segment between two branch points (A) and its assigned segment volume (B).
To link airway mesh vertices to relative particle measurement provided as an image volume, we have chosen a sampling approach, which allows us to report the nearby maximum relative deposition value (Airway wall-based deposition measurements) and, therefore, compensates for potential misalignments between airway wall and aerosol image volume. Because of the adaptive airway mesh resolution, sampling has a potential disadvantage of missing relevant measurements. To assess the relevance of this potential issue, we compared airway mesh-based and voxel-shell-based measurements (Fig. 24). For example, at location 1 in Fig. 24, the mesh-based sampling approach shows higher deposition values (Fig. 24A) compared with the voxel-shell–based approach (Fig. 24B). On the other hand, at location 2 in Fig. 24, the deposition signal is less pronounced for the mesh-based approach. As the example given in Fig. 25 demonstrates, there is good correlation between mesh-based and voxel-shell-based cumulative particle measurements (i.e., the area/volume-weighted sum of all particle-deposition values of a structure) for airway segments. Furthermore, because all relevant data are publicly available, users can develop alternative approaches for linking airway meshes to relative particle deposition.
Fig. 24.
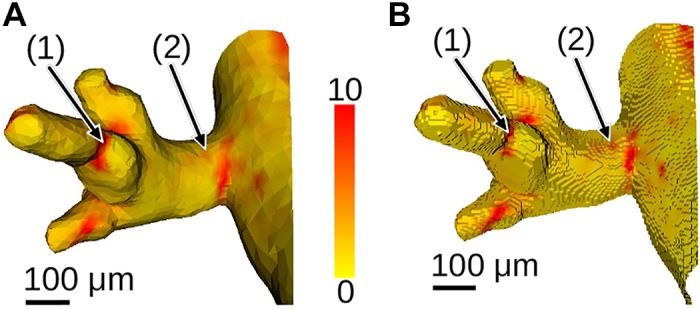
Comparison of airway mesh-based (Airway wall-based deposition measurements) (A) and voxel-shell-based (B) measurement of relative particle deposition (color scale). For the voxel-based measurement in B, the airway mesh was voxelized and the voxel shell is utilized to represent airways. This enables a direct transfer for relative deposition values of the aerosol image volume (see Limitations).
Fig. 25.

Comparison of cumulative relative aerosol deposition measurement approaches on a per airway-segment basis for a Balb/C mouse data set (see Limitations).
We imaged all lungs at a single lung volume. We chose total lung capacity because this was the most reproducible volume and it allowed us to identify more terminal airways. Because airway diameter changes with lung volume, our data sets therefore only provide airway geometries and particle deposition at this single volume. Investigators who choose to model particle deposition using computational fluid dynamics will need to make assumptions as to how the airway geometry changes with tidal respiration.
To preserve the airway architecture when slicing the lungs, we instilled OCT via the trachea and froze them. It is possible that filling the airways with OCT may have moved some of the deposited particles. While we are not able to definitively prove that particles were not dislodged, in all of the lungs that we imaged, we rarely observed a fluorescent particle suspended in the OCT away from an airway wall. If the particles were moved with the instillation of OCT, we would have expected some of them to be moved by the turbulent flow of the OCT and into an airway lumen. One prior study (26) explored the redistribution of small droplets of 2.5 μm diameter fluorescent particles within plastic tubes while OCT was injected into the tubes. They reported that the small droplets moved within the plastic tube. Unfortunately, this study does not replicate our in vivo conditions in which individual microspheres lay against an airway wall with mucous, a glycocalyx layer, and cilia.
The lungs were removed from the chest cavity to fill them with OCT. Although we attempted to maintain the in vivo configuration by using a silicone mold of a chest wall to encase the lungs, the orientation of the lung lobes shifted slightly, which will distort the airway geometry.
We attempted to capture the breathing patterns of each mouse using impedance plethysmography. This is a noninvasive method that indirectly estimates respiratory breathing patterns in conscious small animals (10). The method is not without challenges or potential errors (14). The breathing patterns recorded and preserved in the data repository for each animal should be regarded with these caveats.
Ideally, one would like to locate and count individual particles (microspheres). However, because of limitations in image resolution, this is not possible. Instead, we provide relative deposition measurements. The utilized imaging approach introduces a directional blur. Deconvolution is an image restoration method that can reduce/reverse such an effect. As with all image restoration approaches, effectiveness depends on an exact model of disturbance inducing process, which is dependent on local tissue properties as well as a number of other (unknown) parameters. Although the utilized deconvolution approaches help in reducing the directional blur, they represent a simplification by assuming just one homogeneous tissue type. Consequently, different types of error may be introduced. For example, the location and shape of airway walls might be affected (autofluorescence images) or the relative particle-deposition measurement inside the airway lumen may not reach zero (aerosol images). Similarly, the utilized imaging artifact (e.g., shards) removal step can also locally affect measurements.
The airway wall and outlet segmentation process is highly automated, and a manual inspections step was used for quality assurance, and (major) errors were manually corrected. However, smaller surface positioning errors can occur. Furthermore, imaging artifacts, noise, image contrast, etc., can result in undetected outlets and may influence outlet mesh surface area. For example, some outlets have a larger area, as shown in Fig. 12C and the plot in Fig. 20. Limitations of our near-acini partitioning approach were discussed previously in Ref. 8.
Conclusion
This study brings together high-resolution airway geometries with site-specific aerosol particle deposition in the same laboratory animals. Multiple animals of four different strains and both sexes provide a robust data set that others can use for modeling and to facilitate computational biology of inhaled particles and gases. Although the data are restricted to a small range of particle sizes, future work and advances in imaging may extend the range into the nanoparticles.
GRANTS
This work was supported in part by NIH/National Institute of Environmental Health Sciences Grant R01-ES-023863.
DISCLOSURES
No conflicts of interest, financial or otherwise, are declared by the authors.
AUTHOR CONTRIBUTIONS
R.W.G. and R.R.B. conceived and designed research; C.B., M.A.K., and W.J.L. performed experiments; C.B., M.A.K., W.J.L., R.W.G., and R.R.B. analyzed data; C.B., M.A.K., W.J.L., R.W.G., and R.R.B. interpreted results of experiments; C.B. and M.A.K. prepared figures; C.B., M.A.K., R.W.G., and R.R.B. drafted manuscript; W.J.L., R.W.G., and R.R.B. edited and revised manuscript; R.W.G. and R.R.B. approved final version of manuscript.
References
- 1.Asgharian B, Kelly JT, Tewksbury EW. Respiratory deposition and inhalability of monodisperse aerosols in Long-Evans rats. Toxicol Sci 71: 104–111, 2003. doi: 10.1093/toxsci/71.1.104. [DOI] [PubMed] [Google Scholar]
- 2.Asgharian B, Price OT, Oldham M, Chen L-C, Saunders EL, Gordon T, Mikheev VB, Minard KR, Teeguarden JG. Computational modeling of nanoscale and microscale particle deposition, retention and dosimetry in the mouse respiratory tract. Inhal Toxicol 26: 829–842, 2014. doi: 10.3109/08958378.2014.935535. [DOI] [PMC free article] [PubMed] [Google Scholar]
- 3.Bauer C, Krueger MA, Lamm WJ, Smith BJ, Glenny RW, Beichel RR. Airway tree segmentation in serial block-face cryomicrotome images of rat lungs. IEEE Trans Biomed Eng 61: 119–130, 2014. doi: 10.1109/TBME.2013.2277936. [DOI] [PMC free article] [PubMed] [Google Scholar]
- 5.Beichel R. R., Glenny R. W., Bauer C., Krueger M. A., and Lamm W. J.. Lung Anatomy + Particle Deposition (lapd) Mouse Archive. University of Iowa, URL: doi: 10.25820/9arg-9w56, 2019. [DOI] [Google Scholar]
- 6.Bernard SL, Ewen JR, Barlow CH, Kelly JJ, McKinney S, Frazer DA, Glenny RW. High spatial resolution measurements of organ blood flow in small laboratory animals. Am J Physiol Heart Circ Physiol 279: H2043–H2052, 2000. doi: 10.1152/ajpheart.2000.279.5.H2043. [DOI] [PubMed] [Google Scholar]
- 7.Counter WB, Wang IQ, Farncombe TH, Labiris NR. Airway and pulmonary vascular measurements using contrast-enhanced micro-CT in rodents. Am J Physiol Lung Cell Mol Physiol 304: L831–L843, 2013. doi: 10.1152/ajplung.00281.2012. [DOI] [PubMed] [Google Scholar]
- 8.Glenny RW, Bauer C, Hofmanninger J, Lamm WJ, Krueger MA, Beichel RR. Heterogeneity and matching of ventilation and perfusion within anatomical lung units in rats. Respir Physiol Neurobiol 189: 594–606, 2013. doi: 10.1016/j.resp.2013.07.027. [DOI] [PMC free article] [PubMed] [Google Scholar]
- 9.Hwang J, Kim M, Kim S, Lee J. Quantifying morphological parameters of the terminal branching units in a mouse lung by phase contrast synchrotron radiation computed tomography. PLoS One 8: e63552, 2013. doi: 10.1371/journal.pone.0063552. [DOI] [PMC free article] [PubMed] [Google Scholar]
- 10.Irvin CG, Bates JH. Measuring the lung function in the mouse: the challenge of size. Respir Res 4: 1, 2003. doi: 10.1186/rr199. [DOI] [PMC free article] [PubMed] [Google Scholar]
- 11.Islam A, Oldham MJ, Wexler AS. Comparison of manual and automated measurements of tracheobronchial airway geometry in three balb/c mice. Anat Rec (Hoboken) 300: 2046–2057, 2017. doi: 10.1002/ar.23624. [DOI] [PubMed] [Google Scholar]
- 12.Krishnamurthi G, Wang CY, Steyer G, Wilson DL. Removal of subsurface fluorescence in cryo-imaging using deconvolution. Opt Express 18: 22324–22338, 2010. doi: 10.1364/OE.18.022324. [DOI] [PMC free article] [PubMed] [Google Scholar]
- 13.Lee Z, Ljungberg M, Muzic RF Jr, Berridge MS. Usefulness and pitfalls of planar gamma-scintigraphy for measuring aerosol deposition in the lungs: a Monte Carlo investigation. J Nucl Med 42: 1077–1083, 2001. [PubMed] [Google Scholar]
- 14.Lomask M. Further exploration of the Penh parameter. Exp Toxicol Pathol 57, Suppl 2: 13–20, 2006. doi: 10.1016/j.etp.2006.02.014. [DOI] [PubMed] [Google Scholar]
- 15.Lucy LB. An iterative technique for the rectification of observed distributions. Astron J 79: 745–754, 1974. doi: 10.1086/111605. [DOI] [Google Scholar]
- 16.Madl P, Hofmann W, Oldham MJ, Asgharian B. Stochastic morphometric model of the BALB/c mouse lung. Anat Rec (Hoboken) 293: 1766–1775, 2010. doi: 10.1002/ar.21208. [DOI] [PubMed] [Google Scholar]
- 17.National Research Council (U.S.) Committee for the Update of the Guide for the Care and Use of Laboratory Animals, Institute for Laboratory Animal Research (U.S.), and National Academies Press (U.S.). Guide for the care and use of laboratory animals (8th ed.). Washington, D.C.: National Academies Press, 2011. [Google Scholar]
- 18.Nowak N, Kakade PP, Annapragada AV. Computational fluid dynamics simulation of airflow and aerosol deposition in human lungs. Ann Biomed Eng 31: 374–390, 2003. doi: 10.1114/1.1560632. [DOI] [PubMed] [Google Scholar]
- 19.Oldham MJ, Phalen RF. Dosimetry implications of upper tracheobronchial airway anatomy in two mouse varieties. Anat Rec 268: 59–65, 2002. doi: 10.1002/ar.10134. [DOI] [PubMed] [Google Scholar]
- 20.Oldham MJ, Robinson RJ. Predicted tracheobronchial and pulmonary deposition in a murine asthma model. Anat Rec (Hoboken) 290: 1309–1314, 2007. doi: 10.1002/ar.20593. [DOI] [PubMed] [Google Scholar]
- 21.Palágyi K, Balogh E, Kuba A, Halmai C, Erdőhelyi B, Sorantin E, Hausegger K. A sequential 3D thinning algorithm and its medical applications, in IPMI 2001, edited by Insana MF, Leahy RM. Berlin, Heidelberg: Springer-Berlin Heidelberg, 2001, p. 409–415. [Google Scholar]
- 22.Richardson WH. Bayesian-based iterative method of image restoration*. J Opt Soc Am 62: 55–59, 1972. doi: 10.1364/JOSA.62.000055. [DOI] [Google Scholar]
- 23.Rueckert D, Sonoda LI, Hayes C, Hill DLG, Leach MO, Hawkes DJ. Nonrigid registration using free-form deformations: application to breast MR images. IEEE Trans Med Imaging 18: 712–721, 1999. doi: 10.1109/42.796284. [DOI] [PubMed] [Google Scholar]
- 24.Sarder P, Nehorai A. Deconvolution methods for 3-d fluorescence microscopy images. IEEE Signal Process Mag 23: 32–45, 2006. doi: 10.1109/MSP.2006.1628876. [DOI] [Google Scholar]
- 25.Scott GD, Blum ED, Fryer AD, Jacoby DB. Tissue optical clearing, three-dimensional imaging, and computer morphometry in whole mouse lungs and human airways. Am J Respir Cell Mol Biol 51: 43–55, 2014. doi: 10.1165/rcmb.2013-0284OC. [DOI] [PMC free article] [PubMed] [Google Scholar]
- 26.Srirama PK, Wallis CD, Lee D, Wexler AS. Imaging extra-thoracic airways and deposited particles in laboratory animals. J Aerosol Sci 45: 40–49, 2012. doi: 10.1016/j.jaerosci.2011.10.007. [DOI] [Google Scholar]
- 27.Steyer GJ, Roy D, Salvado O, Stone ME, Wilson DL. Removal of out-of-plane fluorescence for single cell visualization and quantification in cryo-imaging. Ann Biomed Eng 37: 1613–1628, 2009. doi: 10.1007/s10439-009-9726-x. [DOI] [PMC free article] [PubMed] [Google Scholar]
- 28.Thiesse J, Namati E, Sieren JC, Smith AR, Reinhardt JM, Hoffman EA, McLennan G. Lung structure phenotype variation in inbred mouse strains revealed through in vivo micro-CT imaging. J Appl Physiol (1985) 109: 1960–1968, 2010. doi: 10.1152/japplphysiol.01322.2009. [DOI] [PMC free article] [PubMed] [Google Scholar]
- 29.Winkler-Heil R, Hofmann W. Modeling particle deposition in the Balb/c mouse respiratory tract. Inhal Toxicol 28: 180–191, 2016. doi: 10.3109/08958378.2016.1148801. [DOI] [PubMed] [Google Scholar]
- 30.Yang L, Feuchtinger A, Möller W, Ding Y, Kutschke D, Möller G, Schittny JC, Burgstaller G, Hofmann W, Stoeger T, Daniel Razansky, Walch A, Schmid O. Three-dimensional quantitative co-mapping of pulmonary morphology and nanoparticle distribution with cellular resolution in nondissected murine lungs. ACS Nano 13: 1029–1041, 2019. doi: 10.1021/acsnano.8b07524. [DOI] [PubMed] [Google Scholar]
- 31.Yeh HC, Schum GM, Duggan MT. Anatomic models of the tracheobronchial and pulmonary regions of the rat. Anat Rec 195: 483–492, 1979. doi: 10.1002/ar.1091950308. [DOI] [PubMed] [Google Scholar]


