

Abstract
The study of dynamic cerebral autoregulation (DCA) in essential hypertension has received considerable attention because of its clinical importance. Several studies have examined the dynamic relationship between spontaneous beat-to-beat arterial blood pressure data and contemporaneous cerebral blood flow velocity measurements (obtained via transcranial Doppler at the middle cerebral arteries) in the form of a linear input-output model using transfer function analysis. This analysis is more reliable when the contemporaneous effects of changes in blood CO2 tension are also taken into account, because of the significant effects of CO2 dynamic vasomotor reactivity (DVR) upon cerebral flow. In this article, we extract such input-output predictive models from spontaneous time series hemodynamic data of 24 patients with essential hypertension and 20 normotensive control subjects under resting conditions, using the novel methodology of principal dynamic modes (PDMs) that achieves improved estimation accuracy over previous methods for relatively short and noisy data. The obtained data-based models are subsequently used to compute indexes and markers that quantify DCA and DVR in each subject or patient and therefore can be used to assess the effects of essential hypertension. These model-based DCA and DVR indexes were properly defined to capture the observed effects of DCA and VR and found to be significantly different (P < 0.05) in the hypertensive patients. We also found significant differences between patients and control subjects in the relative contribution of three PDMs to the model output prediction, a finding that offers the prospect of identifying the physiological mechanisms affected by essential hypertension when the PDMs are interpreted in terms of specific physiological mechanisms.
NEW & NOTEWORTHY This article presents novel model-based methodology for obtaining diagnostic indexes of dynamic cerebral autoregulation and dynamic vasomotor reactivity in hypertension.
Keywords: cerebral autoregulation, cerebral CO2 vasoreactivity, dynamic cerebral autoregulation, dynamic vasomotor reactivity, hypertension
INTRODUCTION
The effects of essential hypertension on cerebral blood flow regulation (3, 4, 18, 27, 28, 55–59, 64, 65) have been studied for its association with cognitive impairment (6, 9, 10, 12, 19, 21) and stroke (2, 7, 10, 23, 37, 38, 44, 62) because of the major impact of these pathologies upon public health (23, 60). In particular, the cerebrovascular effects have been studied in terms of alterations in cerebral autoregulation (i.e., the physiological process that seeks to constrain the change of cerebral blood flow in response to a change of arterial blood pressure) (1, 5, 14, 18, 22, 24, 28, 35, 39–42, 44, 46–49, 55–57, 59, 63, 66). The physiological process of cerebral autoregulation received early attention in terms of the steady-state pressure-flow homeostatic plateau of Lassen’s curve (24). The effect of essential hypertension was deemed significant in shifting Lassen’s autoregulatory curve to the right (i.e., toward higher arterial pressure, an effect akin to higher cerebrovascular resistance) and increasing the risk of accidental hypoperfusion (1, 7, 18, 24, 44, 47–49, 57–59). However, this view was not universally accepted, and unimpaired cerebral autoregulation in hypertension was also reported (8). The ambiguous results of static cerebral autoregulation motivated studies of the effects of hypertension on dynamic cerebral autoregulation (DCA), which pertains to the change in cerebral blood flow caused by a transient change of arterial blood pressure over a timescale of a few seconds (which is pertinent to naturally occurring abrupt changes in blood pressure) (27, 28, 34, 35, 39–42, 44, 45, 49, 55–59). This research trend was reinforced by the introduction of direct measurements of cerebral blood flow velocity (CBFV) at the middle cerebral arteries (MCAs) via transcranial Doppler (1). Nonetheless, the study of cerebral autoregulation (static or dynamic) remains confounded by the complexity of the physiological processes involved, which are thought to include cerebrovascular changes mediated by myogenic, metabolic, and endocrine factors as well as autonomic, perivascular, and endothelial processes (13, 17, 20, 25, 26, 36, 45, 48, 49, 52, 61, 67).
Since the physiological process of DCA is critical for the protection of the cerebral vasculature against sudden surges of cerebral flow (a risk factor for edema/stroke or injury to the blood-brain barrier in the endothelium) or against sudden drops of cerebral flow (a risk factor for ischemia/stroke or hypoperfusion), the focus of recent studies has been on the dynamics of cerebral autoregulation with frequency-domain approaches of cross-spectral or transfer function (TF) analysis (5, 22, 39, 46, 57, 59, 64–66). In the context of hypertension, these studies have compared the magnitude or phase of the observed cerebrovascular impedance (the inverse of the TF), composed of both resistance and compliance, over a broad frequency range (typically from 0.02 to 0.20 Hz) in hypertensive patients versus normotensive control subjects (46, 57, 64, 65). These studies reported a significant increase of cerebrovascular impedance magnitude (or, equivalently, decrease in TF gain) in the frequency range 0.07–0.20 Hz for essential hypertension or for acute hypertension induced by phenylephrine injection, with a concomitant increase of TF gain in the frequency range 0.02–0.07 Hz. The phase changes in the dynamic relation between blood pressure and flow (specifically a change in the phase lead over the 0.05–0.10 Hz frequency range) have also been studied in the context of DCA, leading to a distinct definition of a DCA marker (37, 38). In the time domain, quantitative methods that have been used for the study of DCA include the autoregulatory index, correlation, and model-based indexes (30–35, 39–41), each approach utilizing its distinct definition of DCA.
The study and interpretation of the effects of essential hypertension upon vasomotor reactivity to blood CO2 changes have received less attention so far (4, 27, 35, 46, 51) and have been limited to static vasoreactivity measurements (reporting significant effects of hypertension on static CO2 vasoreactivity) rather than examination of the dynamic vasomotor reactivity (DVR). The latter has received prominent attention in recent studies of cerebral flow regulation with regard to contemporaneous changes of blood pressure and CO2 (30–35), but these studies have been limited thus far to normal subjects and patients with cognitive impairment. The present study extends this approach to hypertensive patients. We note that the measurement of static vasoreactivity employs breath holding or CO2 inhalation over several minutes to induce a significant rise in blood CO2 tension and compute the vasoreactivity as the ratio of the measured steady-state rise in cerebral flow to the inhaled CO2 level. This process is uncomfortable for the patient and fraught with potential experimental/measurement inaccuracies. We have found in our previous work that reliable measurements of DVR can be obtained through model-based analysis of spontaneous variations in end-tidal CO2 (ETCO2) data (a proxy of changes in blood CO2 tension) concurrently with spontaneous changes in arterial blood pressure (ABP), as two contemporaneous “inputs” influencing changes in cerebral blood flow “output.” The obtained input-output models allow quantification of the dynamics of cerebral flow regulation under spontaneous contemporaneous changes in blood pressure and CO2. This capability was demonstrated in our previous work, where we found that patients with mild cognitive impairment or Alzheimer’s disease have impaired DVR relative to age-matched control subjects (31–33), making the model-based DVR index a potentially valuable diagnostic “physiomarker.”
This model-based approach was followed in the present study [using principal dynamic modes (PDMs)] to examine the effects of essential hypertension upon DCA and DVR to advance our scientific understanding and ascertain the potential utility of model-based DCA and DVR indexes as diagnostic physiomarkers for essential hypertension and/or as reliable means for monitoring/quantifying the effects of treatment on these two aspects of cerebral flow regulation.
Another goal of this study was to propose a quantitative and reproducible definition of DCA that can contribute to clearer communication among peer investigators and improved consistency of reported results regarding the effects of essential hypertension (or any other condition/pathology) on cerebral autoregulation. The detailed methodology, results, and plausible physiological interpretations are provided in the following sections.
MATERIALS AND METHODS
Modeling methodology.
The key to the extraction of reliable model-based DCA and DVR physiomarkers is the modeling methodology that has been pioneered by our laboratory and employs principal dynamic modes (PDMs) (29, 30) to obtain reliable hemodynamic models from time series data viewed as putative inputs or outputs depending on the objectives of the study. The advocated modeling methodology is rigorous (based on solid mathematical/computational foundations) and applicable to all finite-memory dynamic linear or nonlinear systems. It also offers significant advantages in estimation accuracy for short and noisy data sets, typical of an experimental or clinical context, as shown in many applications to date (30–33). The present study is limited to linear modeling because of the relatively short input-output data sets available in this application context but can be extended to nonlinear modeling if longer data sets become available. A brief outline of the advocated methodology is given in the appendix. Detailed methodological elaboration can be found in the cited references (29–33).
A general linear stationary model describing the dynamic relationship of the output y(t) with two inputs, p(t) and x(t), is given by the expression
| (1) |
where kp and kx denote the two “kernels” of the model with respect to input p(t) and input x(t), respectively. The kernels describe fully the dynamic characteristics of this general linear input-output model and allow prediction of the output y(t) for any given input waveforms p(t) and x(t). As outlined in the appendix, when the kernels are expanded in terms of the global PDMs of the system, then the input-output Eq. 1 becomes
| (2) |
where {uj} and {zm} denote the PDM outputs for the two inputs, ABP and ETCO2, respectively, and {Aj} and {Cm} are the scalar “gains” associated with each PDM output. These gains are estimated, along with k0, via least-squares regression of Eq. 2 and yield estimates of the kernels (see appendix). The term “global PDMs” is used to denote the PDMs extracted from the kernels of all the control subjects via singular value decomposition (SVD), and they are used subsequently to analyze all data (i.e., estimate the kernels for each patient and control subject as the respective linear combination of the global PDMs). The PDM modeling approach seeks to identify the minimum set of basis functions that can be used to represent all kernels of a particular input-output pair as linear combinations of the global PDMs. The latter are distinct and characteristic for each input-output pair and capable of providing satisfactory approximation of the respective kernels.
In this modeling study, we found that four global PDMs were adequate and necessary to model the system. We note that, although the global PDMs are common for all subjects, the estimated gain coefficients {Aj} and {Cm} that define the relative contributions of the global PDM outputs to the model output prediction are subject specific and can be used to characterize the cerebral hemodynamics of each subject (control subject or patient). Thus they constitute a set of “markers” with potential diagnostic utility that can be used to examine possible differences between control subjects and patients in terms of how each PDM output affects the total model output.
Data collection.
The data for this study were collected in accordance to the Declaration of Helsinki at the Luzerner Kantonsspital, Lucerne, Switzerland, with the approval of the local ethics committee and after each control subject or patient gave written informed consent. All measurements were noninvasive, safe, and comfortable for the subjects and followed recently published recommendations of the peer community (5). Data collection was performed under spontaneous resting conditions in supine position, 3–4 h after a light meal or caffeine intake. The recording room was quiet with dim lighting. Highly sampled (1 kHz) spontaneous hemodynamic data were collected from 20 control subjects (CS) and 24 hypertensive patients (HP) for 1) cerebral blood flow velocity (CBFV) with a 2-MHz transcranial Doppler (TCD) probe (Multi-Dop X digital, DWL, Compumedics, Germany) placed over the temporal window and fixed at constant angle with a custom-made holder to record at the left and right middle cerebral arteries (MCAs) of the subject in supine resting position; 2) arterial blood pressure (ABP) via finger photoplethysmography (Finapres) after calibration to the brachial artery pressure; and 3) end-tidal CO2 (ETCO2) via capnography using a nasal cannula (Criticare Systems) that was built in the system incorporating the TCD measurement device.
We included patients with essential hypertension for at least 5 yr, whose high ABP was adequately controlled through medication (monotherapy or combination of several drugs necessary to control the high ABP). Only two patients (both female) were not on antihypertensive medications. Apart from various hypertension medications, the comedications of statin and acetylsalicyl acid were allowed. Smokers and diabetic patients were excluded from this study. Cerebral brain imaging was not required. Extracranial and intracranial occlusive artery disease, defined as a vessel occlusion > 50% as assessed by ultrasound examination of the arteries, was also an exclusion criterion. The sex composition and the mean [standard deviation (SD)] of age and baseline values of ABP, ETCO2, and CBFV at the left and right MCAs are given in Table 1 for all patients and control subjects. As expected, the average (baseline) value of ABP is significantly larger for the HP group (although all patients, except 2, are under antihypertensive medication), but no significant difference exists in the average (baseline) value of ETCO2 and CBFV.
Table 1.
Mean (SD) values for age, ABP, ETCO2, and CBFV at left and right MCAs for 24 HP and 20 CS
| 20 CS | 24 HP | P | |
|---|---|---|---|
| Sex | 11 male and 9 female | 16 male and 8 female | |
| Age, yr | 52.30 (11.82) | 60.63 (13.62) | 0.036 |
| CBFV baseline at left MCA, cm/s | 54.97 (6.73) | 54.45 (10.83) | 0.845 |
| CBFV baseline at right MCA, cm/s | 52.98 (10.37) | 50.50 (10.99) | 0.446 |
| ABP baseline, mmHg | 84.56 (15.53) | 97.67 (15.00) | 0.007 |
| ETCO2 baseline, mmHg | 38.12 (7.19) | 39.75 (8.36) | 0.492 |
ABP, arterial blood pressure; CBFV, cerebral blood flow velocity; CS, control subjects; ETCO2, end-tidal CO2; HP, hypertensive patients; MCA, middle cerebral artery.
Data preparation.
From the raw data, we extracted the beat-to-beat mean blood flow velocity (CBFV, in cm/s) and mean arterial blood pressure (ABP, in mmHg) as averages over each R-R interval, which were placed at the midpoint of the R-R interval. We also extracted the breath-to-breath ETCO2 (in mmHg) as the maximum values of exhaled CO2 measurements and placed at the midpoint of the respective breath demarcated by the successive end-tidal time points. Since the resulting sequence of data samples is not equally spaced, we interpolated the data with cubic spline interpolation and resampled the time series data evenly at Δt = 0.25 s, after applying detrending and hard clipping at ±20% of baseline (DC) values to minimize the effect of possible artifacts/outliers. Using 5 min of the interpolated data samples from each subject, we applied high-pass filtering above 0.008 Hz to eliminate very slow effects of endocrine and metabolic factors. Figure 1 shows illustrative preprocessed CBFV, ABP, and ETCO2 data for a control subject and a hypertensive patient in the time and frequency domains. We observe that most of the power of these spontaneous (resting state) data is found below 0.25 Hz for CBFV or ABP and below 0.12 Hz for ETCO2. The dynamic range of these spontaneous signals is relatively narrow (±10 mmHg for ABP, ±10 cm/s for CBFV, and ±5 mmHg for ETCO2), and therefore they are not extending beyond the homeostatic plateau of the static autoregulatory curve of Lassen. The proposed modeling analysis of these spontaneous small-amplitude signals can yield useful information regarding the dynamic cerebral autoregulation and CO2 vasomotor reactivity characteristics for each subject/patient.
Fig. 1.

Illustrative preprocessed beat-to-beat data of cerebral blood flow velocity (CBFV, top), arterial blood pressure (ABP, middle), and end-tidal CO2 (ETCO2, bottom) for a control subject and a hypertensive patient, plotted in the time domain (left) and the frequency domain (right).
RESULTS
Following the procedure outlined in the appendix, we obtained the PDM-based models of the hemodynamic system with CBFV output and two inputs (ABP and ETCO2) for data collected at the left and right middle cerebral arteries (MCAs). The kernels for left and right MCA of each control subject or patient were not significantly different and were averaged for subsequent analysis. Each estimated model was evaluated for its predictive capability by computing the normalized mean-square error (NMSE) of the model prediction ypred(t) in each subject/patient as
| (3) |
where || . || denotes the sum of the squares of the signal samples indicated between the double bars. Models with prediction NMSE ≤ 75% are deemed satisfactory for the purposes of this study. This criterion was satisfied by all 20 control subjects (CS) and all 24 hypertensive patients (HP). The mean (SD) NMSE values of the model predictions were 47.78 (19.51)% for the 24 HP and 43.80 (13.46)% for the 20 CS (P = 0.429).
Kernel estimates.
The average kernel estimates and the SD bounds for the PDM-based models are shown in Fig. 2 for the ABP input (Fig. 2, left) and ETCO2 input (Fig. 2, right) over the 20 CS and 24 HP. The average kernels for the ABP input are similar in waveform for both HP and CS and exhibit high initial positive values followed by a negative trough (although the HP kernel trough returns to the zero line faster and exhibits a secondary shallow trough between 3- and 8-s lag). The average kernels for the ETCO2 input are drastically different between HP and CS for short lags (0–2 s), with the HP kernel having negative values that imply reduction of cerebral flow in response to an increase in ETCO2 (contrary to normal CO2 vasomotor reactivity). The CS kernel is all positive, consistent with normal CO2 vasomotor reactivity.
Fig. 2.

Average and standard deviation (SD) bounds of estimated kernels for the arterial blood pressure (ABP) input (left) and the end-tidal CO2 (ETCO2) input (right) over the 20 control subjects (CS) and 24 hypertensive patients (HP)
On the basis of these average kernel estimates, we explore the proper definition of model-based indexes that can quantify the key physiological functions of DCA and DVR.
Dynamic cerebral autoregulation indexes.
The model-based dynamic cerebral autoregulation (DCA) indexes rely on the ABP input kernel estimates and seek to capitalize on the observed kernel differences. To this purpose, we examined the model-predicted CBFV response to a unit-step change of the ABP input while the ETCO2 input was kept at zero. The results are shown in Fig. 3 for the average kernels of HP and CS. Some differences are evident in the average responses: the HP response has a lower early peak and approaches a lower steady-state level for long lags in a different manner (between 3- and 8-s lag), with the steady-state response being lower for HP. If the DCA autoregulatory action is viewed as the relative reduction from the early CBFV peak response, then a plausible definition of the DCA index would be DCA = (A – B)/A, where A is the early peak response and B is the steady-state response (e.g., at 10-s lag). This definition was used in our previous work (32, 33) but did not yield significantly different DCA indexes between HP and CS in the present study [mean (SD) DCA values for this definition are 0.784 (0.239) for CS vs. 0.830 (0.161) for HP, corresponding to a P value of 0.469]. However, if we utilize the observed different manner of approaching the steady-state response by defining the DCA index as the difference of the CBFV response value at 3 s minus the value at 8 s (Fig. 3), then the mean (SD) values of the obtained DCA indexes are 0.135 (0.202) for HP vs. −0.008 (0.139) for CS, yielding a P value of 0.0087, which indicates a significant difference between CS and HP. Figure 3 suggests that the main difference in the average HP kernel (vs. the average CS kernel) is a latent increase of cerebrovascular resistance (after 3-s lag) that causes a gradual reduction of CBFV response leading to a lower steady-state value. Although this novel DCA index yields a small P value in this study (if we accept that some significant DCA difference is likely between HP and CS), its unusual definition discourages its adoption at the present time in favor of the frequency-domain DCA indexes that have been considered in various forms previously (see below).
Fig. 3.

Average model-predicted cerebral blood flow velocity (CBFV) responses to a unit-step change of the arterial blood pressure (ABP) input, while the end-tidal CO2 input is kept at zero, for the average kernels of 20 control subjects (CS) and 24 hypertensive patients (HP) shown in Fig. 2. The black circles mark the time lags in the CBFV response curves that can be used for the definition of a novel time-domain dynamic cerebral autoregulation (DCA) index (see text), although this unusual DCA definition discourages its adoption at the present time in favor of frequency-domain DCA indexes.
Another plausible definition of DCA may be derived from frequency-domain analysis by examining the differences between CS and HP in the average ABP-to-CBFV transfer functions (i.e., the admittance function that is the Fourier transform of the kernel kp) shown in Fig. 4 for CS and HP in magnitude (gain function) and phase (phase function). We examine the differences between CS and HP over the frequency ranges (Fig. 4) that have been traditionally defined by the peer community for cerebral autoregulation (5), namely, the very low frequency (VLF) range from 0.02 to 0.07 Hz and the low frequency (LF) range from 0.07 to 0.15 Hz.
Fig. 4.

Gain function (left) and phase function (right) of the average transfer functions (i.e., the Fourier transforms of the respective kernels) for 20 control subjects (CS) and 24 hypertensive patients (HP). The dashed vertical lines demarcate at 0.02, 0.07, and 0.15 Hz the frequency ranges that have been defined traditionally by the peer community in the study of cerebral autoregulation (5).
Measures of cerebral autoregulation in the transfer function analysis literature have been defined, quantitatively or qualitatively, either as the ratio of the average VLF gain to LF gain function (termed here the “gain-ratio DCA” index) or as the average of the VLF phase function (termed here the “phase-sum DCA” index). The resulting mean (SD) values for the gain-ratio DCA index are 0.627 (0.186) for HP vs. 0.521 (0.105) for CS, corresponding to a P value of 0.0234, and for the phase-sum DCA index are 0.577 (0.318) for HP vs. 0.782 (0.193) for CS, corresponding to a P value of 0.0122 (i.e., statistically significant difference for both frequency-domain DCA indexes). These results are consistent qualitatively with those reported previously in the transfer function analysis literature for impaired cerebral autoregulation (i.e., larger VLF-to-LF gain ratio and smaller average phase sum).
Dynamic vasomotor reactivity indexes.
Using the kernel estimates for the ETCO2 input, we define the model-based dynamic vasomotor reactivity (DVR) index as we did in our previous studies (32, 33), i.e., as the time average of the model-predicted CBFV response to a unit-step change of the ETCO2 input over the first 5 s while the ABP input is kept at zero. This definition is based on the view that the DVR index should quantify the regulatory action that increases the CBFV response to a unit-step increase of ETCO2 stimulus. The model-predicted CBFV responses are shown in Fig. 5 for the average kernels of HP and CS. It is evident that the average responses are different over all lags (positive for CS but negative for HP over the first 15 s) and the steady-state response is lower for HP. The mean (SD) DVR index values are −0.116 (0.206) for HP vs. 0.017 (0.151) for CS, corresponding to a P value of 0.0173 (i.e., statistically significant difference).
Fig. 5.
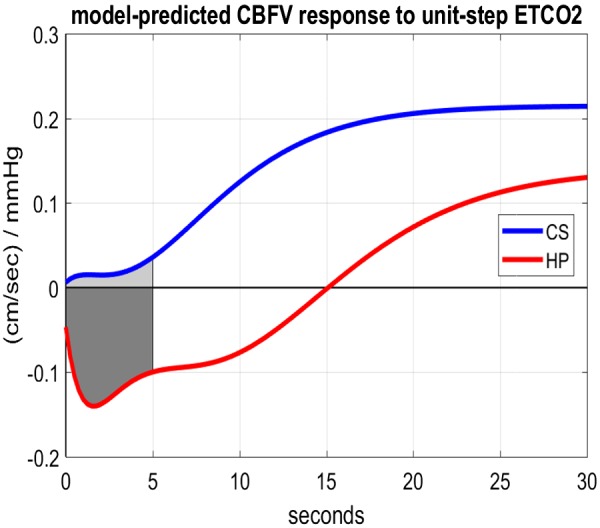
Model-predicted cerebral blood flow velocity (CBFV) responses to a unit-step increase of the end-tidal CO2 (ETCO2) input, while the arterial blood pressure input is kept at zero, for the average kernels of 20 control subjects (CS) and 24 hypertensive patients (HP). The dynamic vasomotor reactivity index is the average response value over the shaded areas.
Principal dynamic mode analysis.
The four global principal dynamic modes (PDMs) obtained using the kernels of the 20 CS are shown in Figs. 6 and 7 (in both time and frequency domains) for the ABP and ETCO2 inputs, respectively. We observe that the global PDMs exhibit distinctive spectral characteristics in the form of resonant peaks that may attain importance for the physiological interpretation of the PDM-based model and the formulation of mechanistic hypotheses in future studies regarding the pathogenesis of hypertension (see discussion). For instance, the frequency-domain representations of the PDMs of the ABP input (Fig. 6, right) indicate that the first PDM has the high-pass characteristic of the well-known windkessel model of passive hemodynamics (63) whereas the second and third PDMs exhibit resonant peaks around 0.2 Hz and 0.1 Hz, respectively, possibly related to active mechanisms of cerebral autoregulation (see discussion). The fourth PDM exhibits a low-pass integrative characteristic, with a fast and a slow component.
Fig. 6.

The 4 global principal dynamic modes (PDMs) of the arterial blood pressure (ABP)-to-cerebral blood flow velocity hemodynamic model in the time domain (left) and the frequency domain (right). They were obtained via singular value decomposition of the rectangular matrix with columns the kernels of the 20 control subjects (see appendix).
Fig. 7.

The 4 global principal dynamic modes (PDMs) of the end-tidal CO2 (ETCO2)-to-cerebral blood flow velocity hemodynamic model in the time domain (left) and the frequency domain (right). They were obtained via singular value decomposition of the rectangular matrix with columns the kernels of the 20 control subjects (see appendix).
In the case of the ETCO2 input, the frequency-domain representations of the PDMs (Fig. 7, right) indicate that the first PDM has two resonant peaks around 0.02 Hz and 0.12 Hz whereas the second and fourth PDMs exhibit resonant peaks around 0.04 Hz, possibly related to the chemoreflex (see discussion). The third PDM exhibits a strong low-pass integrative characteristic and a mild resonance around 0.08 Hz.
Using these global PDMs, we can estimate the PDM gain coefficients {Aj} and {Cm}, according to Eq. 2, and examine whether there are significant group differences between CS and HP in terms of each of these PDM gains. The obtained mean (SD) values of the estimated gain coefficients {Aj} for each PDM contribution to the model output prediction due to the ABP input, according to Eq. 2, are given in Table 2, along with the corresponding P values of a t test. We see that the gain coefficients of the second and third PDMs are significantly different in HP versus CS (P < 0.05); in fact, the group mean switches sign between CS and HP. This finding offers the valuable prospect of potential physiological interpretation in future studies of the mechanisms captured by these PDMs with regard to the effects of essential hypertension on cerebral autoregulation (see discussion).
Table 2.
Mean (SD) estimated gain coefficient {Aj} of PDM contributions to model-predicted output due to ABP input for CS vs. HP
| Gain of PDM 1 for ABP Input |
Gain of PDM 2 for ABP Input |
Gain of PDM 3 for ABP Input |
Gain of PDM 4 for ABP Input |
|||||
|---|---|---|---|---|---|---|---|---|
| 20 CS | 24 HP | 20 CS | 24 HP | 20 CS | 24 HP | 20 CS | 24 HP | |
| Mean (SD) | 2.6905 (1.1098) | 2.5008 (1.0614) | 0.1124 (0.3851) | −0.1828 (0.5261) | −0.0044 (0.1622) | 0.1531 (0.2826) | −0.0113 (0.1396) | −0.0613 (0.1032) |
| P | 0.5679 | 0.0379 | 0.0263 | 0.1928 | ||||
ABP, arterial blood pressure; CS, control subjects; HP, hypertensive patients; PDM, principal dynamic mode. Significant P values are in boldface.
The obtained mean (SD) values of the estimated gain coefficients {Cm} for each PDM contribution to the model output prediction due to the ETCO2 input, according to Eq. 2, are given in Table 3, along with the corresponding P values of a t test. We see that only the gain coefficients of the first PDM are significantly different in HP versus CS (P = 0.005) and the group mean switches sign between CS and HP. This finding offers the valuable prospect of identifying in future studies the physiological mechanism for the impairment of DVR by essential hypertension, if the physiological origin of the affected PDM can be found (see discussion).
Table 3.
Mean (SD) estimated gain coefficient {Cm} of PDM contributions to model-predicted output due to ETCO2 input for CS vs. HP
| Gain of PDM 1 for ETCO2 Input |
Gain of PDM 2 for ETCO2 Input |
Gain of PDM 3 for ETCO2 Input |
Gain of PDM 4 for ETCO2 Input |
|||||
|---|---|---|---|---|---|---|---|---|
| 20 CS | 24 HP | 20 CS | 24 HP | 20 CS | 24 HP | 20 CS | 24 HP | |
| Mean (SD) | 0.0630 (0.2735) | −0.2336 (0.388) | −0.0497 (0.2041) | −0.1242 (0.2346) | 0.0643 (0.1257) | 0.1131 (0.2829) | 0.0314 (0.1265) | 0.0169 (0.1853) |
| P | 0.0050 | 0.2660 | 0.4532 | 0.7609 | ||||
CS, control subjects; ETCO2, end-tidal CO2; HP, hypertensive patients; PDM, principal dynamic mode. Significant P value is in boldface.
We note that all relevant indexes/statistics for left and right TCD were computed separately and compared for significant differences, but none was found (P > 0.2 for all left vs. right statistical comparisons). Thus we used the average of left and right values for each HP or CS in our final analysis. Box plots of the obtained DCA (gain ratio and phase sum) and DVR indexes are shown in Fig. 8.
Fig. 8.

Box plots of the obtained dynamic cerebral autoregulation (DCA) and dynamic vasomotor reactivity (DVR) indexes for the 20 control subjects (CS) and 24 hypertensive patients (HP). Left: gain-ratio DCA indexes. Center: phase-sum DCA indexes. Right: DVR indexes. CBFV, cerebral blood flow velocity.
The “area under the curve” (AUC) of the respective receiver operating curves for the three indexes (gain-ratio DCA, phase-sum DCA, DVR), as well as their sensitivity, specificity, and accuracy for judicious choice of thresholds, are given in Table 4.
Table 4.
Area under the curve, sensitivity, specificity, and accuracy of the three indexes
| Gain-Ratio DCA Index | Phase-Sum DCA Index | DVR Index | |
|---|---|---|---|
| Area under the curve | 0.69 | 0.71 | 0.72 |
| Sensitivity | 0.67 | 0.71 | 0.71 |
| Specificity | 0.75 | 0.75 | 0.75 |
| Accuracy | 0.70 | 0.73 | 0.73 |
DCA, dynamic cerebral autoregulation; DVR, dynamic vasomotor reactivity.
We also note that statistical analysis by sex of the three indexes (gain-ratio DCA, phase-sum DCA, DVR) revealed that significant difference between CS and HP is due primarily to the male participants, who yield much smaller P values than their female counterparts. This may be due to the fact that the number of female CS and HP was small (n = 9 and n = 8, respectively) and two of the female HP were not on antihypertensive medication. This result was not altered when we controlled for age and sex through regression analysis.
DISCUSSION
The main findings of this study are the significant differences in dynamic cerebral autoregulation (DCA) and dynamic vasomotor reactivity (DVR) between hypertensive patients (HP) and normotensive control subjects (CS) (P < 0.05). These findings were enabled by the quantification of DCA and DVR via model-based indexes that were computed with the aid of predictive dynamic models obtained by novel analysis of time series hemodynamic data. Specifically, linear input-output models of the dynamic relationship between the putative “output” of beat-to-beat cerebral blood flow velocity (CBFV) data and two putative “inputs” of beat-to-beat arterial blood pressure (ABP) and breath-to-breath end-tidal CO2 (ETCO2) were obtained via the novel modeling methodology of principal dynamic modes (PDMs) that has been shown to yield robust model estimates for very noisy and relatively short data sets (29–33). The obtained input-output predictive model for each of the 24 HP and 20 CS was used to predict the individual CBFV response to a unit-step change of the ABP or ETCO2 input (while the other input is kept at zero) and compute the model-based DCA or DVR index, respectively, from the resulting model-predicted responses, as summarized below.
Model-based DCA index in hypertension.
The model-based definition of a DCA index may rely either on the time-domain or the frequency-domain representation of the estimated model kernel for each subject. Since our data-based models are defined by the time-domain estimates of the respective kernels, it is natural to consider first time-domain definitions of a DCA index. Our investigation revealed that a time-domain DCA index, defined as the difference of the step response value at 3-s lag minus the value at 8-s lag to quantify the slow dynamics of this process that show the greatest average discrepancy between HP and CS, can delineate the HP group from the CS group (P = 0.0087). This time-domain DCA index performs better than the most widely used time-domain DCA index, the “auto-regulation index” (ARI) derived from our dynamic models of spontaneous data, which was not able to differentiate between HP and CS (P > 0.05), perhaps because of the different type of data used in this study (i.e., spontaneous) versus the thigh cuff-induced data used for the development of the ARI. Nonetheless, our novel time-domain DCA index definition is unusual and may not be readily acceptable by the peer community. Since frequency-domain approaches, using transfer function estimates, have been used extensively in previous studies of DCA (5, 37–41, 46, 56, 59, 64–67), we explored two frequency-domain definitions of DCA indexes that are suggested by the obtained average transfer function estimates (see Fig. 4): 1) the ratio of the average gain function over the frequency range 0.02–0.07 Hz to the average gain function over the frequency range 0.07–0.15 Hz (termed the gain-ratio DCA index) and 2) the average of the phase function over the frequency range 0.07–0.15 Hz (termed the phase-sum DCA index), which can delineate HP from CS (P = 0.0234 and P = 0.0122, respectively). The definitions of the frequency-domain indexes are consistent with observations made in previous work utilizing transfer function estimates for the study of cerebral autoregulation in hypertension, which reported increased ratio of the average transfer function gain for low to high frequencies, as well as reduced average transfer function phase for high frequencies in hypertensive patients (5, 37, 38, 46, 57, 64–66). However, those previous results did not rise to the same level of statistical significance in hypertension as reported here, perhaps because of lower accuracy of the methods used previously for the estimation of the transfer function. The proposed two frequency-domain DCA indexes may address the long-standing “quandary of quantification” for DCA assessment (54), if confirmed in larger cohorts, and can also be used in combination, as a unifying and reproducible metric of DCA.
Model-based DVR index in hypertension.
The model-based DVR index follows the time-domain definition (i.e., time average of the model-predicted CBFV response to a unit-step ETCO2 change over the first 5 s) that was used in our previous studies of mild cognitive impairment (MCI), which indicated significant impairment of DVR in MCI (33). As evidenced in Fig. 5, the average CBFV response to a unit-step ETCO2 change in CS is positive and rises over time, consistent with the fundamental property of CO2 vasomotor reactivity under normal conditions that has been documented in multiple physiological studies. However, the respective response of the HP is negative for the first 15 s and rises gradually over time to reach a lower steady-state level than CS. This indicates a significant impairment in the ability of HP to increase cerebral flow in response to CO2 elevation in the blood to the extent expected under normal conditions. This may have long-term effects upon the normal cognitive function due to inability to provide adequate oxygen and metabolic support for the normal function of the neurons and astrocytes, as posited in our previous MCI studies (33). We note that the observed average deficit in the steady-state CBFV response of HP in this study is only about one-third of the deficit observed in our previous study of MCI patients.
The observed impairment of DVR in HP may be due to dysregulation of the chemoreflex (either the central or the peripheral branch) or dysfunction of the neurovascular coupling that provides localized regulation of arterial/arteriolar diameters and of the biochemical microenvironment in the perivascular space under the active surveillance of the astrocytes. The drastic change of the average ETCO2 kernel by hypertension in the early lags < 2 s (see Fig. 2, right) suggests that the observed DVR impairment may be caused primarily by a malfunction of the chemoreflex peripheral branch (which is faster because of its neural constitution). This important, but complex, issue deserves attention in future studies. With regard to possible dysfunction of the neurovascular coupling contributing to the observed negative DVR index, we note that there is experimental evidence in the neurovascular coupling literature (11) that a large rise in extracellular K+ in the perivascular space adjacent to astrocytic endfeet causes a transition from vasodilation to vasoconstriction in response to astrocytic calcium waves, when this rise exceeds a critical level (~20 mM in mice, with maximum vasodilation seen around 8 mM). This critical level corresponds to the K+ concentration at which the K+ equilibrium potential equals the smooth muscle membrane potential. Since the transition between vasodilation and vasoconstriction is governed by the astrocytic endfoot calcium and extracellular potassium (which are, in turn, dependent upon the proper function of the large-conductance K channels of the astrocytes and the inward-rectifying K channels of the perivascular smooth muscle membrane), we posit that a plausible hypothesis for explaining this counterintuitive finding could be that some long-lasting alteration in the perivascular microenvironment, possibly caused by a “subclinical” chronic condition (e.g., chronic hypoxia or chronic acidosis, or even chronic inflammation), may induce a large rise in extracellular K+ in the perivascular space and, consequently, a reversal of polarity in CO2 vasomotor reactivity. This reversal of polarity may also be caused by subarachnoid hemorrhage (43) or by significant increase of free radical species in the perivascular space that impede the vasodilatory action of nitric oxide, as reported by Tong et al. in References 53 and 54, where this reversal is described during oxidative stress and perivascular inflammation in mouse models of cerebrovascular disease or vascular cognitive impairment and dementia.
Specificity of the model-based DCA and DVR indexes.
The key question arises regarding the specificity of the obtained DCA and DVR indexes as potential diagnostic physiomarkers for hypertension. This question can only be answered through similar analysis of data from other pathologies (e.g., cardiovascular disease, diabetes, stroke, small-vessel disease, white matter disease, cognitive impairment, dementia, etc.) and comparison of the respective indexes that are defined in the same manner. We note that such a study has taken place in amnestic MCI patients and the results indicated significantly impaired DVR (more severe than in hypertension) but no significant change in DCA (33). A similar study examined a cohort of mixed MCI patients with hypertension and executive dysfunction, yielding impaired DVR but no DCA impairment (12). An earlier pilot study of Alzheimer’s disease patients (with a very small cohort) also indicated very severe impairment of DVR (31). On the basis of these limited results to date, we can see that essential hypertension (without cognitive impairment) is associated with impaired DVR and impaired DCA whereas MCI is only associated with impaired DVR. This may not prove adequate to ensure diagnostic specificity when more pathologies become explored (e.g., stroke, diabetes, cerebrovascular disease, etc.), but the additional use of the PDM gain coefficients (see Tables 2 and 3) may provide the means for adequate specificity as an adjunct diagnostic physiomarker and a functional measure of specific physiological mechanisms (see below).
Physiological mechanisms of cerebral autoregulation.
Although the precise physiological mechanisms responsible for cerebral autoregulation are not known, considerable attention has been given to the myogenic reflex, because of the widely observed ABP kernel undershoot (the negative area between 0.5-s and 4-s lag) that is evident in the average kernels in Fig. 2, left, which causes the reduction of the CBFV response to a unit-step ABP change after an initial peak (see Fig. 3). The myogenic reflex is triggered by intraluminal blood pressure surges and is mediated by stretch-sensitive mechanoreceptors in the lumen wall that initiate a sequence of biochemical events leading to calcium influx into the perivascular smooth muscle and causing vasoconstriction within a few seconds (45, 49). However, there are a multitude of other endothelium-secreted molecules (paracrine regulation) that can cause vasodilation (e.g., nitric oxide and prostacyclin) or vasoconstriction (e.g., endothelin), which are also triggered by changes in intraluminal pressure and/or flow shear stress at the lumen wall (25, 61) and therefore may contribute to the observed differences in the average unit-step CBFV responses of CS versus HP (see Fig. 3).
Previous studies have generally classified the multitude of physiological factors influencing DCA into two categories: direct (myogenic, endothelial, autonomic), which exert their effects directly on the pressure-flow relationship, and indirect (neurovascular, metabolic, endocrine), which exert their effects indirectly through modulation of the pressure-flow relationship. Delineation of these multiple regulatory mechanisms is required to avoid ambiguity in interpretation of results. The study of DCA pertains primarily to the aforementioned direct regulatory mechanisms, although the modulatory influence of the indirect regulatory mechanisms may be significant. Among these indirect regulatory mechanisms, one that has received considerable attention (because of its significant impact on cerebrovascular impedance) is the CO2 vasomotor reactivity driven by changes in blood CO2 tension. For this reason, a proxy of the latter physiological variable [end-tidal CO2 (ETCO2)] is used as a second input to the model generating the CBFV signal in this study. Therefore, the reported ABP kernels are not expected to be affected by changes in blood CO2 tension and offer a more reliable measure of cerebral autoregulation to changes in blood pressure.
Another important class of indirect regulatory mechanisms pertains to the actions of the autonomic nervous system (through both adrenergic and cholinergic nerve fibers) that is triggered by blood pressure changes (via the baroreflex) or by blood CO2 changes (via the chemoreflex). Both modulate the heart rate and can have significant impact on the vascular impedance (i.e., resistance and compliance together) through direct innervation of the perivascular smooth muscle of arteries/arterioles (13, 20, 50, 52, 67). Sympathetic nerve fibers are also thought to increase the vascular tone in cerebral arteries and arterioles in order to keep the average cerebral perfusion pressure below the upper limit of the static autoregulatory plateau, whereas parasympathetic nerve fibers are thought to be active in playing a protective role in acute hypotension. Inhibition of sympathetic nerve fibers was found to reduce cerebral perfusion pressure and help prevent disruption of the blood-brain barrier during acute hypertension (67). The cerebral vasomotor reactivity to CO2 has also been found to be affected by essential hypertension (12, 27, 46, 47), possibly because of an interaction between the autonomic mechanisms of the baroreflex and the chemoreflex in hypertension. Some interesting hypotheses about the role of the autonomic nervous system in regulating cerebral perfusion during changes in blood pressure (cerebral autoregulation) and blood CO2 tension (vasomotor reactivity), under normotensive and hypertensive conditions, are discussed below in the context of PDM analysis.
PDM analysis of cerebral flow regulation in hypertension.
We posit that PDM analysis may facilitate the challenging task of delineating the various DCA and DVR physiological mechanisms. Obviously, this will not be an easy task and will require efforts that are both creative and persistent. To commence our efforts to interpret the obtained PDMs physiologically, we studied a mechanism-based structural hemodynamic model (15, 16), based on the seminal work of Ursino et al. (58), that yielded PDMs from simulated data (for typical parameter values of the simulated structural model) that are similar to the PDMs obtained from the actual experimental data and shown in Figs. 6 and 7. The study of the structural model indicated a cubic nonlinearity associated with the third PDM for very large ABP changes, which exhibits a midrange plateau akin to the homeostatic plateau of Lassen’s curve describing the steady-state blood pressure-flow relation in static cerebral autoregulation (16). When this observation is combined with the findings of Hamner and Tan (13), who concluded, based on ganglionic and calcium channel blockages, that the adrenergic mechanisms of sympathetic activity are active in the main autoregulatory region (the plateau of Lassen’s curve), then the suggestion arises that the third PDM may be related to α-adrenergic sympathetic fibers. This suggestion is consistent with the current hypothesis of “sympathetic hyperactivity” as a major cause of essential hypertension (the other major cause being the intrarenal renin-angiotensin system), which causes increased cardiac output and larger vascular resistance. Our analysis shows that sympathetic hyperactivity (under the hypothesis that it is related to the 3rd PDM) reduces the trough of the ABP kernel (the positive lobe of the 3rd PDM between 0 and 3-s lag) and introduces a late shallow trough between 3- and 8-s lag (see Fig. 6, left). We note that the HP have a significantly larger third PDM gain (see Table 2), corresponding to the observed changes in the HP kernel (see Fig. 2).
The other significant change in HP concerns the polarity of the second PDM gain (see Table 2), which causes a reduction in the early response peak and in the kernel trough (see Fig. 6, left), consistent with the observed difference in the obtained average CBFV responses for CS and HP (see Fig. 3). The second PDM exhibits a resonant peak around 0.2 Hz (see Fig. 6, right) and may be related to cholinergic nerve fibers—an intriguing hypothesis that must be tested in the future. This hypothesis is supported by the findings of the structural model PDMs (16), whereby the second PDM exhibited a parabolic nonlinearity that would be consistent with the finding in Reference 13 that the cholinergic contribution increases the rising slope and the gain of the autoregulatory plateau of Lassen’s curve as well as with the observation that the cholinergic component serves a protective role against hypotension (i.e., extending the autoregulatory plateau). This hypothesis is also consistent with the recent report that acetylcholinesterase inhibitors benefit vascular dysfunction in spontaneously hypertensive rats (26). Finally, we note that the first PDM (which is dominant in the ABP-to-CBFV dynamic relation) exhibits dynamics consistent with the windkessel model of passive cerebral flow (66).
The study of the structural model also revealed that the reduced trough of the ABP kernel is associated with a decrease in the autoregulatory gain parameter of DCA in the model, which is related to the baroreflex action upon the cerebral vasculature (15, 16). The effects of possible impairment of the baroreflex upon DCA can be examined in the future through an input-output modeling study of the dynamic effects of ABP changes on the heart rate.
With regard to the PDMs of the ETCO2 kernel (see Fig. 7), the only significant difference between HP and CS was found in the gain of the first PDM (see Table 3). The latter exhibits all positive values, with an early (lags < 2 s) and a late (see Fig. 7, left) component. Our results show a reversal of polarity of first PDM gain from positive for CS to negative for HP. This is consistent with the ETCO2 average kernel differences seen in Fig. 2. It is tempting to hypothesize that the early component of the ETCO2 kernel (for CS) is due to the fast-acting peripheral chemoreflex, while the late component may be due to the slower central chemoreflex (acting through diffusion). Under this hypothesis, the observed kernel difference between HP and CS would be due to impairment of the peripheral chemoreflex. This hypothesis can be tested in future studies. Such physiological interpretations of the obtained PDMs may be useful in advancing our scientific understanding of the effects of hypertension on DCA and DVR.
Limitations of this study.
Limitations of this study include the limited size of the cohort and the possible effects of medications taken by the HP to control their essential hypertension.
Conclusions.
We have introduced a robust methodology for the model-based quantification of dynamic cerebral autoregulation (DCA) and dynamic vasomotor reactivity (DVR) of cerebral perfusion using 5-min spontaneous hemodynamic time series data under resting conditions. The obtained model-based DCA and DVR indexes can be viewed as physiomarkers regarding the DCA and DVR characteristics of each control subject or patient.
Using these physiomarkers for a cohort of 24 patients with essential hypertension and 20 normotensive control subjects, we found significant differences in DCA and DVR (P < 0.05) between patients and control subjects. Furthermore, the employed model estimation methodology of principal dynamic modes (PDMs) revealed that three PDMs (2 related to DCA and 1 related to DVR) have significantly different gain coefficients (P < 0.05), indicating that essential hypertension has adverse effects upon the physiological mechanisms that correspond to those PDMs. We posit that these mechanisms pertain to adrenergic and cholinergic dysfunction in cerebral autoregulation (possibly via the baroreflex) and to the peripheral chemoreflex. The identification of the latter mechanisms is an important goal of future studies using PDM analysis.
GRANTS
This work was supported in part by the Biomedical Simulations Resource at the University of Southern California under NIH Grant P41 EB-001978.
DISCLOSURES
No conflicts of interest, financial or otherwise, are declared by the authors.
AUTHOR CONTRIBUTIONS
V.Z.M. and M.M. conceived and designed research; M.O. and M.M. performed experiments; V.Z.M. and D.C.S. analyzed data; V.Z.M. and M.M. interpreted results of experiments; D.C.S. prepared figures; V.Z.M. drafted manuscript; V.Z.M. and M.M. edited and revised manuscript; V.Z.M. approved final version of manuscript.
APPENDIX: OUTLINE OF PDM-BASED INPUT-OUTPUT MODELING METHODOLOGY
The mathematical foundations of the advocated PDM-based modeling methodology are found in the general Volterra–Wiener theories of input-output nonlinear system identification (applicable to all finite-memory stationary dynamic systems) and their elaborations over the last 50 years (29). For the present study, this methodology is placed in the context of linear models of the cerebral hemodynamic system expressing the output signal of cerebral blood flow velocity (CBFV), measured at the middle cerebral arteries, in terms with two time series input signals (ABP: beat-to-beat arterial blood pressure and ETCO2: breath-to-breath end-tidal CO2). If we denote the output CBFV signal as y(t) and the two input signals, ABP and ETCO2, as p(t) and x(t), respectively, then the general linear predictive dynamic has the form
| (A1) |
The dynamic characteristics of this model are described by the kernels kp and kx, which are estimated from the given input-output data (along with the zero-order kernel k0), by means of Laguerre expansions of the kernels (29):
| (A2) |
where denotes the orthogonal Laguerre basis for the ith input. These kernel expansions transform the input-output relation Eq. A1 to Eq. A3, which involves linearly the Laguerre expansion coefficients:
| (A3) |
where
| (A4) |
Since the Laguerre expansion coefficients enter linearly in the input-output model of Eq. A3, their estimation can be achieved via least-squares regression (a simple and robust numerical procedure). After estimation of the Laguerre expansion coefficients, we can construct the Volterra kernel estimates with Eq. A2 and compute the model prediction for any given input with Eq. 1 or Eq. 3. Key parameters in the application of the Laguerre expansion technique are the number of employed Laguerre basis functions L, as well as the Laguerre parameter “alpha” that defines the relaxation dynamics of these Laguerre functions for each input. These parameters are selected on the basis of a search procedure that seeks to minimize the Bayesian information criterion that takes into account the normalized mean-square error (NMSE) of the model prediction and the number of free parameters in the respective model. This search procedure yielded L = 4 for both inputs and Laguerre parameter alpha of 0.55 and 0.85 for the ABP and ETCO2 inputs, respectively.
To compact the model representation and facilitate physiological interpretation of the obtained model, we have introduced the concept of principal dynamic modes (PDMs), which aims at identifying the minimum set of basis functions for each input (distinct and characteristic for each system) that is capable of representing adequately the system dynamics (29–33). The computation of the PDMs for each input is based on singular value decomposition (SVD) of a rectangular matrix that is composed of all kernel estimates in the cohort. The resulting PDMs form a filter bank that receives the respective input signal and generates (via convolution) signals that subsequently form the model output via linear regression (see below).
Thus the linear PDM-based model takes the form
| (A5) |
where {uj} and {zm} are the PDM outputs for the ABP and ETCO2 inputs, respectively, and {Aj} and {Cm} are the scalar “gains” associated with each PDM output. These gains are estimated, along with k0, via least-squares regression of Eq. A5. The term “global PDMs” is used to denote the PDMs extracted from the data of the control subjects, which are used subsequently to analyze all data (for each patient and control subject). Four global PDMs were found to be appropriate for each input in this study.
REFERENCES
- 1.Aaslid R, Lindegaard KF, Sorteberg W, Nornes H. Cerebral autoregulation dynamics in humans. Stroke 20: 45–52, 1989. doi: 10.1161/01.STR.20.1.45. [DOI] [PubMed] [Google Scholar]
- 2.Birns J, Jarosz J, Markus HS, Kalra L. Cerebrovascular reactivity and dynamic autoregulation in ischaemic subcortical white matter disease. J Neurol Neurosurg Psychiatry 80: 1093–1098, 2009. doi: 10.1136/jnnp.2009.174607. [DOI] [PubMed] [Google Scholar]
- 3.Carretero OA, Oparil S. Essential hypertension. Part I: definition and etiology. Circulation 101: 329–335, 2000. doi: 10.1161/01.CIR.101.3.329. [DOI] [PubMed] [Google Scholar]
- 4.Claassen JA, Levine BD, Zhang R. Cerebral vasomotor reactivity before and after blood pressure reduction in hypertensive patients. Am J Hypertens 22: 384–391, 2009. doi: 10.1038/ajh.2009.2. [DOI] [PubMed] [Google Scholar]
- 5.Claassen JA, Meel-van den Abeelen AS, Simpson DM, Panerai RB; International Cerebral Autoregulation Research Network (CARNet) . Transfer function analysis of dynamic cerebral autoregulation: a white paper from the International Cerebral Autoregulation Research Network. J Cereb Blood Flow Metab 36: 665–680, 2016. doi: 10.1177/0271678X15626425. [DOI] [PMC free article] [PubMed] [Google Scholar]
- 6.Claassen JA, Zhang R. Cerebral autoregulation in Alzheimer’s disease. J Cereb Blood Flow Metab 31: 1572–1577, 2011. doi: 10.1038/jcbfm.2011.69. [DOI] [PMC free article] [PubMed] [Google Scholar]
- 7.Dawson SL, Blake MJ, Panerai RB, Potter JF. Dynamic but not static cerebral autoregulation is impaired in acute ischaemic stroke. Cerebrovasc Dis 10: 126–132, 2000. doi: 10.1159/000016041. [DOI] [PubMed] [Google Scholar]
- 8.Eames PJ, Blake MJ, Panerai RB, Potter JF. Cerebral autoregulation indices are unimpaired by hypertension in middle aged and older people. Am J Hypertens 16: 746–753, 2003. doi: 10.1016/S0895-7061(03)00947-6. [DOI] [PubMed] [Google Scholar]
- 9.Elias MF, Goodell AL, Dore GA. Hypertension and cognitive functioning: a perspective in historical context. Hypertension 60: 260–268, 2012. doi: 10.1161/HYPERTENSIONAHA.111.186429. [DOI] [PubMed] [Google Scholar]
- 10.Faraco G, Iadecola C. Hypertension: a harbinger of stroke and dementia. Hypertension 62: 810–817, 2013. doi: 10.1161/HYPERTENSIONAHA.113.01063. [DOI] [PMC free article] [PubMed] [Google Scholar]
- 11.Girouard H, Bonev AD, Hannah RM, Meredith A, Aldrich RW, Nelson MT. Astrocytic endfoot Ca2+ and BK channels determine both arteriolar dilation and constriction. Proc Natl Acad Sci USA 107: 3811–3816, 2010. doi: 10.1073/pnas.0914722107. [DOI] [PMC free article] [PubMed] [Google Scholar]
- 12.Hajjar I, Marmarelis V, Shin DC, Chui H. Assessment of cerebrovascular reactivity during resting state breathing and its correlation with cognitive function in hypertension. Cerebrovasc Dis 38: 10–16, 2014. doi: 10.1159/000365349. [DOI] [PMC free article] [PubMed] [Google Scholar]
- 13.Hamner JW, Tan CO. Relative contributions of sympathetic, cholinergic, and myogenic mechanisms to cerebral autoregulation. Stroke 45: 1771–1777, 2014. doi: 10.1161/STROKEAHA.114.005293. [DOI] [PMC free article] [PubMed] [Google Scholar]
- 14.Haubrich C, Kruska W, Diehl RR, Möller-Hartmann W, Klötzsch C. Dynamic autoregulation testing in patients with middle cerebral artery stenosis. Stroke 34: 1881–1885, 2003. doi: 10.1161/01.STR.0000080936.36601.34. [DOI] [PubMed] [Google Scholar]
- 15.Henley BC, Shin DC, Zhang R, Marmarelis VZ. Compartmental and data-based modeling of cerebral hemodynamics: linear analysis. IEEE Access 3: 2317–2332, 2015. doi: 10.1109/ACCESS.2015.2492945. [DOI] [PMC free article] [PubMed] [Google Scholar]
- 16.Henley BC, Shin DC, Zhang R, Marmarelis VZ. Compartmental and data-based modeling of cerebral hemodynamics: nonlinear analysis. IEEE Trans Biomed Eng 64: 1078–1088, 2017. doi: 10.1109/TBME.2016.2588438. [DOI] [PMC free article] [PubMed] [Google Scholar]
- 17.Iadecola C. Neurovascular regulation in the normal brain and in Alzheimer’s disease. Nat Rev Neurosci 5: 347–360, 2004. doi: 10.1038/nrn1387. [DOI] [PubMed] [Google Scholar]
- 18.Immink RV, van den Born BJ, van Montfrans GA, Koopmans RP, Karemaker JM, van Lieshout JJ. Impaired cerebral autoregulation in patients with malignant hypertension. Circulation 110: 2241–2245, 2004. doi: 10.1161/01.CIR.0000144472.08647.40. [DOI] [PubMed] [Google Scholar]
- 19.Jiménez-Balado J, Riba-Llena I, Abril O, Garde E, Penalba A, Ostos E, Maisterra O, Montaner J, Noviembre M, Mundet X, Ventura O, Pizarro J, Delgado P. Cognitive impact of cerebral small vessel disease changes in patients with hypertension. Hypertension 73: 342–349, 2019. doi: 10.1161/HYPERTENSIONAHA.118.12090. [DOI] [PubMed] [Google Scholar]
- 20.Julien C. The enigma of Mayer waves: facts and models. Cardiovasc Res 70: 12–21, 2006. doi: 10.1016/j.cardiores.2005.11.008. [DOI] [PubMed] [Google Scholar]
- 21.Köhler S, Baars MA, Spauwen P, Schievink S, Verhey FR, van Boxtel MJ. Temporal evolution of cognitive changes in incident hypertension: prospective cohort study across the adult age span. Hypertension 63: 245–251, 2014. doi: 10.1161/HYPERTENSIONAHA.113.02096. [DOI] [PubMed] [Google Scholar]
- 22.Kolb B, Rotella DL, Stauss HM. Frequency response characteristics of cerebral blood flow autoregulation in rats. Am J Physiol Heart Circ Physiol 292: H432–H438, 2007. doi: 10.1152/ajpheart.00794.2006. [DOI] [PubMed] [Google Scholar]
- 23.Lackland DT, Weber MA. Global burden of cardiovascular disease and stroke: hypertension at the core. Can J Cardiol 31: 569–571, 2015. doi: 10.1016/j.cjca.2015.01.009. [DOI] [PubMed] [Google Scholar]
- 24.Lassen NA. Autoregulation of cerebral blood flow. Circ Res 15, Suppl: 201–204, 1964. [PubMed] [Google Scholar]
- 25.Lavi S, Egbarya R, Lavi R, Jacob G. Role of nitric oxide in the regulation of cerebral blood flow in humans: chemoregulation versus mechanoregulation. Circulation 107: 1901–1905, 2003. doi: 10.1161/01.CIR.0000057973.99140.5A. [DOI] [PubMed] [Google Scholar]
- 26.Lataro RM, Silva MA, Mestriner FL, Cau SB, Tostes RC, Salgado HC. Chronic treatment with acetylcholinesterase inhibitors attenuates vascular dysfunction in spontaneously hypertensive rats. Am J Hypertens 32: 579–587, 2019. doi: 10.1093/ajh/hpz036. [DOI] [PubMed] [Google Scholar]
- 27.Lipsitz LA, Iloputaife I, Gagnon M, Kiely DK, Serrador JM. Enhanced vasoreactivity and its response to antihypertensive therapy in hypertensive elderly women. Hypertension 47: 377–383, 2006. doi: 10.1161/01.HYP.0000202595.69583.42. [DOI] [PMC free article] [PubMed] [Google Scholar]
- 28.Lipsitz LA, Mukai S, Hamner J, Gagnon M, Babikian V. Dynamic regulation of middle cerebral artery blood flow velocity in aging and hypertension. Stroke 31: 1897–1903, 2000. doi: 10.1161/01.STR.31.8.1897. [DOI] [PubMed] [Google Scholar]
- 29.Marmarelis VZ. Nonlinear Dynamic Modeling of Physiological Systems. Hoboken, NJ: Wiley-IEEE Press, 2004. [Google Scholar]
- 30.Marmarelis VZ, Mitsis GD, Shin DC, Zhang R. Multiple-input nonlinear modelling of cerebral haemodynamics using spontaneous arterial blood pressure, end-tidal CO2 and heart rate measurements. Philos Trans A Math Phys Eng Sci 374: 20150180, 2016. doi: 10.1098/rsta.2015.0180. [DOI] [PMC free article] [PubMed] [Google Scholar]
- 31.Marmarelis VZ, Shin DC, Orme ME, Zhang R. Model-based quantification of cerebral hemodynamics as a physiomarker for Alzheimer’s disease? Ann Biomed Eng 41: 2296–2317, 2013. doi: 10.1007/s10439-013-0837-z. [DOI] [PMC free article] [PubMed] [Google Scholar]
- 32.Marmarelis VZ, Shin DC, Orme ME, Zhang R. Model-based physiomarkers of cerebral hemodynamics in patients with mild cognitive impairment. Med Eng Phys 36: 628–637, 2014. doi: 10.1016/j.medengphy.2014.02.025. [DOI] [PMC free article] [PubMed] [Google Scholar]
- 33.Marmarelis VZ, Shin DC, Tarumi T, Zhang R. Comparison of model-based indices of cerebral autoregulation and vasomotor reactivity using transcranial Doppler versus near-infrared spectroscopy in patients with amnestic mild cognitive impairment. J Alzheimers Dis 56: 89–105, 2017. doi: 10.3233/JAD-161004. [DOI] [PMC free article] [PubMed] [Google Scholar]
- 34.Mitsis GD, Poulin MJ, Robbins PA, Marmarelis VZ. Nonlinear modeling of the dynamic effects of arterial pressure and CO2 variations on cerebral blood flow in healthy humans. IEEE Trans Biomed Eng 51: 1932–1943, 2004. doi: 10.1109/TBME.2004.834272. [DOI] [PubMed] [Google Scholar]
- 35.Mitsis GD, Zhang R, Levine BD, Marmarelis VZ. Cerebral hemodynamics during orthostatic stress assessed by nonlinear modeling. J Appl Physiol (1985) 101: 354–366, 2006. doi: 10.1152/japplphysiol.00548.2005. [DOI] [PubMed] [Google Scholar]
- 36.Nicolakakis N, Hamel E. Neurovascular function in Alzheimer’s disease patients and experimental models. J Cereb Blood Flow Metab 31: 1354–1370, 2011. doi: 10.1038/jcbfm.2011.43. [DOI] [PMC free article] [PubMed] [Google Scholar]
- 37.Novak V, Chowdhary A, Farrar B, Nagaraja H, Braun J, Kanard R, Novak P, Slivka A. Altered cerebral vasoregulation in hypertension and stroke. Neurology 60: 1657–1663, 2003. doi: 10.1212/01.WNL.0000068023.14587.06. [DOI] [PubMed] [Google Scholar]
- 38.Novak V, Yang AC, Lepicovsky L, Goldberger AL, Lipsitz LA, Peng CK. Multimodal pressure-flow method to assess dynamics of cerebral autoregulation in stroke and hypertension. Biomed Eng Online 3: 39, 2004. doi: 10.1186/1475-925X-3-39. [DOI] [PMC free article] [PubMed] [Google Scholar]
- 39.Panerai RB. Cerebral autoregulation: from models to clinical applications. Cardiovasc Eng 8: 42–59, 2008. doi: 10.1007/s10558-007-9044-6. [DOI] [PubMed] [Google Scholar]
- 40.Panerai RB, Dawson SL, Potter JF. Linear and nonlinear analysis of human dynamic cerebral autoregulation. Am J Physiol Heart Circ Physiol 277: H1089–H1099, 1999. doi: 10.1152/ajpheart.1999.277.3.H1089. [DOI] [PubMed] [Google Scholar]
- 41.Panerai RB, White RP, Markus HS, Evans DH. Grading of cerebral dynamic autoregulation from spontaneous fluctuations in arterial blood pressure. Stroke 29: 2341–2346, 1998. doi: 10.1161/01.STR.29.11.2341. [DOI] [PubMed] [Google Scholar]
- 42.Panerai RB, Simpson DM, Deverson ST, Mahony P, Hayes P, Evans DH. Multivariate dynamic analysis of cerebral blood flow regulation in humans. IEEE Trans Biomed Eng 47: 419–423, 2000. doi: 10.1109/10.827312. [DOI] [PubMed] [Google Scholar]
- 43.Pappas AC, Koide M, Wellman GC. Astrocyte Ca2+ signaling drives inversion of neurovascular coupling after subarachnoid hemorrhage. J Neurosci 35: 13375–13384, 2015. doi: 10.1523/JNEUROSCI.1551-15.2015. [DOI] [PMC free article] [PubMed] [Google Scholar]
- 44.Reinhard M, Roth M, Guschlbauer B, Harloff A, Timmer J, Czosnyka M, Hetzel A. Dynamic cerebral autoregulation in acute ischemic stroke assessed from spontaneous blood pressure fluctuations. Stroke 36: 1684–1689, 2005. doi: 10.1161/01.STR.0000173183.36331.ee. [DOI] [PubMed] [Google Scholar]
- 45.Schubert R, Mulvany MJ. The myogenic response: established facts and attractive hypotheses. Clin Sci (Lond) 96: 313–326, 1999. doi: 10.1042/cs0960313. [DOI] [PubMed] [Google Scholar]
- 46.Serrador JM, Sorond FA, Vyas M, Gagnon M, Iloputaife ID, Lipsitz LA. Cerebral pressure-flow relations in hypertensive elderly humans: transfer gain in different frequency domains. J Appl Physiol (1985) 98: 151–159, 2005. doi: 10.1152/japplphysiol.00471.2004. [DOI] [PubMed] [Google Scholar]
- 47.Tan CO. Defining the characteristic relationship between arterial pressure and cerebral flow. J Appl Physiol (1985) 113: 1194–1200, 2012. doi: 10.1152/japplphysiol.00783.2012. [DOI] [PMC free article] [PubMed] [Google Scholar]
- 48.Tan CO, Hamner JW, Taylor JA. The role of myogenic mechanisms in human cerebrovascular regulation. J Physiol 591: 5095–5105, 2013. doi: 10.1113/jphysiol.2013.259747. [DOI] [PMC free article] [PubMed] [Google Scholar]
- 49.Tan CO, Taylor JA. Integrative physiological and computational approaches to understand autonomic control of cerebral autoregulation. Exp Physiol 99: 3–15, 2014. doi: 10.1113/expphysiol.2013.072355. [DOI] [PMC free article] [PubMed] [Google Scholar]
- 50.Tantucci C, Bottini P, Fiorani C, Dottorini ML, Santeusanio F, Provinciali L, Sorbini CA, Casucci G. Cerebrovascular reactivity and hypercapnic respiratory drive in diabetic autonomic neuropathy. J Appl Physiol (1985) 90: 889–896, 2001. doi: 10.1152/jappl.2001.90.3.889. [DOI] [PubMed] [Google Scholar]
- 51.Terborg C, Gora F, Weiller C, Röther J. Reduced vasomotor reactivity in cerebral microangiopathy: a study with near-infrared spectroscopy and transcranial Doppler sonography. Stroke 31: 924–929, 2000. doi: 10.1161/01.STR.31.4.924. [DOI] [PubMed] [Google Scholar]
- 52.ter Laan M, van Dijk JM, Elting JW, Staal MJ, Absalom AR. Sympathetic regulation of cerebral blood flow in humans: a review. Br J Anaesth 111: 361–367, 2013. doi: 10.1093/bja/aet122. [DOI] [PubMed] [Google Scholar]
- 53.Tong XK, Nicolakakis N, Kocharyan A, Hamel E. Vascular remodeling versus amyloid beta-induced oxidative stress in the cerebrovascular dysfunctions associated with Alzheimer’s disease. J Neurosci 25: 11165–11174, 2005. doi: 10.1523/JNEUROSCI.4031-05.2005. [DOI] [PMC free article] [PubMed] [Google Scholar]
- 54.Tong XK, Trigiani LJ, Hamel E. High cholesterol triggers white matter alterations and cognitive deficits in a mouse model of cerebrovascular disease: benefits of simvastatin. Cell Death Dis 10: 89, 2019. doi: 10.1038/s41419-018-1199-0. [DOI] [PMC free article] [PubMed] [Google Scholar]
- 55.Traon AP, Costes-Salon MC, Galinier M, Fourcade J, Larrue V. Dynamics of cerebral blood flow autoregulation in hypertensive patients. J Neurol Sci 195: 139–144, 2002. doi: 10.1016/S0022-510X(02)00010-2. [DOI] [PubMed] [Google Scholar]
- 56.Tzeng YC, Ainslie PN, Cooke WH, Peebles KC, Willie CK, MacRae BA, Smirl JD, Horsman HM, Rickards CA. Assessment of cerebral autoregulation: the quandary of quantification. Am J Physiol Heart Circ Physiol 303: H658–H671, 2012. doi: 10.1152/ajpheart.00328.2012. [DOI] [PubMed] [Google Scholar]
- 57.Tzeng YC, Willie CK, Atkinson G, Lucas SJ, Wong A, Ainslie PN. Cerebrovascular regulation during transient hypotension and hypertension in humans. Hypertension 56: 268–273, 2010. doi: 10.1161/HYPERTENSIONAHA.110.152066. [DOI] [PubMed] [Google Scholar]
- 58.Ursino M, Ter Minassian A, Lodi CA, Beydon L. Cerebral hemodynamics during arterial and CO2 pressure changes: in vivo prediction by a mathematical model. Am J Physiol Heart Circ Physiol 279: H2439–H2455, 2000. doi: 10.1152/ajpheart.2000.279.5.H2439. [DOI] [PubMed] [Google Scholar]
- 59.van Beek AH, Claassen JA, Rikkert MG, Jansen RW. Cerebral autoregulation: an overview of current concepts and methodology with special focus on the elderly. J Cereb Blood Flow Metab 28: 1071–1085, 2008. doi: 10.1038/jcbfm.2008.13. [DOI] [PubMed] [Google Scholar]
- 60.Whelton PK, Carey RM, Aronow WS, Casey DE, Collins KJ, Dennison C, DePalma SM, Gidding S, Jamerson KA, Jones DW, MacLaughlin EJ, Muntner P, Ovbiagele B, Smith SC Jr, Spencer CC, Stafford RS, Taler SJ, Thomas RJ, Williams KA Sr, Williamson JD, Wright JT Jr. ACC/AHA/AAPA/ABC/ACPM/AGS/APhA/ASH/ASPC/NMA/PCNA 2017 Guidelines for the prevention, detection, evaluation, and management of high blood pressure in adults. Hypertension 71: 1269–1324, 2018. doi: 10.1161/HYP.0000000000000066. [DOI] [PubMed] [Google Scholar]
- 61.Willie CK, Tzeng YC, Fisher JA, Ainslie PN. Integrative regulation of human brain blood flow. J Physiol 592: 841–859, 2014. doi: 10.1113/jphysiol.2013.268953. [DOI] [PMC free article] [PubMed] [Google Scholar]
- 62.Xiong L, Liu X, Shang T, Smielewski P, Donnelly J, Guo ZN, Yang Y, Leung T, Czosnyka M, Zhang R, Liu J, Wong KS. Impaired cerebral autoregulation: measurement and application to stroke. J Neurol Neurosurg Psychiatry 88: 520–531, 2017. doi: 10.1136/jnnp-2016-314385. [DOI] [PubMed] [Google Scholar]
- 63.Yang SH, Liu Y. Cerebral autoregulation. In: Primer on Cerebrovascular Disease (2nd ed.), edited by Caplan LR, Billler J, Leary MC, Lo EH, Thomas AJ, Yenari M, Zhang JH. London: Academic, 2017, chapt. 10, p. 57–60. [Google Scholar]
- 64.Zhang R, Behbehani K, Levine BD. Dynamic pressure-flow relationship of the cerebral circulation during acute increase in arterial pressure. J Physiol 587: 2567–2577, 2009. doi: 10.1113/jphysiol.2008.168302. [DOI] [PMC free article] [PubMed] [Google Scholar]
- 65.Zhang R, Witkowski S, Fu Q, Claassen JA, Levine BD. Cerebral hemodynamics after short- and long-term reduction in blood pressure in mild and moderate hypertension. Hypertension 49: 1149–1155, 2007. doi: 10.1161/HYPERTENSIONAHA.106.084939. [DOI] [PubMed] [Google Scholar]
- 66.Zhang R, Zuckerman JH, Giller CA, Levine BD. Transfer function analysis of dynamic cerebral autoregulation in humans. Am J Physiol Heart Circ Physiol 274: H233–H241, 1998. doi: 10.1152/ajpheart.1998.274.1.H233. [DOI] [PubMed] [Google Scholar]
- 67.Zhang R, Zuckerman JH, Iwasaki K, Wilson TE, Crandall CG, Levine BD. Autonomic neural control of dynamic cerebral autoregulation in humans. Circulation 106: 1814–1820, 2002. doi: 10.1161/01.CIR.0000031798.07790.FE. [DOI] [PubMed] [Google Scholar]