

Abstract
The vestibular end-organs encode for linear and angular head accelerations in space contributing to our internal representation of self-motion. Activation of the vestibular system with transmastoid electrical current has recently grown in popularity; however, a direct relationship between electrically evoked and mechanically evoked vestibular responses remains elusive in humans. We have developed and tested a mechanical-to-electrical vestibular stimulus conversion model incorporating physiological activation of primary vestibular afferents identified in nonhuman primates. We compared ocular torsional responses between mechanical (chair rotation) and model-derived electrical (binaural-bipolar) stimuli in separate experiments for an angular velocity step change (±10 deg/s over 1 s, ±4-mA peak amplitude; n = 10) and multisine angular velocities (±10 deg/s, 9.7 mA peak to peak, 0.05–1 Hz; n = 5), respectively. Perception of whole body rotation (n = 18) to our step-change stimuli was also evaluated. Ocular torsional slow-phase velocity responses between stimulation types were similar (paired two one-sided tests of equivalence: multiple P < 0.002; one-sample t test: P = 0.178) and correlated (Pearson’s coefficient: multiple P < 0.001). Bootstrap analysis of perceived angular velocity likewise showed similarity in perceptual decay dynamics. These data suggest that central processing between stimuli was similar, and our vestibular stimulus conversion model with a conversion factor of ∼0.4 mA per deg/s for an angular velocity step change can generate electrical stimuli that replicates dynamic vestibular activation elicited by mechanical whole body rotations. This proposed vestibular conversion model represents an initial framework for using electrical stimuli to generate mechanically equivalent activation of primary vestibular afferents for use in biomedical applications and immersive reality technologies.
NEW & NOTEWORTHY With the growing popularity of electrical vestibular stimulation in biomedical and immersive reality applications, a direct conversion model between electrical and mechanical vestibular stimuli is needed. We developed a model to generate electrical stimuli mimicking the physiological activation of vestibular afferents evoked by mechanical rotations. Ocular and perceptual responses evoked by mechanical and model-derived electrical stimuli were similar, thus providing a critical first step toward generation of electrically induced vestibular responses that have a realistic mechanical equivalent.
Keywords: conversion model, electrical vestibular stimulation, motion perception, torsional vestibuloocular reflex, virtual motion
INTRODUCTION
The central nervous system uses sensory cues such as visual, vestibular, and somatosensation to encode an internal representation of self-motion. In the absence of vision, primary vestibular afferents from the otolith and semicircular canal (SCC) end-organs are the predominant encoders of head motion and orientation in space through rate and temporal coding (Jamali et al. 2016; Sadeghi et al. 2007; Schneider et al. 2015). Although the otolith and SCC hair cell receptors are respectively sensitive to linear and angular accelerations of the head in space, electrical current applied over the mastoid processes or directly within the inner ear can also activate the primary vestibular afferents and/or hair cells (Aw et al. 2008; Curthoys and Macdougall 2012; Gensberger et al. 2016; Goldberg 2000; Goldberg et al. 1982, 1984; Kim and Curthoys 2004; Kwan et al. 2019). In nonhuman primates, transmastoid electrical vestibular stimulation (EVS) modulates the firing rate of primary vestibular afferents from both end-organs with increased gain at higher stimulation frequencies (Kwan et al. 2019). Although the irregular afferents from the otolith and SCC exhibit a larger gain than regular afferents to electrical stimuli applied percutaneously, their increased variability results in similar thresholds to the electrical stimuli (Kwan et al. 2019). Assuming that all primary vestibular afferents are activated during transmastoid EVS, the summation of unit vectors representing the orientations of the SCCs forms a net EVS-evoked rotation vector accompanied by a negligible net linear vector because of the near cancellation of otolithic components due to their hair cell orientation on the macula (Fitzpatrick and Day 2004; Mian et al. 2010). As a result of this net summation, transmastoid EVS evokes sensations of “virtual” head roll rotation, as well as compensatory eye movement, balance, and navigation responses in humans (Day and Fitzpatrick 2005; Fitzpatrick et al. 2002, 2006; Mackenzie and Reynolds 2018; Peters et al. 2015; Reynolds 2011; Schneider et al. 2002; St George et al. 2011; Tisserand et al. 2018). Given the growing interest for EVS in both biomedical (Blini et al. 2018; Bunn et al. 2015; Oppenländer et al. 2015; Wilkinson et al. 2014) and immersive reality applications (Ando et al. 2017; Cevette et al. 2012; Nakayama et al. 2018; Preuss and Ehrsson 2019), providing a way to electrically induce virtual sensations of motion that have realistic mechanical equivalents would be a major step toward integrating EVS into those industries.
Because transmastoid EVS is driven by the net-evoked virtual rotation of the head, eliciting realistic motion sensation requires the matching of sensory response with those arising from mechanical rotations of the head (Day and Fitzpatrick 2005; Peters et al. 2015; Schneider et al. 2002; St George et al. 2011). The SCC end-organs are inertial sensors responding to head angular accelerations. For an impulsive head angular acceleration resulting in a step change in head angular velocity, the endolymph lags behind the rotation of the canals because of its inertia, thus exerting pressure on the cupula and activating hair cell receptors innervated by primary vestibular afferents. This causes an initial canal afferent response followed by an exponential response decay with a time constant of 3–7 s (Dai et al. 1999; Dickman and Angelaki 2004). For sinusoidal angular accelerations above 0.05 Hz, the frequency at which the vestibular afferents are modulated matches the frequency of the input acceleration (Fernandez and Goldberg 1971; Ramachandran and Lisberger 2006). Additional central processing of signals originating from primary vestibular afferents prolongs the central estimate of head angular velocity through a multisensory process known as the velocity storage (Cohen et al. 1981; Karmali and Merfeld 2012; Laurens and Angelaki 2011; Raphan et al. 1979; Raphan and Cohen 1985; Yakushin et al. 2017). The velocity storage results in a prolongation (10–20 s) of the evoked vestibuloocular reflex (VOR) and perception of self-rotation relative to peripheral vestibular nerve activity. This, however, depends on the head orientation relative to the axis of rotation (Bertolini et al. 2011; Bertolini and Ramat 2011; Cohen et al. 1981; Raphan and Cohen 1985, 2002; Seidman et al. 1995; Seidman and Leigh 1989).
Because of the anatomical orientation of the SCCs, and with the assumption that transmastoid EVS applied in a binaural-bipolar configuration activates all primary vestibular afferents (Kwan et al. 2019; Della Santina et al. 2005), EVS delivered at a nose-down head pitch orientation (~71–73°) is expected to evoke ocular torsional movements and a sensation of head roll around Earth’s vertical axis (Fig. 1A; Day and Fitzpatrick 2005; Khosravi-Hashemi et al. 2019; Peters et al. 2015; St George et al. 2011). When the net EVS-evoked rotation vector has a component orthogonal to gravity, the brain infers a sensation of interaural or superior-inferior linear acceleration coupled to the sensation of self-rotation due to the integration of otolith-SCC signals and an internal representation of gravity (Khosravi-Hashemi et al. 2019). Despite mechanistic differences in vestibular hair cells and/or primary vestibular afferents activation between stimulus modalities, the central processing of EVS-evoked virtual rotations would be expected to share common pathways to those underlying mechanically evoked real rotations. Several studies have exploited these assumptions to compare ocular or perceptual responses between mechanical and electrical stimulations. St George et al. (2011), for instance, analyzed perceptual decay dynamics during a direct current EVS pulse (square wave) and a constant angular velocity mechanical pulse in standing humans. Similarly, mechanical rotations and EVS were used to compare vestibular perception in seated participants (Cutfield et al. 2011; Peters et al. 2015). Other studies focused on ocular responses to EVS (Schneider et al. 2000; Watson et al. 1998), where, notably, Schneider et al. (2002) concluded that a direct current EVS pulse was equivalent to a constant mechanical angular acceleration. Despite these comparisons, a direct numerical relationship must be established in order for us to apply electrically evoked and mechanically evoked rotations interchangeably.
Fig. 1.
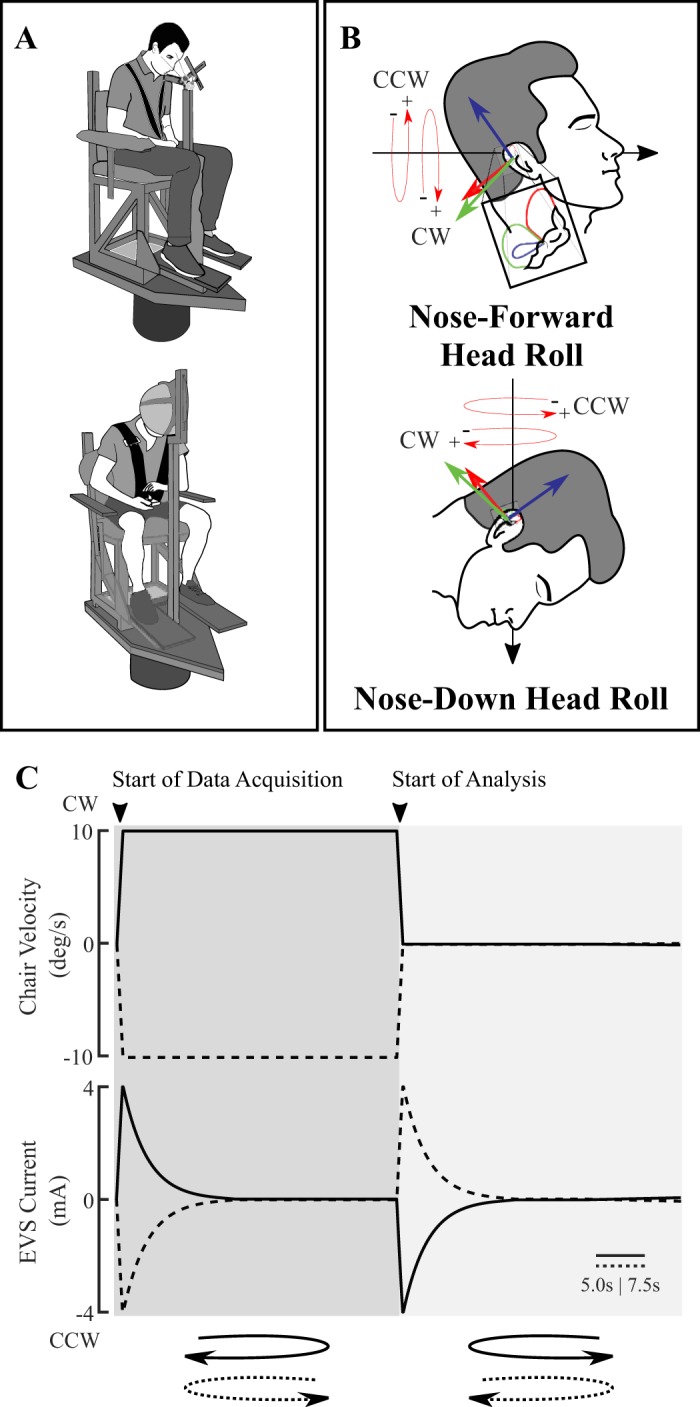
Illustration of head orientation, rotary chair, and stimulus signals. A: participant seated on rotary chair setup. An infrared camera is attached to a bite bar (top) and a helmet is affixed to the chair carriage (bottom) for experiment 1 and 2, respectively. Dual-layer memory foam padded participants’ feet, chest, forearms, and shanks but is not depicted for clarity. B: net electrical vestibular stimulation (EVS)-evoked rotation vector depicting clockwise (CW) and counterclockwise rotation (CCW) for nose-forward head roll (top) and nose-down head roll (bottom). C: electrical and mechanical vestibular stimuli produced ocular torsion and perception of whole body yaw rotation about Earth’s vertical axis. Mechanical (chair) angular velocity (top) consisted of a step change to ±10 deg/s over 30 s (experiment 1) or 45 s (experiment 2) followed by a step change back to 0 deg/s rest. Note the different timescales (represented by horizontal bars) for experiments 1 and 2 (5.0 and 7.5 s, respectively) due to different stimulus durations. Time-varying model-derived electrical current stimulus that mimics the pattern of primary vestibular afferent activation evoked by the mechanical stimulus is shown at bottom. Data acquisition occurred at the start of stimulus onset, and data were analyzed following the period after the return to 0 deg/s rest.
The goal of the current study was to develop a mechanical to electrical vestibular stimulus conversion model to interchangeably derive a time-varying electrical current stimulus equivalent for a given mechanical head motion. We adapted transmastoid EVS to canal afferent transfer functions identified in nonhuman primates (Kwan et al. 2019) and tested, in humans, a mechanical-to-electrical vestibular stimulus conversion model that accounts for the physiological activation of primary vestibular afferents for step change and multisine angular velocity stimuli. We predicted that by matching the activation of primary vestibular afferents for mechanical and electrical stimuli, the ocular and perceptual response dynamics would be similar. The present study represents a critical initial step toward generating virtual motion for a desired real mechanical motion while improving our understanding of the central processing of electrical vestibular stimulation.
METHODS
Two initial experiments were performed on separate days to evaluate ocular and perceptual responses between a mechanical step change in angular velocity and a model-derived electrical current equivalent. In experiment 1, ocular responses from 12 participants (7 women; age: 23.4 ± 3.9 yr; mean ± SD) were recorded through video-oculography. In experiment 2, 18 separate participants (9 women; age: 25.0 ± 3.8 yr) reported their perceived whole body angular velocities. A third experiment was performed on five participants (1 woman; age 23.4 ± 2.3 yr) to examine the generalizability of our mechanical-to-electrical vestibular stimulus conversion model by comparing ocular responses to a multisine angular velocity stimulus with its electrical equivalent. All participants had no known neurological diseases or injuries before taking part in the study. They were informed about the experimental protocol and possible discomforts involved before their written informed consent was obtained. All procedures conformed to the standards of the Declaration of Helsinki and were approved by the University of British Columbia’s Clinical Research Ethics Board [H09-00987 (2017-03-24), H19-00422 (2019-08-29)].
Setup.
Participants were seated on a rotary chair. A series of procedures were performed to minimize nonvestibular cues of motion (Fig. 1A). First, participants were fastened using a five-point racing harness (9411D 5-point harness system; RCi) padded with dual-layered memory foam secured around their feet, chest, forearms, and shanks. This minimized potential somatosensory cues associated with whole body chair motion by dampening motor and chair vibrations. An 80-mm computer fan (KD1208PTB3-6; Sunon, Taiwan; airflow 0.85 m3/min) was positioned in front of the participant’s face to mask air movement associated with whole body motion. Auditory cues from the chair’s servomotor were masked by disposable earbuds and noise-cancelling headphones (QuietComfort 25 acoustic noise cancelling headphones; Bose) playing uniform white noise. All experiments were performed in complete darkness to remove visual cues. Last, we applied anesthetic AMETOP gel (tetracaine HCl gel, 4% wt/wt; Smith & Nephew, UK) over the skin on the mastoid processes 30–45 min before all perceptual recordings to minimize cutaneous cues associated with the electrical stimuli. Once all sensory masking procedures were performed, the participant’s head was pitched downward by ~71–73° relative to Reid’s plane (plane passing through the inferior orbital rim and external auditory meatus) being parallel to the ground. At this nose-down head pitch orientation, the EVS-evoked rotation vector derived from the vector summation of the unit vectors normal to canal planes was parallel to Earth’s vertical axis (Day and Fitzpatrick 2005; Fitzpatrick and Day 2004; Della Santina et al. 2005). Electrical stimulation at this head orientation induced a virtual head roll perception about the Earth’s vertical axis, matching our mechanical stimulus (Peters et al. 2015, 2016; Schneider et al. 2002; St George et al. 2011). This head-down orientation avoided potential conflicts between EVS-evoked signals of head rotation from the SCCs and a lack of expected otolith signals encoding head orientation changes within the gravitational field when the EVS-evoked vector has a component orthogonal to gravity (Khosravi-Hashemi et al. 2019). Head angles were confirmed at the beginning and halfway during testing using a spirit level and protractor. We secured participant head orientation using a bite-bar fitted to the participant’s dental impression (eye movement recording; Defend vinyl polysiloxane impression material) or a helmet (perceptual recording; Classic Skate; Pro-Tec) affixed to the chair carriage.
Vestibular stimuli.
Mechanical whole body rotations (head roll in head-centered coordinates due to the nose-down posture) were delivered using a programmable rotary chair controlled through a real-time motion controller at 100 Hz (PXI-7350 motion controller and Universal Motion Interface UMI-7774; National Instruments) incorporating the NI Motion Programming suite (National Instruments). Torque commands were sent by the motion controller to a servo amplifier (SGDV-200A01A; Yaskawa, Japan) powering an alternating current motor (SGMCS-2ZN3A-YA21; Yaskawa, Japan; encoder angular resolution 0.00034°, continuous torque 200 Nm). A clockwise (CW) rotation is positive (+) and a counterclockwise (CCW) rotation is negative (−) to represent, by convention, rotations around a positive Z-axis pointing to the ground. In experiments 1 and 2, the applied mechanical stimulus profile consisted of a step change in angular velocity from 0 to ±10 deg/s over 1 s with a constant angular velocity duration of 30 and 45 s, respectively. A symmetrical offset step change in angular velocity from ±10 to 0 deg/s brought the chair angular motion back to stationary rest (Fig. 1C, top). In experiment 3, the mechanical stimulus profile was a multisine angular velocity oscillation of ±10 deg/s peak amplitude (root mean square: 4.73) lasting 60 s with equal power at 0.05, 0.1, 0.2, 0.5, and 1.0 Hz. The 60-s motion oscillation consisted of three repeating 20-s segments. The multisine mechanical stimulus was generated using a custom MATLAB (R2017a; The MathWorks) function (Forbes et al. 2014).
Virtual whole body rotations (head roll in head-centered coordinates due to the nose-down posture) were induced by electrical current applied in a binaural-bipolar configuration. Carbon rubber electrodes (9 cm2) coated with 1 mL of conductive electrode gel (Spectra 360; Parker Laboratories) were secured over the left and right mastoid processes with hypoallergenic tape (Durapore; 3M). Electrical current waveforms were digitized at 1,000 Hz using a multifunction data acquisition (DAQ) board (PXI-6289; National Instruments) and sent through a constant-current stimulus isolation unit (STMISOLA; Biopac Systems). Based on our electrode configuration and convention for mechanical rotations, a cathode right/anode left current represented a clockwise (+) virtual rotation and a cathode left/anode right current represented a counterclockwise (−) virtual rotation. Time-varying mechanically equivalent electrical current waveforms were generated by using our mechanical-to-electrical stimulus conversion model implemented in MATLAB to replicate the activation of the primary SCC afferents expected from the mechanical stimulus. The electrical current waveform equivalent to our angular velocity step change mechanical stimulus consisted of an initial onset peak decaying over the mechanical constant angular velocity phase (30 s for experiment 1 and 45 s for experiment 2), which was followed by a symmetrical but inverted offset profile (Fig. 1C, bottom) to represent the transition from ±10 to 0 deg/s. The multisine equivalent electrical current waveform was generated by identically passing the mechanical multisine angular velocity profile through the mechanical-to-electrical vestibular stimulus conversion model. The output current waveform resembled a multisine signal (see Fig. 5A, top).
Fig. 5.

Experiment 3. Multisine vestibular stimulation between mechanical and electrical vestibular stimulations. A: 20-s segmented stimulation profiles (top), ocular torsional slow-phase position (middle), and slow-phase velocity (SPV; bottom) from mechanical (blue) and electrical (red) conditions in a representative subject. For slow-phase position, thin colored lines denote individual 20-s segment responses, and the thick colored lines denote the averaged 20-s segment response. B: orthogonal regression analysis between ocular torsional SPV responses shown in A with best-fit (red dashed) line. C: frequency spectrum of ocular torsional SPV responses. Responses exhibited power at input frequencies (0.05, 0.1, 0.2, 0.5, 1.0 Hz) with a high signal-to-noise ratio. D: pooled (n = 5) mechanical-to-electrical gains (mA per deg/s) across frequencies. Individual observations are represented as circles. Dashed horizontal lines and solid horizontal lines with shaded areas mark the means ± SD.
The mechanical-to-electrical vestibular stimulus conversion model (Fig. 2) first computed the expected primary afferent dynamics for a given input mechanical angular velocity waveform using a 4-s time constant to represent the decay in SCC afferent activity (C in Eq. 3; Fernandez and Goldberg 1971). The expected SCC afferent response was then passed through two inverted transmastoid EVS-to-SCC afferent transfer functions to represent the responses of the regular (Hr) and irregular (Hir) SCC afferents established by Kwan et al. (2019):
| (1) |
| (2) |
We used a 3:1 weighting on regular-to-irregular afferent contributions based on the assumption that there were three times more regular than irregular afferents because all afferents were assumed to be activated (Baird et al. 1988; Goldberg 2000). We multiplied the resulting output by a gain (K) to represent the scaling difference in our EVS to primary afferent transfer functions between nonhuman primates and humans due to anatomical differences in head size. Equation 3 describes the relationship between electrical and mechanical stimulation:
| (3) |
where K is the gain and C denotes the afferent activity resulting from the mechanical rotation. Based on previously reported direction discrimination thresholds to electrical and mechanical whole body rotations, the angular velocity-to-electrical current gain was between ~0.15 and 0.60 mA per deg/s from 0.05 to 0.5 Hz (Peters et al. 2015), differing from the ∼0.06 to 0.2 mA per deg/s identified in nonhuman primates (Kwan et al. 2019). For experiments 1 and 2, we used a gain K of 2.20 in Eq. 3 to account for these differences between nonhuman primates and humans. Consequently, the output from Eq. 3 will transform a ±10 deg/s peak whole body rotation applied over 1 s into a ±4.0-mA peak electrical stimulus (i.e., 0.40 mA per deg/s). We evaluated this proposed gain K by comparing peak ocular torsional slow-phase velocity responses between mechanical and electrical stimulations. Results from experiment 1 showed that peak ocular torsional slow-phase velocity responses were slightly higher during EVS; thus we revised the original gain K to achieve a conversion factor of 0.37 mA per deg/s (for a step change in angular velocity) to better match responses in experiment 3.
Fig. 2.

Conceptual illustration of vestibular processing used in the mechanical-to-electrical stimulus conversion model. Expected primary afferent activity (firing rate) was derived for a given input head angular velocity (ωv) by passing through canal-cupula dynamics [H(s)SCC) modeled as a high-pass filter where τ = 4 s. Other sensory cues (e.g., visual, somatosensory, auditory) were assumed to be absent. Input electrical current (IEVS) was estimated from 2 inverted EVS-to-afferent transfer functions representing regular [H(s)r] and irregular [H(s)ir] units. Regular and irregular units were weighted at a 3:1 ratio and multiplied by a gain (experiments 1 and 2: K = 2.20; experiment 3: K = 2.04). In our experiments, either the electrical or the mechanical stimulus was delivered; however, both stimuli were assumed to activate primary vestibular afferents and would be additive if delivered simultaneously. Both IEVS and ωv were assumed to pass through the same central processing mechanism to produce a central state estimate () generating compensatory eye movement and perception of self-motion.
Protocol.
Experiment 1 aimed to validate our model-derived electrical stimulus and to compare central processing between electrical and mechanical stimuli through the torsional VOR. The applied electrical current waveform was designed to replicate the physiological activation of primary vestibular afferents during a step change in angular velocity to the head (see Vestibular stimuli), thereby making the two stimuli equivalent at the primary SCC afferent level (Fig. 2). Participants were exposed to four experimental blocks: mechanical CW, electrical CW, mechanical CCW, and electrical CCW rotations; each block consisted of 10 trials with 40 trials in total. The order of these blocks was randomized between participants. Right eye movements were recorded using an infrared monochromatic camera (BFS-U3-16S2M-CS; FLIR, Canada) at 75 frames/s (minimum resolution 640 × 400 pixels). The acquisition of each video frame was triggered by an external 5-V pulse delivered by the DAQ board (PXI-6289; National Instruments), ensuring data synchronization. The camera was placed ∼10 cm in front of the participant’s face, and no visual target was provided. Participants were instructed to minimize blinking while keeping their eyes wide open and looking straight ahead during each trial.
Experiment 2 assessed the central perceptual processing between electrical and mechanical stimuli. Participants were exposed to mechanical and electrical vestibular stimuli in CW and CCW directions (see Vestibular stimuli) similarly to experiment 1. Each rotation was presented once in randomized order for a total of four trials. Participants were blindfolded and instructed to close their eyes throughout each trial. They were asked to track their perceived angular displacement by rotating a crank handle attached to a potentiometer. Perceptual data for mechanical and electrical trials were respectively digitized at 2,048 and 1,000 Hz using a DAQ board (PXI-6289; National Instruments). All data acquisition and synchronization for mechanical and virtual (EVS evoked) whole body rotation stimuli were achieved through a custom virtual instrument in LabVIEW (LabVIEW 2013; National Instruments).
In experiment 3, we evaluated the generalizability of the mechanical-to-electrical vestibular stimulus conversion model by comparing mechanical and electrical stimuli using a multisine waveform allowing for a continuum of angular velocities. Participants were exposed to a pregenerated multisine angular velocity oscillation or a model-derived equivalent electrical current profile (see Vestibular stimuli). Setup and instrumentation for eye recordings were identical to those used in experiment 1. Mechanical and electrical stimuli were presented five times each in a randomized order for a total of 10 trials. Additional trials were performed when video quality was deemed poor due to iris occlusion from eyelid or blinking at the beginning of trial.
Data analysis.
We only analyzed the response to an offset step change from constant ±10 deg/s angular velocity to stationary rest, and its electrical equivalent, for experiments 1 and 2. This was chosen following the rationale in other studies (Bertolini et al. 2011; Okada et al. 1999) because it is possible that confounding factors, such as vibrations, may be sensed during the constant-velocity phase of the mechanical stimulus. As such, focusing on the offset response provided the closest match in sensations between the electrical and mechanical stimuli.
An algorithm based on the work by Otero-Millan et al. (2015) was implemented in Python 3.6.6 using OpenCV image processing functions to estimate ocular torsional displacement from video recordings from experiments 1 and 3. Briefly, pixels within each frame were segregated into either black or white values to generate a binary video based on thresholding. The transformed video allowed for the detection of maximum contour for which a least-squares elliptical fit of the pupil was determined in each frame. The pupil’s center and radius to the iris in each frame were used to perform a polar coordinate transform of the portion of the frame containing the iris. Torsion rotation of the eye between two frames was calculated through the relative horizontal shift between two polar-transformed iris segments using cross-correlation at a resolution of 0.01 deg through interpolation of the correlation results. Shifts in each video frame were compared with the first frame, which was used as a reference. Blinks were manually removed from the analysis. Videos that had blinks within the first 3 s were omitted from analysis. The ocular torsional fast-phase saccades were corrected for by using an inverse nystagmus algorithm to estimate the slow-phase nystagmus and slow-phase velocity before analysis. The algorithm detected occurrences of fast-phase saccades by detecting peaks in velocity based on a threshold (Barnes 1982; Krauzlis and Miles 1996). An inverted position signal was applied to the raw torsional displacement signal. Two participants were removed from the analysis of experiment 1 because they had fewer than seven analyzable videos in any condition.
Ocular and perceptual displacement data were zero-padded for 5 s at the start and end before digital filtering. For experiments 1, ocular torsional displacement was differentiated, averaged across trials, and then Butterworth filtered (4th order, 1-Hz cutoff) to obtain the ocular torsional slow-phase velocity. Peak ocular torsional slow-phase velocity was identified as the absolute maximal ocular velocity occurring less than 4 s after the start of the offset phase of the stimulus (e.g., return to 0 deg/s or second EVS pulse for a trial). All perceptual data from experiment 2 were included in the analysis. Perceptual displacement was differentiated and then Butterworth filtered (1st order, 0.20-Hz cutoff). Peak perceived angular velocity was normalized to 100% to allow for averaging between participants. The exponential decay time constants for ocular torsional slow-phase velocity and perceived velocity in experiments 1 and 2, respectively, were estimated by fitting a single-term exponential using nonlinear least squares from the identified peak velocity to the end of the trial.
Ocular torsional displacements obtained in experiment 3 were first sectioned into 20-s segments from the original 60-s trials and then averaged within each condition. The averaged electrical and mechanical ocular displacement responses were Butterworth filtered at a higher 2-Hz cutoff frequency (4th order) because of an expected 1-Hz component in the signal. The averaging procedure was used to avoid missing data associated with blinks and inherent noise due to the video processing algorithm. The frequency-domain magnitude spectrum was estimated for the averaged ocular torsional slow-phase velocity from experiment 3 using the discrete fast-Fourier transform. The gains between ocular torsional slow-phase velocity and its stimulation types were taken at 0.05, 0.1, 0.2, 0.5, and 1.0 Hz through dividing their cross-spectral densities by the autospectral density of the stimulus (mechanical: velocity encoder, deg/s; electrical: current amplitude, mA). The ratio between ocular torsional slow-phase velocity evoked by both stimuli (electrical divided by mechanical) was taken as the mechanical-to-electrical response gains. All data processing was performed using MATLAB (R2017a: The MathWorks) unless otherwise stated.
Statistical analysis.
To evaluate the similarity in response between mechanical and electrical stimuli, ocular torsional response dynamics from experiment 1 (peak ocular torsional slow-phase velocity, absolute peak slow-phase velocity, and slow-phase velocity exponential decay time constants) were submitted to two-way repeated-measures ANOVAs with directionality (clockwise, counterclockwise) and stimulus type (electrical, mechanical) as factors. Absolute peak ocular torsional slow-phase velocity and slow-phase velocity exponential decay time constants were pooled between directionality and further submitted to paired two one-sided tests of equivalence (paired TOST) because we found no significant difference in directionality. The paired TOST were performed to test the null hypothesis that two populations are dissimilar. In our paired TOST, an equivalence bound was defined as the standard deviation of the samples being compared. If the region of indifference completely encompasses the confidence interval (CI), then the two populations are deemed statistically equivalent; otherwise, the test fails to reject the null hypothesis of difference (Robinson and Froese 2004). This criterion was chosen based on its use as the sensitivity index (d′) in vestibular heading experiments to determine a threshold of discrimination between two stimuli (Gu et al. 2007; MacNeilage et al. 2010).
We performed orthogonal total least-squares regressions between responses evoked by mechanical and electrical stimuli. This was, for experiment 1, peak ocular torsional slow-phase velocity and slow-phase velocity exponential decay time constants, and in experiment 3, continuous ocular torsional slow-phase velocity time series. Orthogonal regressions were calculated by taking the eigenvector with the largest eigenvalue in a two-column (mechanical and electrical) matrix using the singular value decomposition algorithm (pca function in MATLAB). The orthogonal regression was chosen because it assumes both predictor and response variables were measured with error. Pearson’s correlation coefficients were calculated as a measure of linear correlation between the regressed variables. Orthogonal regression best-fit slopes were subjected to a one-sample t test to determine whether slopes were significantly different from 1. The influence of stimulus frequency on mechanical to electrical gains was also tested using a one-way repeated-measures ANOVA with frequency (0.05, 0.1, 0.2, 0.5, 1.0 Hz) as the factor. These statistical analyzes were performed using R (version 3.5.3), R Studio (version 1.1.463), and R packages “equivalence” (version 0.7.2) and “ez” (version 4.4.0).
Given the variability of participants’ single-trial perceptual responses, we used a bootstrap procedure to improve the estimates of perceptual exponential decay time constants for comparisons between conditions. The bootstrap was performed by resampling with replication from the pool of 18 participants’ perceived velocity time series. Each iteration selected 18 samples, and each sample consisted of the selected participant’s perceived velocity in all four conditions, therefore retaining the paired observations. The selected perceptual responses were averaged and fitted with a single-term exponential fit starting from peak velocity as described. With this resampling procedure, perceptual exponential decay time constants were estimated over 10,000 iterations, creating a bootstrap distribution for each condition. The mean and 95% confidence intervals were derived by fitting each bootstrap distribution with a Gaussian fit. For comparisons, the mean difference between two conditions was calculated for each bootstrap iteration, thus deriving a mean difference distribution. A Gaussian fit was also used to estimate the mean difference 95% confidence interval for each mean difference distribution. Means () and 95% confidence intervals (95% CI*) obtained from the bootstrap procedure are denoted with an asterisk. If a mean difference confidence interval crossed zero, this indicated that there was no statistical difference between compared bootstrap distributions. We first compared between directionality for electrical and mechanical stimuli, respectively, and then compared between stimuli for each corresponding direction. Bootstrap analyzes were performed using MATLAB (R2017a; The MathWorks). All statistical tests were performed with an α level of 0.05.
Data and software availability.
Data from experiment 3, scripts used to generate Fig. 5 (related to experiment 3), and our mechanical-to-electrical stimulus conversion model are available at the Scholar Portal Dataverse (see endnote). Data from experiment 1 and 2 were not added to the public database because of a lack of release consent at the time.
RESULTS
All participants completed the tasks with no complaints of dizziness or adverse side effects. Well-defined ocular torsion and perceptual responses to both electrical and mechanical vestibular stimuli were observed (Figs. 3, 4, and 5). Ocular torsional slow-phase velocity responses exhibited an initial peak between 1.20 and 3.50 s with a subsequent exponential decay in the opposing direction for both CW and CCW conditions’ offset transition. For a representative subject, the peak ocular torsional slow-phase velocities reached similar absolute values for mechanical (CW 1.18 deg/s, CCW −1.12 deg/s) and electrical stimuli (CW 1.26 deg/s, CCW −1.22 deg/s). The subsequent ocular torsional slow-phase velocity exponential decay time constants for electrical conditions (CW 8.3 s, CCW 6.0 s) were comparable to those for mechanical conditions (CW 8.1 s, CCW 4.3 s; Fig. 3A, left). The mean perceptual velocity exponential decay time constant averaged between participants also displayed similar response dynamics characterized by an initial peak angular velocity followed by an exponential decay ranging from 5.7 to 7.5 s (Fig. 4A, left). Ocular torsional slow-phase velocity responses to both electrical and mechanical multisine stimulations were also observed (Fig. 5A).
Fig. 3.

Experiment 1. A: ocular torsional slow-phase velocity (SPV) across stimulation types (electrical, mechanical) and directionalities (clockwise, CW; counterclockwise, CCW) from a single participant (solid lines; left) and group averaged (solid lines; right) with ±SE (red shaded area; n = 10). B: absolute peak ocular torsional SPV across stimulation types and directionalities. C: ocular torsional SPV time constant across stimulation types and directionalities. In B and C, individual observations are represented as circles, and dashed vertical lines with shaded areas mark the mean ± SD.
Fig. 4.

Experiment 2. A: perceived angular velocity across stimulation types (electrical, mechanical) and directionalities (clockwise, CW; counter-clockwise, CCW) from a single participant (solid lines; left) and the set mean of perceived angular velocity response used for bootstrap analysis (solid line; right) with ±SE (red shaded area; n = 18). Perception magnitudes were normalized to 100%. B: bootstrap perceptual exponential decay time constants across stimulation types and directionalities. Dashed vertical lines indicate bootstrap means, and circles are set means with horizontal bars indicating bootstrap 95% confidence interval (95%CI*). C: bootstrap mean difference in exponential decay time constants showing comparisons between directionalities (left 2 plots) and stimulation types (right 2 plots). Circles indicate mean differences with vertical bars indicating 95% CI*. Comparisons show no difference as indicated by the 95% CI* crossing zero (dashed line).
Ocular slow-phase velocity response to mechanical and electrical vestibular stimuli.
We assessed peak ocular torsional slow-phase velocity and slow-phase velocity exponential decay time constant to determine how responses evoked by electrical stimulation matched those evoked by mechanical rotations. The averaged peak ocular torsional slow-phase velocities during EVS were 1.26 ± 0.52 and −1.22 ± 0.51 deg/s (means ± SD) for the CW and CCW directions, respectively. Similarly, the mechanically induced averaged peak ocular torsional slow-phase velocities were 1.18 ± 0.45 and −1.12 ± 0.44 deg/s for the corresponding directions. Grouped analysis of peak ocular torsional slow-phase velocity showed a significant effect of stimulus direction (F1,9 = 110.11, P < 0.001); however, analysis of absolute peak ocular torsional slow-phase velocity magnitude did not reveal a significant effect of directionalities (F1,9 = 0.190, P = 0.67) or stimulus types (F1,9 = 0.430, P = 0.53), and no interaction (F1,9 = 0.024, P = 0.88; Fig. 3B).
After the peak ocular torsional slow-phase velocity was reached, the torsional response dynamic was characterized by an exponential decay. On average, the ocular torsional slow-phase velocity exponential decay time constants in the CW rotation for electrical (6.4 ± 3.7 s) and mechanical stimulation (6.9 ± 4.2 s) were consistent. This was also observed in the CCW rotation between electrical (4.0 ± 2.4 s) and mechanical stimuli (4.1 ± 2.0 s). Grouped analysis showed no significant effect across stimulus types (F1,9 = 0.457, P = 0.52) or directionalities (F1,9 = 4.295, P = 0.07), and no interaction (F1,9 = 0.125, P = 0.73; Fig. 3C).
We further verified the equivalency between stimulation types by separately comparing peak ocular torsional slow-phase velocity and slow-phase velocity exponential decay time constants using paired TOST and correlation analyzes. Because there was no effect of directionality, we pooled the rotation directions for both electrical and mechanical stimuli. Paired TOST showed that peak ocular torsional slow-phase velocity (t19 = −0.79, P < 0.002; ϵ = 0.47) and slow-phase velocity exponential decay (t19 = 0.71, P < 0.001; ϵ = 3.4) were both statistically equivalent. Orthogonal regression revealed a near-unity relationship for both peak ocular torsional slow-phase velocity (r = 0.93, P < 0.001, slope = 1.09; Fig. 6A) and slow-phase velocity exponential decay time constants (r = 0.80, P < 0.001, slope = 0.93; Fig. 6B).
Fig. 6.
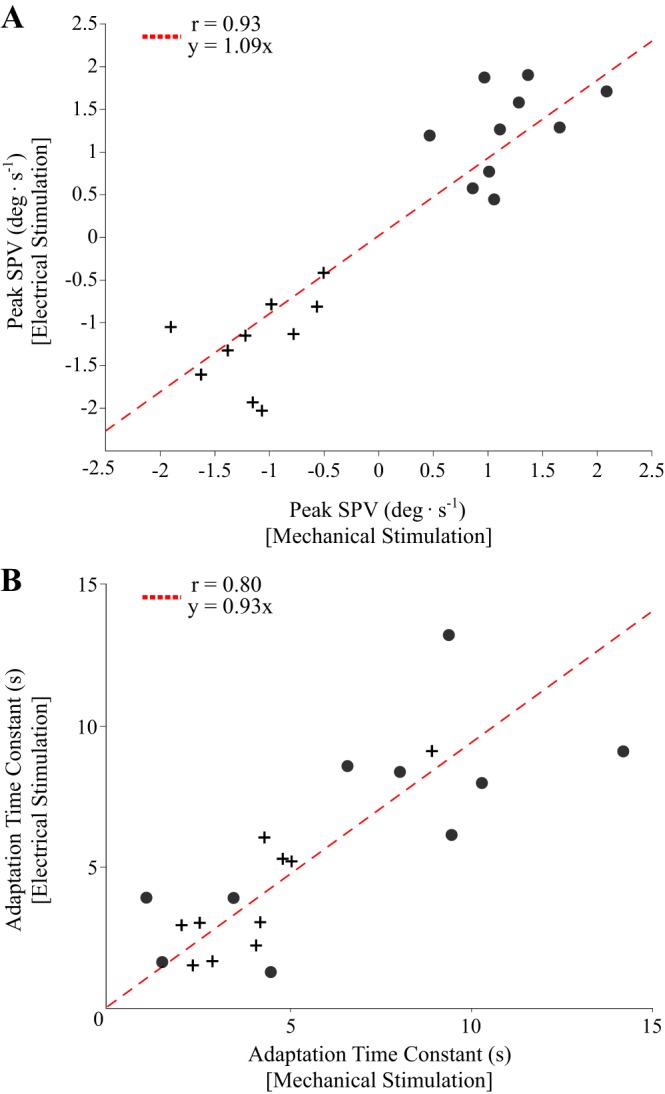
Orthogonal regression analysis between mechanical and electrical vestibular stimulations. A: orthogonal regression best-fit (dashed) line for peak ocular torsional slow-phase velocity (SPV) with clockwise (circles) and counterclockwise observations (crosses). B: orthogonal regression best-fit (dashed) line for ocular torsional SPV exponential decay time constant with clockwise (circles) and counterclockwise observations (crosses).
Confirming these findings, orthogonal correlation analyzes between multisine mechanical and electrical continuous ocular torsional slow-phase velocity responses revealed a regression slope close to unity across participants (slope = 1.42 ± 0.57; t4 = 1.63, P = 0.178) with positive (0.88 ± 0.10) correlation coefficients (Fig. 5B). Spectral analysis of ocular torsional slow-phase velocity responses showed peaks at the expected input frequencies of 0.05, 0.1, 0.2, 0.5, and 1.0 Hz with a high signal-to-noise ratio (Fig. 5C). Mechanical-to-electrical gains pooled across participants at these input frequencies were close to the input conversion factor of 0.37 mA per deg/s identified in experiment 1: calculated gains were 0.32 ± 0.10 mA per deg/s at 0.05 Hz, 0.36 ± 0.15 at 0.1 Hz, 0.36 ± 0.12 at 0.2 Hz, 0.38 ± 0.14 at 0.5 Hz, and 0.36 ± 0.13 at 1.0 Hz. No significant differences were observed across stimulation frequencies (F4,16 = 0.376, P = 0.823; Fig. 5D).
Perceived angular velocity response to mechanical and electrical vestibular stimuli.
Perceived angular velocity exponential decay time constants averaged across participants (i.e., data set mean) were similar for the electrical (CW = 6.5 s, CCW = 8.1 s) and mechanical stimuli (CW = 5.3 s, CCW = 6.2 s). Following the bootstrap analysis, the bootstrap mean and 95% confidence interval obtained for electrical CW [7.4 s (3.1, 11.0); (95% CI*)] and CCW [7.5s (3.2, 11.5)] rotations were similar to those in the mechanical CW [6.0 s (3.7, 8.2)] and CCW [5.7s (2.0, 9.0)] directions. The mean difference 95% CI* between the electrical and mechanical rotations overlapped zero for both the CW and CCW directions (Fig. 4C), suggesting similar perceived angular velocity decay time constants between stimuli. Likewise, perceptual angular velocity decay time constants were comparable between directionality, because the mean difference 95% CI* for the CW and CCW directions within electrical and mechanical conditions also crossed zero (Fig. 4C).
DISCUSSION
Our aim was to develop and test a mechanical-to-electrical stimulus conversion model generating electrical current waveforms that could evoke vestibular responses mimicking a mechanical rotation of interest. We used transmastoid electrical stimulation to canal afferent transfer functions identified in nonhuman primates (Kwan et al. 2019) and multiplied these transfer functions by a gain K to account for differences in EVS-evoked responses between nonhuman primates and humans. We observed similar ocular torsional responses to electrical and mechanical stimuli matched based on the conversion model (experiments 1 and 3). The time series ocular torsional velocities evoked by the multisine electrical and mechanical stimuli were well correlated, given there were peak ocular torsional slow-phase velocities evoked by a step-change mechanical stimulus or its electrical equivalent. Similarly, ocular torsional slow-phase velocity in experiment 1 showed similar rate of decay to an angular velocity step-change stimulus, which was further confirmed at the perceptual level in experiment 2. Taken together, these results suggest that a mechanical-to-electrical stimulus conversion model accounting for the physiological activation of primary vestibular afferents can lead to analogous vestibular-evoked responses between electrical and mechanical stimulations.
Mechanical-to-electrical stimulus conversion model gain.
The mechanical to electrical stimulus conversion model depends on two transfer functions (Eq. 1, Eq. 2), parameters that were previously identified and tuned for nonhuman primates, and a scaling gain (K; Eq. 3). Here we discuss our choice of K for scaling mechanical-to-electrical conversions as used in Eq. 3. This parameter, which was evaluated using the peak ocular torsional slow-phase velocity, dictates the gain of the conversion from angular velocity to afferent response matching the electrical current. A previous study applied EVS with a mechanical-to-electrical gain as low as 0.125 mA per deg/s (Héroux et al. 2015). These gains, however, may range from 0.1 up to 2 mA per deg/s (Peters et al. 2015). Starting with a gain K = 2.20 (which results in a conversion factor of 0.40 mA per deg/s for a step change in angular velocity) for experiment 1, we found the peak ocular torsional slow-phase velocity for mechanical and electrical stimuli in our study was similar for both stimulus types, ranging in absolute terms between 1.12 and 1.26 deg/s. Using the data from experiment 1 post hoc, we approximated the mechanical angular velocity-to-electrical current conversion factor to be 0.37 mA per deg/s. The post hoc approximated gain was then used under multisine stimulation (experiment 3), resulting in ocular torsional slow-phase velocity mechanical-to-electrical gains between 0.32 and 0.38 mA per deg/s at each input frequency component. This aligned well with the gain used in experiment 1 and with previously matched estimates ranging from 0.37 to 0.42 mA per deg/s (Schneider et al. 2000, 2002). This was further supported by near-unity regression analysis of continuous time-varying ocular torsional slow-phase velocities between stimulation types.
The present results allowed us to assess the relative gains between ocular torsional response to electrical or mechanical stimuli. We estimated the gain between ocular torsional slow-phase velocity and electrical current at 0.31 ± 0.13 deg/s per mA in experiment 1. This was reproduced in experiment 3, where gains were between 0.33 and 0.42 deg/s per mA. Our gain estimates were within the 0.20–0.45 deg/s per mA range reported for electrical stimuli up to 5 mA (Jahn et al. 2003a, 2003b; Mackenzie and Reynolds 2018; Schneider et al. 2002). The gain between ocular torsional slow-phase velocity and mechanical head angular velocity was estimated at 0.11 ± 0.04 in experiment 1. This gain closely matched those in experiment 3 ranging from 0.09 to 0.14 and previously reported values of 0.12–0.20 (Bartl et al. 2005; Schneider et al. 2002); however, gains up to 0.40 have been reported for higher angular velocities (Groen et al. 1999; Kawato 1999; Schmid-Priscoveanu et al. 2000; Seidman and Leigh 1989; Tweed et al. 1994). The ocular torsional gains estimated from the present data demonstrate that our observed ocular torsional slow-phase velocity responses to mechanical and electrical stimuli followed expected sensitivities.
Torsional exponential decay between vestibular stimuli.
The similar peak ocular torsional slow-phase velocity evoked by both electrical and mechanical stimuli suggested that the evoked primary afferent activation of the SCCs was comparable between stimuli. This allowed us to further analyze any differences in central vestibular processing between stimuli by comparing ocular torsional slow-phase velocity exponential decay dynamics. Ocular response dynamics will be influenced by the high-pass characteristics of the transfer functions between electrical/mechanical stimulation and SCC afferent responses (Eq. 1, Eq. 2) that we used in the mechanical-to-electrical vestibular stimulus conversion model (Eq. 3). In response to both stimuli, ocular torsional slow-phase velocity exhibited an exponential decay from peak value with time constants ranging, on average, between 3 and 7 s. Schneider et al. (2002) also showed comparable time constants for constant angular acceleration and its equivalent direct current electrical stimulus. Our results and those reported by Schneider et al. (2002) reflected time constants consistent with the peripheral canal-cupula mechanism rather than showing prolongation of the ocular response dynamics associated with the velocity storage mechanism. Although central prolongation of the VOR has been reported extensively in the literature, this process is dependent on the head orientation and the direction of the axis of rotation with respect to gravity (Bertolini et al. 2008; Bockisch et al. 2005; Schmid-Priscoveanu et al. 2000; Tweed et al. 1994). For example, head yaw rotation in a head-up posture evoked horizontal VOR with central processing showing time constants of 14–20 s (Bertolini et al. 2011; Seidman and Leigh 1989; Su et al. 2000; Tweed et al. 1994). Shorter time constants (2–7 s) were reported for head pitch or roll rotations evoking vertical and torsional rotational VOR (Bertolini et al. 2008; Bertolini and Ramat 2011; Seidman and Leigh 1989; Tweed et al. 1994); i.e., for head rotations (roll) aligning better with the virtual rotation vector induced by EVS.
Perceptual exponential decay between vestibular stimuli.
We further investigated the applicability of our mechanical-to-electrical stimulus conversion model in replicating perception of self-motion by presenting the same stimulus pulses while recording participants’ perception of self-motion in experiment 2. Vestibular afferent information is sent to the vestibular nuclei for central processing involving the VOR (Dickman and Angelaki 2004); however, conscious self-motion perception also involves further activity at the thalamus and neocortex neurons (Büttner et al. 1977; Grüsser et al. 1990). Participants’ perceptions of angular velocity also exhibited an exponential decay in response to both stimuli with time constants between 4 and 8 s, similar to previous reports with participants rotating in a supine position or lying sideways (Bertolini et al. 2011; Grunfeld et al. 2000; Shaikh et al. 2013). Comparable to reported ocular torsional time constants, these short time constants cautiously imply similar central processing between torsional VOR and self-motion perception. Given that minimal ocular torsional velocity storage was expected (Bertolini et al. 2011; Okada et al. 1999; Sinha et al. 2008) due to its dependency on head orientation and the axis of rotation relative to gravity (Bertolini et al. 2011, 2012; Shaikh et al. 2013), ocular torsional rotations may not be the best model to address this issue.
Initial steps toward a mechanical-to-electrical stimulus conversion model.
The development of a physiologically plausible mechanical-to-electrical stimulus conversion model for human use is promising given our data suggest that we replicated both ocular responses to and perceptions of whole body rotation during a step change in head angular velocity and in multisine angular velocity oscillations. Our model, nonetheless, has some inherent limitations. First, we were limited to a low 4-mA current amplitude, in line with most EVS studies using current <5 mA for safety and to minimize potential current leakage onto other central pathways. As such, we only compared rotations limited to ~10 deg/s. Second, our data only support the replication of ocular and perceptual responses evoked by a step change in angular velocity and ocular response to a multisine angular velocity delivered at a nose-down head roll posture. Continued research is needed to validate our model for different participant populations, head orientations, and motion pulses (e.g., constant angular acceleration, higher frequency motion). Variability in ocular and perceptual responses was captured in our data set. For example, individual data may suggest changes in response gains across stimulation frequencies, but when data from all participants are considered, the between-subject variability led to averaged gains close to our reported gain (Fig. 5, C and D). The origin of this variability is unknown. Future work should explore the potential role of anatomical variations between participants and also determine if transfer functions from physiological data (Schneider et al. 2015) may provide advantages for representing the human canal response dynamics (e.g., for stimuli including higher frequencies).
Special considerations must be made when EVS is applied at head orientations that deviate from our nose-down head pitch posture used in this study. Electrical stimulation at a nose-forward or an ear-down orientation results in inferences of interaural or superior-inferior linear acceleration of the head as the brain attempts to resolve the discrepancy between the EVS-induced virtual rotation of the head that changes the alignment of the head relative to gravity without the accompanying expected otolith signal (Khosravi-Hashemi et al. 2019). The combination of our present mechanical-to-electrical stimulus conversion model with the interaction between head orientation in the gravitational field and the inference of motion induced by EVS may help bridge the gap between research and clinical application of EVS (Cutfield et al. 2011; MacDougall et al. 2005; Mackenzie et al. 2018; Welgampola et al. 2013). Vestibular pathologies such as acute lesions show biases in vestibular responses (Anastasopoulos et al. 1997; Aoki et al. 1999; Bisdorff et al. 1996), which are believed to stem from otolithic imbalance. These could potentially be clinically probed to compare and understand vestibular responses in persons with these pathologies; however, future work is required to compare and understand vestibular responses in persons with these pathologies.
Under ideal conditions, all nonvestibular (somatosensory, interoceptive, and auditory) cues would be eliminated. Unfortunately, we cannot disregard these additional cues of motion and how they may have influenced the responses evoked by the mechanical stimuli. We controlled for these potential confounding factors by taking precautions to minimize nonvestibular cues of motion (see Setup). Additionally, for experiments 1 and 2, we only analyzed the responses evoked from the constant angular velocity-to-stationary transition that matched the electrical and mechanical stimuli as closely as possible. Statistically, we elected to use the paired two one-sided tests (TOST) of equivalence and Pearson’s correlation coefficient as measures of equivalency. The statistical framework was flipped in the paired TOST because the null hypothesis assumes a difference between populations (Robinson and Froese 2004). This, however, required us to set equivalence boundaries; i.e., how small an effect is considered meaningfully different (Lakens 2017).
Overall, this study presents an initial validation for our mechanical-to-electrical stimulus conversion model toward replication of ocular torsional movements and self-motion perception for step-change and multisine head angular velocity stimuli. The current results represent an important step forward in using EVS within applied settings. The usefulness and future impact of the proposed stimulus conversion model lie in the emerging use of EVS as a clinical assessment and treatment tool. Assessing vestibular function with EVS provides a simple and portable alternative compared with the physical apparatus needed to impose whole body rotations. Our model may also allow for future commercialization within the virtual/augmented reality industries to supplement immersive experiences by generating desired self-motion.
GRANTS
This work was funded by the Natural Sciences and Engineering Research Council Discovery Grant 356026-13 (to J.-S. Blouin) and a Killam Postdoctoral Research Fellowship (to C. Kuo).
DISCLOSURES
No conflicts of interest, financial or otherwise, are declared by the authors.
AUTHOR CONTRIBUTIONS
A.C., N.K.-H., J.K.K., and J.-S.B. conceived and designed research; A.C. performed experiments; A.C., N.K.-H., and J.-S.B. analyzed data; A.C., N.K.-H., C.K., and J.-S.B. interpreted results of experiments; A.C. prepared figures; A.C. drafted manuscript; A.C., N.K.-H., C.K., J.K.K., and J.-S.B. edited and revised manuscript; A.C., N.K.-H., C.K., J.K.K., and J.-S.B. approved final version of manuscript.
ENDNOTE
At the request of the authors, readers are herein alerted to the fact that additional materials related to this manuscript may be found at https://doi.org/10.5683/SP2/EZGF9H. These materials are not a part of this manuscript and have not undergone peer review by the American Physiological Society (APS). APS and the journal editors take no responsibility for these materials, for the web site address, or for any links to or from it.
ACKNOWLEDGMENTS
We thank Oscar Ortiz Angulo and Jiyu Wang for support in data collection and Patrick Forbes for proofreading the manuscript.
REFERENCES
- Anastasopoulos D, Lempert T, Gianna C, Gresty MA, Bronstein AM. Horizontal otolith-ocular responses to lateral translation in benign paroxysmal positional vertigo. Acta Otolaryngol 117: 468–471, 1997. doi: 10.3109/00016489709113423. [DOI] [PubMed] [Google Scholar]
- Ando H, Sakurai K, Higuchi D, Aoyama K, Maeda T. GVS RIDE: providing a novel experience using a head mounted display and four-pole galvanic vestibular stimulation. ACM SIGGRAPH 2017 — Emerging Technologies. 2017: 9, 2017. doi: 10.1145/3084822.3084840. [DOI] [Google Scholar]
- Aoki M, Ito Y, Burchill P, Brookes GB, Gresty MA. Tilted perception of the subjective ‘upright’ in unilateral loss of vestibular function. Am J Otol 20: 741–747, 1999. [PubMed] [Google Scholar]
- Aw ST, Todd MJ, Aw GE, Weber KP, Halmagyi GM. Gentamicin vestibulotoxicity impairs human electrically evoked vestibulo-ocular reflex. Neurology 71: 1776–1782, 2008. doi: 10.1212/01.wnl.0000335971.43443.d9. [DOI] [PubMed] [Google Scholar]
- Baird RA, Desmadryl G, Fernández C, Goldberg JM. The vestibular nerve of the chinchilla. II. Relation between afferent response properties and peripheral innervation patterns in the semicircular canals. J Neurophysiol 60: 182–203, 1988. doi: 10.1152/jn.1988.60.1.182. [DOI] [PubMed] [Google Scholar]
- Barnes GR. A procedure for the analysis of nystagmus and other eye movements. Aviat Space Environ Med 53: 676–682, 1982. [PubMed] [Google Scholar]
- Bartl K, Schneider E, Glasauer S. Dependence of the torsional vestibulo-ocular reflex on the direction of gravity. Ann N Y Acad Sci 1039: 455–458, 2005. doi: 10.1196/annals.1325.043. [DOI] [PubMed] [Google Scholar]
- Bertolini G, Bockisch CJ, Straumann D, Zee DS, Ramat S. Estimating the time constant of pitch rVOR by separation of otoliths and semicircular canals contributions. Conf IEEE Eng Med Biol Soc 2008: 1060–1063, 2008. doi: 10.1109/IEMBS.2008.4649342. [DOI] [PubMed] [Google Scholar]
- Bertolini G, Ramat S. Velocity storage in the human vertical rotational vestibulo-ocular reflex. Exp Brain Res 209: 51–63, 2011. doi: 10.1007/s00221-010-2518-6. [DOI] [PubMed] [Google Scholar]
- Bertolini G, Ramat S, Bockisch CJ, Marti S, Straumann D, Palla A. Is vestibular self-motion perception controlled by the velocity storage? Insights from patients with chronic degeneration of the vestibulo-cerebellum. PLoS One 7: e36763, 2012. doi: 10.1371/journal.pone.0036763. [DOI] [PMC free article] [PubMed] [Google Scholar]
- Bertolini G, Ramat S, Laurens J, Bockisch CJ, Marti S, Straumann D, Palla A. Velocity storage contribution to vestibular self-motion perception in healthy human subjects. J Neurophysiol 105: 209–223, 2011. doi: 10.1152/jn.00154.2010. [DOI] [PubMed] [Google Scholar]
- Bisdorff AR, Wolsley CJ, Anastasopoulos D, Bronstein AM, Gresty MA. The perception of body verticality (subjective postural vertical) in peripheral and central vestibular disorders. Brain 119: 1523–1534, 1996. doi: 10.1093/brain/119.5.1523. [DOI] [PubMed] [Google Scholar]
- Blini E, Tilikete C, Farnè A, Hadj-Bouziane F. Probing the role of the vestibular system in motivation and reward-based attention. Cortex 103: 82–99, 2018. doi: 10.1016/j.cortex.2018.02.009. [DOI] [PMC free article] [PubMed] [Google Scholar]
- Bockisch CJ, Straumann D, Haslwanter T. Human 3-D aVOR with and without otolith stimulation. Exp Brain Res 161: 358–367, 2005. doi: 10.1007/s00221-004-2080-1. [DOI] [PubMed] [Google Scholar]
- Bunn LM, Marsden JF, Voyce DC, Giunti P, Day BL. Sensorimotor processing for balance in spinocerebellar ataxia type 6. Mov Disord 30: 1259–1266, 2015. doi: 10.1002/mds.26227. [DOI] [PMC free article] [PubMed] [Google Scholar]
- Büttner U, Henn V, Oswald HP. Vestibular-related neuronal activity in the thalamus of the alert monkey during sinusoidal rotation in the dark. Exp Brain Res 30: 435–444, 1977. doi: 10.1007/bf00237267. [DOI] [PubMed] [Google Scholar]
- Cevette MJ, Stepanek J, Cocco D, Galea AM, Pradhan GN, Wagner LS, Oakley SR, Smith BE, Zapala DA, Brookler KH. Oculo-vestibular recoupling using galvanic vestibular stimulation to mitigate simulator sickness. Aviat Space Environ Med 83: 549–555, 2012. doi: 10.3357/ASEM.3239.2012. [DOI] [PubMed] [Google Scholar]
- Cohen B, Henn V, Raphan T, Dennett D. Velocity storage, nystagmus, and visual-vestibular interactions in humans. Ann N Y Acad Sci 374: 421–433, 1981. doi: 10.1111/j.1749-6632.1981.tb30888.x. [DOI] [PubMed] [Google Scholar]
- Curthoys IS, Macdougall HG. What galvanic vestibular stimulation actually activates. Front Neurol 3: 117, 2012. doi: 10.3389/fneur.2012.00117. [DOI] [PMC free article] [PubMed] [Google Scholar]
- Cutfield NJ, Cousins S, Seemungal BM, Gresty MA, Bronstein AM. Vestibular perceptual thresholds to angular rotation in acute unilateral vestibular paresis and with galvanic stimulation. Ann N Y Acad Sci 1233: 256–262, 2011. doi: 10.1111/j.1749-6632.2011.06159.x. [DOI] [PubMed] [Google Scholar]
- Dai M, Klein A, Cohen B, Raphan T. Model-based study of the human cupular time constant. J Vestib Res 9: 293–301, 1999. [PubMed] [Google Scholar]
- Day BL, Fitzpatrick RC. Virtual head rotation reveals a process of route reconstruction from human vestibular signals. J Physiol 567: 591–597, 2005. doi: 10.1113/jphysiol.2005.092544. [DOI] [PMC free article] [PubMed] [Google Scholar]
- Della Santina CC, Potyagaylo V, Migliaccio AA, Minor LB, Carey JP. Orientation of human semicircular canals measured by three-dimensional multiplanar CT reconstruction. J Assoc Res Otolaryngol 6: 191–206, 2005. doi: 10.1007/s10162-005-0003-x. [DOI] [PMC free article] [PubMed] [Google Scholar]
- Dickman JD, Angelaki DE. Dynamics of vestibular neurons during rotational motion in alert rhesus monkeys. Exp Brain Res 155: 91–101, 2004. doi: 10.1007/s00221-003-1692-1. [DOI] [PubMed] [Google Scholar]
- Fernandez C, Goldberg JM. Physiology of peripheral neurons innervating semicircular canals of the squirrel monkey. II. Response to sinusoidal stimulation and dynamics of peripheral vestibular system. J Neurophysiol 34: 661–675, 1971. doi: 10.1152/jn.1971.34.4.661. [DOI] [PubMed] [Google Scholar]
- Fitzpatrick RC, Butler JE, Day BL. Resolving head rotation for human bipedalism. Curr Biol 16: 1509–1514, 2006. doi: 10.1016/j.cub.2006.05.063. [DOI] [PubMed] [Google Scholar]
- Fitzpatrick RC, Day BL. Probing the human vestibular system with galvanic stimulation. J Appl Physiol (1985) 96: 2301–2316, 2004. doi: 10.1152/japplphysiol.00008.2004. [DOI] [PubMed] [Google Scholar]
- Fitzpatrick RC, Marsden J, Lord SR, Day BL. Galvanic vestibular stimulation evokes sensations of body rotation. Neuroreport 13: 2379–2383, 2002. doi: 10.1097/00001756-200212200-00001. [DOI] [PubMed] [Google Scholar]
- Forbes PA, Dakin CJ, Geers AM, Vlaar MP, Happee R, Siegmund GP, Schouten AC, Blouin JS. Electrical vestibular stimuli to enhance vestibulo-motor output and improve subject comfort. PLoS One 9: e84385, 2014. doi: 10.1371/journal.pone.0084385. [DOI] [PMC free article] [PubMed] [Google Scholar]
- Gensberger KD, Kaufmann AK, Dietrich H, Branoner F, Banchi R, Chagnaud BP, Straka H. Galvanic vestibular stimulation: cellular substrates and response patterns of neurons in the vestibulo-ocular network. J Neurosci 36: 9097–9110, 2016. doi: 10.1523/JNEUROSCI.4239-15.2016. [DOI] [PMC free article] [PubMed] [Google Scholar]
- Goldberg JM. Afferent diversity and the organization of central vestibular pathways. Exp Brain Res 130: 277–297, 2000. doi: 10.1007/s002210050033. [DOI] [PMC free article] [PubMed] [Google Scholar]
- Goldberg JM, Fernández C, Smith CE. Responses of vestibular-nerve afferents in the squirrel monkey to externally applied galvanic currents. Brain Res 252: 156–160, 1982. doi: 10.1016/0006-8993(82)90990-8. [DOI] [PubMed] [Google Scholar]
- Goldberg JM, Smith CE, Fernández C. Relation between discharge regularity and responses to externally applied galvanic currents in vestibular nerve afferents of the squirrel monkey. J Neurophysiol 51: 1236–1256, 1984. doi: 10.1152/jn.1984.51.6.1236. [DOI] [PubMed] [Google Scholar]
- Groen E, Bos JE, de Graaf B. Contribution of the otoliths to the human torsional vestibulo-ocular reflex. J Vestib Res 9: 27–36, 1999. [PubMed] [Google Scholar]
- Grunfeld EA, Okada T, Jáuregui-Renaud K, Bronstein AM. The effect of habituation and plane of rotation on vestibular perceptual responses. J Vestib Res 10: 193–200, 2000. [PubMed] [Google Scholar]
- Grüsser OJ, Pause M, Schreiter U. Localization and responses of neurones in the parieto-insular vestibular cortex of awake monkeys (Macaca fascicularis). J Physiol 430: 537–557, 1990. doi: 10.1113/jphysiol.1990.sp018306. [DOI] [PMC free article] [PubMed] [Google Scholar]
- Gu Y, DeAngelis GC, Angelaki DE. A functional link between area MSTd and heading perception based on vestibular signals. Nat Neurosci 10: 1038–1047, 2007. doi: 10.1038/nn1935. [DOI] [PMC free article] [PubMed] [Google Scholar]
- Héroux ME, Law TC, Fitzpatrick RC, Blouin JS. Cross-modal calibration of vestibular afference for human balance. PLoS One 10: e0124532, 2015. doi: 10.1371/journal.pone.0124532. [DOI] [PMC free article] [PubMed] [Google Scholar]
- Jahn K, Naessl A, Schneider E, Strupp M, Brandt T, Dieterich M. Inverse U-shaped curve for age dependency of torsional eye movement responses to galvanic vestibular stimulation. Brain 126: 1579–1589, 2003a. doi: 10.1093/brain/awg163. [DOI] [PubMed] [Google Scholar]
- Jahn K, Naessl A, Strupp M, Schneider E, Brandt T, Dieterich M. Torsional eye movement responses to monaural and binaural galvanic vestibular stimulation: side-to-side asymmetries. Ann N Y Acad Sci 1004: 485–489, 2003b. doi: 10.1111/j.1749-6632.2003.tb00265.x. [DOI] [PubMed] [Google Scholar]
- Jamali M, Chacron MJ, Cullen KE. Self-motion evokes precise spike timing in the primate vestibular system. Nat Commun 7: 13229, 2016. doi: 10.1038/ncomms13229. [DOI] [PMC free article] [PubMed] [Google Scholar]
- Karmali F, Merfeld DM. A distributed, dynamic, parallel computational model: the role of noise in velocity storage. J Neurophysiol 108: 390–405, 2012. doi: 10.1152/jn.00883.2011. [DOI] [PMC free article] [PubMed] [Google Scholar]
- Kawato M. Internal models for motor control and trajectory planning. Curr Opin Neurobiol 9: 718–727, 1999. doi: 10.1016/S0959-4388(99)00028-8. [DOI] [PubMed] [Google Scholar]
- Khosravi-Hashemi N, Forbes PA, Dakin CJ, Blouin JS. Virtual signals of head rotation induce gravity-dependent inferences of linear acceleration. J Physiol 597: 5231–5246, 2019. doi: 10.1113/JP278642. [DOI] [PubMed] [Google Scholar]
- Kim J, Curthoys IS. Responses of primary vestibular neurons to galvanic vestibular stimulation (GVS) in the anaesthetised guinea pig. Brain Res Bull 64: 265–271, 2004. doi: 10.1016/j.brainresbull.2004.07.008. [DOI] [PubMed] [Google Scholar]
- Krauzlis RJ, Miles FA. Decreases in the latency of smooth pursuit and saccadic eye movements produced by the “gap paradigm” in the monkey. Vision Res 36: 1973–1985, 1996. doi: 10.1016/0042-6989(95)00307-X. [DOI] [PubMed] [Google Scholar]
- Kwan A, Forbes PA, Mitchell DE, Blouin J-S, Cullen KE. Neural substrates, dynamics and thresholds of galvanic vestibular stimulation in the behaving primate. Nat Commun 10: 1904, 2019. doi: 10.1038/s41467-019-09738-1. [DOI] [PMC free article] [PubMed] [Google Scholar]
- Lakens D. Equivalence tests: a practical primer for t tests, correlations, and meta-analyses. Soc Psychol Personal Sci 8: 355–362, 2017. doi: 10.1177/1948550617697177. [DOI] [PMC free article] [PubMed] [Google Scholar]
- Laurens J, Angelaki DE. The functional significance of velocity storage and its dependence on gravity. Exp Brain Res 210: 407–422, 2011. doi: 10.1007/s00221-011-2568-4. [DOI] [PMC free article] [PubMed] [Google Scholar]
- MacDougall HG, Brizuela AE, Burgess AM, Curthoys IS, Halmagyi GM. Patient and normal three-dimensional eye-movement responses to maintained (DC) surface galvanic vestibular stimulation. Otol Neurotol 26: 500–511, 2005. doi: 10.1097/01.mao.0000169766.08421.ef. [DOI] [PubMed] [Google Scholar]
- Mackenzie SW, Irving R, Monksfield P, Kumar R, Dezso A, Reynolds RF. Ocular torsion responses to electrical vestibular stimulation in vestibular schwannoma. Clin Neurophysiol 129: 2350–2360, 2018. doi: 10.1016/j.clinph.2018.08.023. [DOI] [PMC free article] [PubMed] [Google Scholar]
- Mackenzie SW, Reynolds RF. Ocular torsion responses to sinusoidal electrical vestibular stimulation. J Neurosci Methods 294: 116–121, 2018. doi: 10.1016/j.jneumeth.2017.11.012. [DOI] [PMC free article] [PubMed] [Google Scholar]
- MacNeilage PR, Banks MS, DeAngelis GC, Angelaki DE. Vestibular heading discrimination and sensitivity to linear acceleration in head and world coordinates. J Neurosci 30: 9084–9094, 2010. doi: 10.1523/JNEUROSCI.1304-10.2010. [DOI] [PMC free article] [PubMed] [Google Scholar]
- Mian OS, Dakin CJ, Blouin J-S, Fitzpatrick RC, Day BL. Lack of otolith involvement in balance responses evoked by mastoid electrical stimulation. J Physiol 588: 4441–4451, 2010. doi: 10.1113/jphysiol.2010.195222. [DOI] [PMC free article] [PubMed] [Google Scholar]
- Nakayama Y, Aoyama K, Kitao T, Maeda T, Ando H. How to use multi-pole galvanic vestibular stimulation for virtual reality application. Proceedings of the Virtual Reality International Conference—Laval Virtual. 2018: 22, 2018. doi: 10.1145/3234253.3234311. [DOI] [Google Scholar]
- Okada T, Grunfeld E, Shallo-Hoffmann J, Bronstein AM. Vestibular perception of angular velocity in normal subjects and in patients with congenital nystagmus. Brain 122: 1293–1303, 1999. doi: 10.1093/brain/122.7.1293. [DOI] [PubMed] [Google Scholar]
- Oppenländer K, Utz KS, Reinhart S, Keller I, Kerkhoff G, Schaadt A-K. Subliminal galvanic-vestibular stimulation recalibrates the distorted visual and tactile subjective vertical in right-sided stroke. Neuropsychologia 74: 178–183, 2015. doi: 10.1016/j.neuropsychologia.2015.03.004. [DOI] [PubMed] [Google Scholar]
- Otero-Millan J, Roberts DC, Lasker A, Zee DS, Kheradmand A. Knowing what the brain is seeing in three dimensions: a novel, noninvasive, sensitive, accurate, and low-noise technique for measuring ocular torsion. J Vis 15: 11, 2015. doi: 10.1167/15.14.11. [DOI] [PMC free article] [PubMed] [Google Scholar]
- Peters RM, Blouin JS, Dalton BH, Inglis JT. Older adults demonstrate superior vestibular perception for virtual rotations. Exp Gerontol 82: 50–57, 2016. doi: 10.1016/j.exger.2016.05.014. [DOI] [PubMed] [Google Scholar]
- Peters RM, Rasman BG, Inglis JT, Blouin JS. Gain and phase of perceived virtual rotation evoked by electrical vestibular stimuli. J Neurophysiol 114: 264–273, 2015. doi: 10.1152/jn.00114.2015. [DOI] [PMC free article] [PubMed] [Google Scholar]
- Preuss N, Ehrsson HH. Full-body ownership illusion elicited by visuo-vestibular integration. J Exp Psychol Hum Percept Perform 45: 209–223, 2019. doi: 10.1037/xhp0000597. [DOI] [PubMed] [Google Scholar]
- Ramachandran R, Lisberger SG. Transformation of vestibular signals into motor commands in the vestibuloocular reflex pathways of monkeys. J Neurophysiol 96: 1061–1074, 2006. doi: 10.1152/jn.00281.2006. [DOI] [PMC free article] [PubMed] [Google Scholar]
- Raphan T, Cohen B. Velocity storage and the ocular response to multidimensional vestibular stimuli. Rev Oculomot Res 1: 123–143, 1985. [PubMed] [Google Scholar]
- Raphan T, Cohen B. The vestibulo-ocular reflex in three dimensions. Exp Brain Res 145: 1–27, 2002. doi: 10.1007/s00221-002-1067-z. [DOI] [PubMed] [Google Scholar]
- Raphan T, Matsuo V, Cohen B. Velocity storage in the vestibulo-ocular reflex arc (VOR). Exp Brain Res 35: 229–248, 1979. doi: 10.1007/BF00236613. [DOI] [PubMed] [Google Scholar]
- Reynolds RF. Vertical torque responses to vestibular stimulation in standing humans. J Physiol 589: 3943–3953, 2011. doi: 10.1113/jphysiol.2011.209163. [DOI] [PMC free article] [PubMed] [Google Scholar]
- Robinson AP, Froese RE. Model validation using equivalence tests. Ecol Model 176: 349–358, 2004. doi: 10.1016/j.ecolmodel.2004.01.013. [DOI] [Google Scholar]
- Sadeghi SG, Chacron MJ, Taylor MC, Cullen KE. Neural variability, detection thresholds, and information transmission in the vestibular system. J Neurosci 27: 771–781, 2007. doi: 10.1523/JNEUROSCI.4690-06.2007. [DOI] [PMC free article] [PubMed] [Google Scholar]
- Schmid-Priscoveanu A, Straumann D, Kori AA. Torsional vestibulo-ocular reflex during whole-body oscillation in the upright and the supine position. I. Responses in healthy human subjects. Exp Brain Res 134: 212–219, 2000. doi: 10.1007/s002210000436. [DOI] [PubMed] [Google Scholar]
- Schneider AD, Jamali M, Carriot J, Chacron MJ, Cullen KE. The increased sensitivity of irregular peripheral canal and otolith vestibular afferents optimizes their encoding of natural stimuli. J Neurosci 35: 5522–5536, 2015. doi: 10.1523/JNEUROSCI.3841-14.2015. [DOI] [PMC free article] [PubMed] [Google Scholar]
- Schneider E, Glasauer S, Dieterich M. Central processing of human ocular torsion analyzed by galvanic vestibular stimulation. Neuroreport 11: 1559–1563, 2000. doi: 10.1097/00001756-200005150-00039. [DOI] [PubMed] [Google Scholar]
- Schneider E, Glasauer S, Dieterich M. Comparison of human ocular torsion patterns during natural and galvanic vestibular stimulation. J Neurophysiol 87: 2064–2073, 2002. doi: 10.1152/jn.00558.2001. [DOI] [PubMed] [Google Scholar]
- Seidman SH, Leigh RJ. The human torsional vestibulo-ocular reflex during rotation about an earth-vertical axis. Brain Res 504: 264–268, 1989. doi: 10.1016/0006-8993(89)91366-8. [DOI] [PubMed] [Google Scholar]
- Seidman SH, Leigh RJ, Tomsak RL, Grant MP, Dell’Osso LF. Dynamic properties of the human vestibulo-ocular reflex during head rotations in roll. Vision Res 35: 679–689, 1995. doi: 10.1016/0042-6989(94)00151-B. [DOI] [PubMed] [Google Scholar]
- Shaikh AG, Palla A, Marti S, Olasagasti I, Optican LM, Zee DS, Straumann D. Role of cerebellum in motion perception and vestibulo-ocular reflex-similarities and disparities. Cerebellum 12: 97–107, 2013. doi: 10.1007/s12311-012-0401-7. [DOI] [PMC free article] [PubMed] [Google Scholar]
- Sinha N, Zaher N, Shaikh AG, Lasker AG, Zee DS, Tarnutzer AA. Perception of self motion during and after passive rotation of the body around an earth-vertical axis. Prog Brain Res 171: 277–281, 2008. doi: 10.1016/S0079-6123(08)00639-0. [DOI] [PubMed] [Google Scholar]
- St George RJ, Day BL, Fitzpatrick RC. Adaptation of vestibular signals for self-motion perception. J Physiol 589: 843–853, 2011. doi: 10.1113/jphysiol.2010.197053. [DOI] [PMC free article] [PubMed] [Google Scholar]
- Su YY, Chiou WY, Weng PK, Wang HW. Computerized rotational vestibular testing in normal subjects. Zhonghua Yi Xue Za Zhi (Taipei) 63: 377–383, 2000. [PubMed] [Google Scholar]
- Tisserand R, Dakin CJ, Van der Loos MH, Croft EA, Inglis TJ, Blouin JS. Down regulation of vestibular balance stabilizing mechanisms to enable transition between motor states. eLife 7: e36123, 2018. doi: 10.7554/eLife.36123. [DOI] [PMC free article] [PubMed] [Google Scholar]
- Tweed D, Fetter M, Sievering D, Misslisch H, Koenig E. Rotational kinematics of the human vestibuloocular reflex. II. Velocity steps. J Neurophysiol 72: 2480–2489, 1994. doi: 10.1152/jn.1994.72.5.2480. [DOI] [PubMed] [Google Scholar]
- Watson SRD, Brizuela AE, Curthoys IS, Colebatch JG, MacDougall HG, Halmagyi GM. Maintained ocular torsion produced by bilateral and unilateral galvanic (DC) vestibular stimulation in humans. Exp Brain Res 122: 453–458, 1998. doi: 10.1007/s002210050533. [DOI] [PubMed] [Google Scholar]
- Welgampola MS, Ramsay E, Gleeson MJ, Day BL. Asymmetry of balance responses to monaural galvanic vestibular stimulation in subjects with vestibular schwannoma. Clin Neurophysiol 124: 1835–1839, 2013. doi: 10.1016/j.clinph.2013.03.015. [DOI] [PMC free article] [PubMed] [Google Scholar]
- Wilkinson D, Zubko O, Sakel M, Coulton S, Higgins T, Pullicino P. Galvanic vestibular stimulation in hemi-spatial neglect. Front Integr Neurosci 8: 4, 2014. doi: 10.3389/fnint.2014.00004. [DOI] [PMC free article] [PubMed] [Google Scholar]
- Yakushin SB, Raphan T, Cohen B. Coding of velocity storage in the vestibular nuclei. Front Neurol 8: 386, 2017. doi: 10.3389/fneur.2017.00386. [DOI] [PMC free article] [PubMed] [Google Scholar]