Abstract
A liquid chromatography electrospray ionization tandem mass spectrometry (LC/ESI–MS/MS) method was developed and validated to measure GDC-0084 in human plasma and cerebrospinal fluid (CSF). Reverse-phase chromatography with gradient elution was performed by using a C18 column (50 × 2.0 mm, 3 μm). Solid-phase extraction of plasma and CSF was employed to give excellent recovery. MS detection was performed with positive ion screening in multiple reaction monitoring mode. The precursor to the product ions (Q1→Q3) selected for GDC-0084 and GDC-0084-d6 were 383.2→353.2 and 389.2→353.2, respectively. A separate calibration curve was established for human plasma and CSF. Both calibration curves, ranging from 0.2 to 200 ng/mL, were linear and had acceptable intra-day and inter-day precision and accuracy. The lower limit of quantitation and limit of detection for GDC-0084 in human plasma were 0.2 ng/mL (signal/noise ≥ 47) and 0.005 ng/mL (signal/noise ≥ 3.5), respectively, and for GDC-0084 in human CSF were 0.2 ng/mL (signal/noise ≥ 19.7) and 0.04 ng/mL (signal/noise ≥ 7.2). This method was successfully applied to analyze serial plasma samples obtained from children with diffuse intrinsic pontine gliomas and other midline gliomas who participated in pharmacokinetic studies as part of a phase I clinical trial of GDC-0084.
Keywords: GDC-0084, LC-MS/MS, pediatric high-grade glioma, PI3K, solid-phase extraction
1 |. INTRODUCTION
Pediatric high-grade gliomas are highly aggressive, but currently available therapies yield limited clinical benefit (MacDonald, Aguilera, & Kramm, 2011; Ostrom et al., 2015). Diffuse intrinsic pontine gliomas (DIPG) remain the most common cause of death in children with brain cancer (Vanan & Eisenstat, 2015). The phosphatidylinositol 3-kinase (PI3K) pathway is a promising target for the treatment of gliomas because genetic alterations activating and dysregulating this pathway frequently occur in DIPG and other midline gliomas (Mueller et al., 2012; Wu et al., 2014).
GDC-0084 is a potent, orally administered, and selective purine-based, small-molecule inhibitor of class I PI3K and mammalian target of rapamycin kinase. GDC-0084 is currently under development as a therapeutic agent for brain cancer (Heffron et al., 2016). It was specifically designed to be brain penetrant, in contrast with many current therapies for gliomas (Salphati et al., 2016). GDC-0084 inhibits the PI3K pathway in both in vitro and in vivo models, arresting cell division and inducing apoptosis. Consequently, GDC-0084 markedly prevents tumor growth in mouse xenograft models of human adult glioma (Heffron et al., 2016; Salphati et al., 2016).
GDC-0084 is currently under evaluation in a phase I study of pediatric patients with newly diagnosed DIPG or other diffuse midline gliomas after receiving standard-of-care radiation therapy (SJPI3K; ClinicalTrials.gov number ). Pharmacokinetic studies are performed in all patients enrolled in this trial, which therefore required development of an accurate and precise bioanalytical assay to measure GDC-0084 plasma and CSF concentrations. Because the pharmacokinetic disposition of GDC-0084 is not known in pediatric patients, it was essential that a sensitive, specific, and robust method was developed for use in the clinical pharmacokinetic studies. Therefore, the objective of this study was to develop and validate a sensitive and robust liquid chromatography electrospray ionization tandem mass spectrometry (LC/ESI–MS/MS) method. Then this method was applied to measure GDC-0084 in plasma samples collected from children enrolled on the clinical protocol SJPI3K.
2 |. EXPERIMENTAL
2.1 |. Reagents
The chemicals 5-(6,6-dimethyl-4-morpholino-8,9-dihydro-6H-[1,4]oxazino[4,3-e]-purin-2-yl)pyrimidin-2-amine (GDC-0084; Figure 1a) and 5-(6,6-bis(methyl-d3)-4-morpholino-8,9-dihydro-6H-[1,4]oxazino[4,3-e]-purin-2-yl)pyrimidin-2-amine [GDC-0084-d6, internal standard (ISTD); Figure 1b] were from Genentech (San Francisco, CA, USA). Ammonium formate (MS grade, ≥ 99.0%) was purchased from Millipore Sigma (St. Louis, MO, USA). Dimethyl sulfoxide (molecular biology grade), formic acid (LC-MS/MS grade, 99.5% purity), acetonitrile (ACN) (HPLC grade), and methanol (HPLC grade) were purchased from Fisher Scientific (Waltham, MA, USA). The Millipore Q-advantage water purification system (Temecula, CA, USA) was used to prepare the water used in all experiments. Human whole blood and human plasma, with K2-EDTA as an anticoagulant, and human CSF were purchased from BioIVT (Westbury, NY, USA).
FIGURE 1.
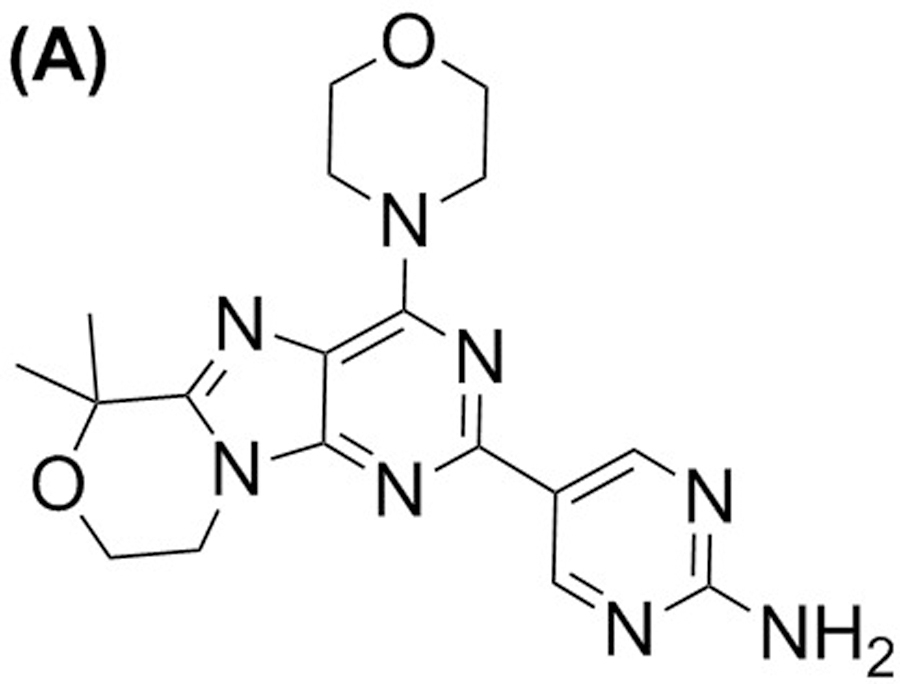
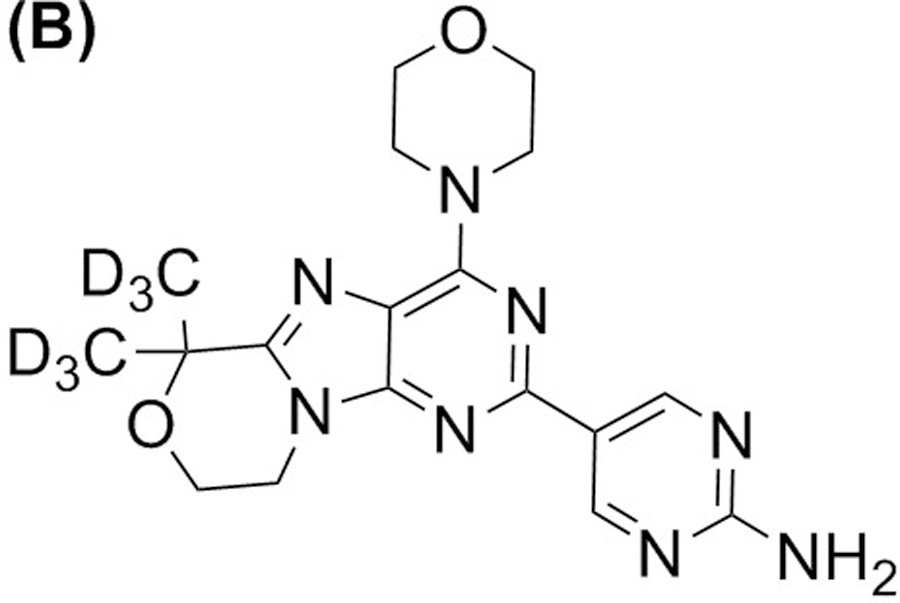
Structure of GDC-0084 (a) and ISTD, GDC-0084-d6 (b).
2.2 |. Stock and working solutions
The GDC-0084 stock solution (1.00 mg/mL) was prepared in DMSO, and GDC-0084-d6 stock solution (0.20 mg/mL) was prepared in ACN/H2O (1:1, v/v). GDC-0084 working solutions were prepared, with concentrations ranging from 1 to 1000 ng/mL, by serially diluting the stock solution with ACN/H2O (1:1, v/v). The ISTD working solution was prepared by diluting the GDC-0084-d6 stock solution with ACN/H2O (1:1, v/v) to achieve 200 ng/mL.
2.3 |. Calibration and quality control
To generate a calibration curve with a range of 0.2 to 200 ng/mL concentrations, eight calibration standards were prepared by spiking 10 µL of the GDC-0084 working solution into 50 µL blank human plasma or CSF to yield concentrations of GDC-0084 at 0.2, 1, 2, 5, 25, 50, 100, and 200 ng/mL. The corresponding GDC-0084 quality control (QC) samples of three concentration levels were prepared in the same matrix in a similar manner at 0.5, 10, and 160 ng/mL, respectively. Then the calibration standards and QC samples were submitted to the sample preparation procedures described below.
2.4 |. Sample preparation
Solid-phase extraction (SPE) was used to prepare 50 µL aliquots of study samples (human plasma or CSF) for analysis. We added 6 µL of ISTD working solution to study samples and the corresponding calibration standards and quality controls, and then 10 µL of ACN/H2O (1:1, v/v) was added to study samples for volume correction. Oasis HLB 96-well plates (Waters Corporation, MA, USA) were conditioned with 1 mL of methanol and then 2 mL of H2O. All samples were diluted with 50 µL of H2O to facilitate elution and then loaded into the well plates, followed by washing with 200 µL of MeOH/H2O (5:95, v/v). The analyte and ISTD samples were eluted from the plates with 100 µL of ACN/H2O (1:1, v/v). Eluates were collected in 96-well plates, to which 50 µL of H2O was added for dilution. Then 1 µL of sample extracts was injected into the LC-MS/MS system for analysis.
2.5 |. Chromatography
A Shimadzu HPLC system (Kyoto, Japan) was employed, containing an online degasser (DGU-20A), two pumps (LC-30 AD), an autosampler (SIL-30AC), a controller (CBM-20A), and a column oven (CTO-20AC). Chromatographic separation was performed on a Gemini C18 column (50 × 2.0 mm, 3 μm) with a C18 Cartridge (4 × 2.0 mm) from Phenomenex (Torrance, CA, USA). The column temperature was maintained at 30°C and an optimized gradient of mobile phase A (10 mM ammonium formate) and mobile phase B (ACN) was used to elute the analytes of interest. The total flow rate was 0.5 mL/min and the gradient elution started with 30% mobile phase B, gradually increased to 40% in 1 min, 70% in 0.7 min, and 90% in 0.1 min. Then mobile phase B maintained at 90% for 1 min, decreased it to 30% in 0.1 min, and equilibrated the column for 1.1 min. By using a sample diverter valve, the LC fraction from 1.2 to 1.8 min that contained GDC-0084/ISTD was delivered to the mass spectrometer’s ESI source. To flush the flow line, the fraction from 3.5 to 4.0 min was also delivered to the mass spectrometer. All other fractions were sent to the waste container. The total run time was 4 min. To avoid sample carryover from the injection needle, the needle was washed before and after sample aspiration with ACN/H2O/formic acid (50:50:0.1, v/v/v).
2.6 |. Mass spectrometry
MS detection was performed by using an AB Sciex QTRAP 5500 system (Toronto, Canada) with an ESI source. Positive ion modes and MRM were used with transitions at m/z 383.2→353.2 for GDC-0084 and m/z 389.2→353.2 for GDC-0084-d6, and a dwell time for both transitions of 200 msec. The ion source parameters were optimized as follows: ionspray voltage, 4500 V; source temperature, 650°C; curtain gas, 45 psi; gas 1 (GS1), 65 psi; gas 2 (GS2), 55 psi; and collision-activated dissociation, medium. Compound parameters were as follows: declustering potential (DP), 80 V; entrance potential, 10 V; collision energy (CE), 50 V; collision exit potential (CXP), 30 V. Data were acquired and processed with Analyst software (version, 1.6.2, AB Sciex, Framingham, MA, USA).
2.7 |. Method validation
Following the Guidance for Industry, Bioanalytical Method Validation, May 2018, this LC MS/MS method was validated in terms of linearity, precision and accuracy, dilution integrity, lower limit of quantitation, limit of detection, sensitivity, matrix effects, recovery, stability, and incurred sample reanalysis (Guidance for Industry, Bioanalytical Method Validation, May 2018).
2.7.1 |. Linearity
Linearity was tested by analyzing 13 human plasma calibration curves and 6 CSF curves, which were generated during the entire validation process. Each calibration curve was established by using freshly prepared samples, including double blank (i.e., blank matrix without GDC-0084 or ISTD), zero blank (i.e., blank matrix with ISTD only), and eight nonblank calibration standards with various concentrations. The peak area ratio of GDC-0084 to ISTD was plotted against the GDC-0084 concentration (x) and fitted by using least squares linear regression analysis weighted with 1/x2. To evaluate the linearity and reproducibility of the calibration curves, the correlation coefficient (R2) and slope were determined for each calibration curve.
2.7.2 |. Precision and accuracy and dilution integrity
The accuracy and precision of the calibration range were evaluated for human plasma and CSF on a single day (i.e., intra-day, n = 6) and on three different days (i.e., inter-day, n = 18). For each run, six QC replicate samples were analyzed at four concentrations, including the lower limit of quantification (LLOQ, 0.2 ng/mL), low quality control (LQC, 0.5 ng/mL), middle quality control (MQC, 10 ng/mL), and high quality control (HQC, 160 ng/mL) concentrations, with a freshly prepared calibration curve. The inter-assay and intra-assay precision were expressed as the percentage coefficient of variance (%CV) and the overall accuracy as follows: (mean observed concentration)/(nominal concentration) × 100.
Dilution integrity was validated for human plasma samples by analyzing QC samples at a concentration several times higher than that of HQC in the plasma curve. GDC-0084 samples in human plasma at 320 and 800 ng/ml were prepared in six replicates respectively. The accuracy and precision were determined after 2- and 5-times dilution by blank human plasma respectively to bring the concentration below the upper limit of quantitation. Dilution integrity was not validated for human CSF samples since the GDC-0084 concentration in human CSF is not expected to exceed the upper limit of quantitation (200 ng/ml).
2.7.3 |. Lower limit of quantification and limit of detection
The LLOQ was defined as the lowest concentration in the calibration curve. The LLOQ was expected to meet the criteria of accuracy (i.e., ranging from 80%–120%) and precision (i.e., < 20%) and a signal-to-noise (S/N) ratio in chromatographic peaks > 5. The LOD was the lowest analyte concentration in the matrix with an S/N ≥ 3. The processing script in the Analyst software was used to calculate the S/N of the chromatographic peaks.
2.7.4 |. Selectivity, matrix effect, and recovery
Selectivity was determined by analyzing the LLOQ and blank samples in six different lots of human plasma and CSF. This allowed us to verify that the GDC-0084 and ISTD molecules were adequately separated from other molecules in human plasma and CSF that may interfere with our analyses. The matrix effect is defined as the degree to which the components in the sample matrix affect analyte detection. The matrix effects were determined by calculating the peak area ratios of the post extraction-spiked samples to the solvent-spiked samples. The matrix effects were evaluated for two concentrations (LQC and HQC) of GDC-0084 in human plasma and CSF obtained from six different sources. Recovery was determined by comparing the peak areas of the extracted samples with those of the corresponding post extraction-spiked samples. The extraction efficiency and reproducibility were assessed for GDC-0084 from human plasma and CSF by SPE at two different concentrations (LQC and HQC).
2.7.5|. Stability
The short-term stability of GDC-0084 in human plasma and CSF at 4°C and room temperature was evaluated up to 24 h and its long-term stability in human plasma at −80°C for a year (~355 days). Human plasma and CSF samples with GDC-0084 concentrations at 0.5 ng/mL or 160 ng/mL were prepared and aliquoted in 50 µL. Immediately three sample aliquots for each concentration were analyzed after preparation to establish baseline values. All of the other aliquots were stored until analysis with the different conditions corresponding to the various stability tests. Freeze–thaw stability test was to subject the spiked samples to three freeze–thaw cycles, with at least 12 hours at −80°C between cycles. To assess extract stability, the extracted LQC and HQC samples were stored at 4°C in the autosampler post analysis and reinjected them after 24, 48, and 96h.
The stability of GDC-0084 in human whole blood samples was evaluated for up to 24 h at 4°C. Human whole blood was spiked with GDC-0084 at 0.5 ng/mL and 160 ng/mL and then stored at 4°C. At 0, 1, and 24 h, 0.5 mL of whole blood was transferred to centrifuge tubes and centrifuged them at 9400 g for 2 min. The resulting separated plasma was analyzed for GDC-0084 concentrations in triplicate.
The stability of GDC-0084 in DMSO and ACN/H2O (1:1, v/v) were assessed by comparing old and fresh solutions, which were subjected to the same dilution to concentrations suitable for injection into the LC-MS/MS system.
2.7.6 |. Incurred sample reanalysis (ISR)
To verify the reliability of the reported GDC-0084 concentration in the patient samples, ISR was carried out by reanalysis of a subset of patient samples when analyzing new patient samples. Incurred samples were chosen so that their concentrations covered the expected concentration range of patient samples. The difference between initial measurement and repeat were determined as follows: (original-repeat)/mean.
2.8 |. Method application to patient pharmacokinetic samples
Serial plasma samples for pharmacokinetic studies of GDC-0084 were obtained as part of the pediatric phase I clinical trial . These samples were analyzed to demonstrate the applicability of the method described above. After administration of an oral dose of GDC-0084 (27 mg/m2) on Day 1 of Course 1 of therapy, 2.0 mL of whole blood was collected in BD Vacutainer K2-EDTA tubes (BD, Franklin Lakes, NJ) at the following times: predose, 1, 2, 4, 8 (± 1), 24 (± 4), and 48 (± 6) h post dose. Then the blood samples was immediately transferred to centrifuge tubes and centrifuged for 2 min at 9400 g. The resulting plasma supernatants were stored at –80°C until analysis.
After bioanalysis, GDC-0084 concentration–time data were analyzed with a classic compartmental pharmacokinetic approach by using the maximum likelihood estimation implemented in ADAPT 5 (Mould, Walz, Lave, Gibbs, & Frame, 2015). The pharmacokinetic parameters of interest, such as drug clearance and area under the concentration curve (AUC0−∞), were model derived.
3 |. RESULTS AND DISCUSSION
3.1 |. Mass spectrometry and chromatography
GDC-0084 and ISTD in ACN/H2O (1:1, v/v) was directly infused into the mass spectrometer to determine the MS parameters for compound detection. Based on the characteristics of their chemical structure, the positive ion mode was used for detection. A molecular ion [M+H]+ at 383.2 was observed for GDC-0084 and [M+H]+ at 389.2 for ITSD (Figure 2). For both GDC-0084 and ISTD, the most abundant and structurally informative product ion with an m/z of 353.2 was observed and proposed as the loss of the 6,6-dimethyl group in GDC-0084 and 6,6-bis(methyl-d3) in ISTD. Therefore, the MRM transitions of m/z 383.2→353.2 and m/z 389.2→353.2 were used to quantify GDC-0084 and ISTD, respectively. Then compound parameters, such as DP, CE, and CXP, were manually optimized for both MRM transitions.
FIGURE 2.
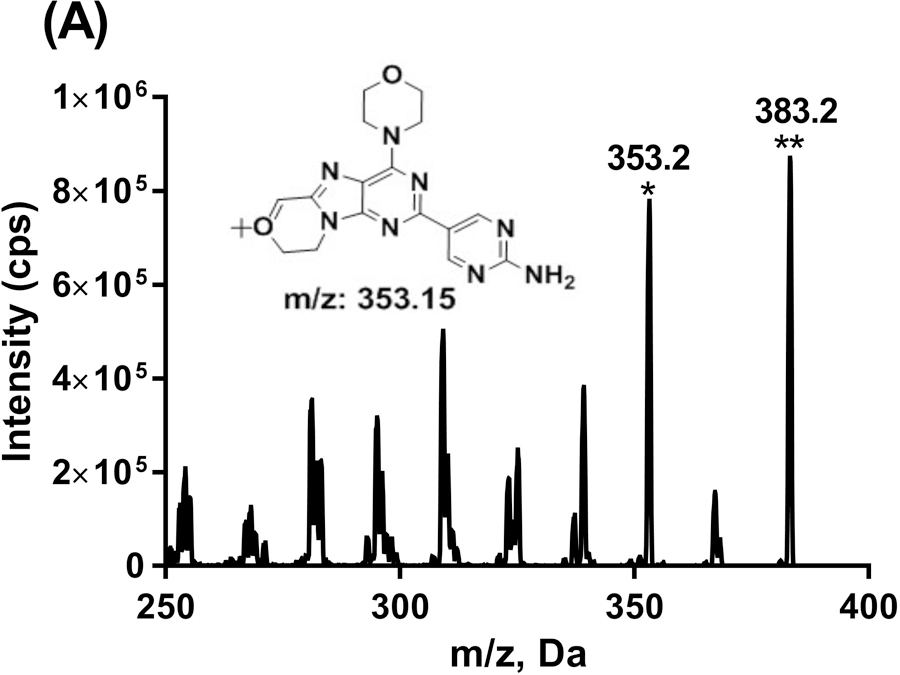
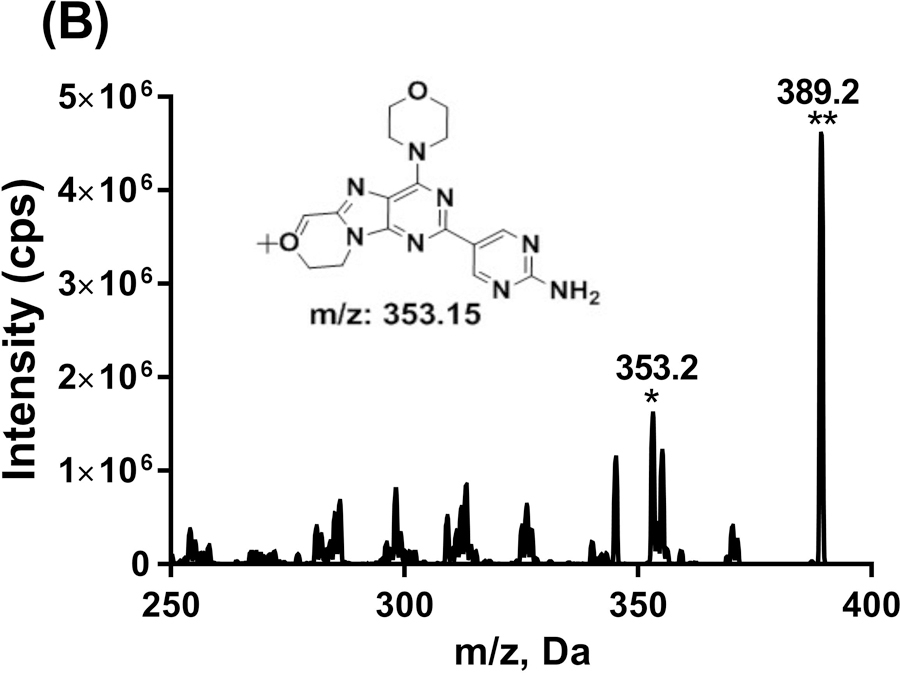
Product ion scans for GDC-0084 (a) and ISTD, GDC-0084-d6 (b). The proposed structure for the most abundant product ion was shown as inserted. *Product ion. **Parent ion.
GDC-0084 and ISTD displayed symmetrical chromatographic peaks, with a retention time at 1.5 min on the Gemini C18 column. Once the mobile phases and elution gradients were determined, GDC-0084 was infused into the mass spectrometer again, with the mobile phase flow (i.e., 0.5 mL/min) from the LC by using a tee union. With detection mode set as MRM (m/z 383.2→353.2), the ESI source parameters, including IS, TEM, GS1, and GS2, further fine-tuned.
3.2 |. Sample preparation
SPE was used for the preparation of both plasma and CSF samples. SPE is easier to automate for high-sample throughput than liquid–liquid extraction. SPE also does not require using a large volume of toxic organic solvents, such as t-butyl methyl ether, ethyl acetate, or hexane, to provide high recovery for polar analytes. Oasis HLB 96-well plates was utilized to extract GDC-0084 from 50 µL samples of plasma or CSF. Through hydrophobic and polar–polar interactions, GDC-0084 exhibited a strong retention to the plates. Elution with ACN/H2O (1:1, v/v) provided high and consistent recovery. Due to the small volume of eluate and its compatibility with the chromatography condition, no drying eluate or reconstitution is necessary.
3.3 |. Linearity
The calibration range (0.2–200 ng/mL) was linear (R2 ≥ 0.996) for a total of 13 human plasma curves and 6 CSF curves. The mean (CV%) of the slopes was 0.113 (9.6) for plasma curves and 0.096 (1.6) for CSF curves. For each calibration curve, all of the nonzero calibration standards met the acceptance criteria of accuracy. These data indicate that the calibration curve was continuous and reproducible.
3.4 |. Precision and accuracy, and dilution integrity
For human plasma, the intra-day precision ranged from 1.4% to 3.2%, the inter-day precision from 3.2% to 4.6%, intra-day accuracy from 98.1% to 104.0%, and the inter-day accuracy from 100.6% to 107.0%. For human CSF, the intra-day precision ranged from 1.2% to 4.0%, the inter-day precision from 2.0% to 9.3%, intra-day accuracy from 97.5% to 104.5%, and the inter-day accuracy from 93.8% to 97.0% (Table 1). This method meets the acceptance criteria for precision and accuracy for both plasma and CSF.
TABLE 1.
Intra-day (n = 6) and inter-day (n = 18) precision and accuracy for QC samples of GDC-0084 in human plasma and CSF
| Intra-day |
Inter-day |
||||||
|---|---|---|---|---|---|---|---|
| Nominal (ng/mL) | Mean Concentration (ng/mL) | %CV | %Accuracy | Mean Concentration (ng/mL) | %CV | %Accuracy | |
| Human Plasma | 0.2 | 0.208 | 1.4 | 104.0 | 0.211 | 4.2 | 105.5 |
| 0.5 | 0.520 | 1.4 | 104.0 | 0.530 | 3.2 | 105.8 | |
| 10 | 10.3 | 3.2 | 103.0 | 10.7 | 4.6 | 107.0 | |
| 160 | 157 | 1.8 | 98.1 | 161 | 3.9 | 100.6 | |
| Human CSF | 0.2 | 0.209 | 4.0 | 104.5 | 0.189 | 9.3 | 94.5 |
| 0.5 | 0.494 | 1.7 | 98.8 | 0.469 | 4.7 | 93.8 | |
| 10 | 9.84 | 1.4 | 98.4 | 9.70 | 2.1 | 97.0 | |
| 160 | 156 | 1.2 | 97.5 | 154 | 2.0 | 96.3 | |
CV, coefficient of variation.
Dilution integrity was evaluated for GDC-0084 in human plasma samples. For dilution factors (2 and 5), which may be used during the study, the accuracy for the corresponding diluted samples was 101.8% and 104.1%, while the precision was 4.9% and 2.5%.
3.5 |. Lower limit of quantification and limit of detection
Assessing the LLOQs in six different sources of matrix demonstrated a precision of 3% and accuracy of 99.2% for human plasma, 6.4% and 85.1% for human CSF. The lower limit of quantitation and limit of detection for GDC-0084 in human plasma were 0.2 ng/mL (signal/noise ≥ 47) and 0.005 ng/mL (signal/noise ≥ 3.5), respectively, and for GDC-0084 in human CSF were 0.2 ng/mL (signal/noise ≥ 19.7) and 0.04 ng/mL (signal/noise ≥ 7.2).
3.6 |. Selectivity, matrix effects, and recovery
To evaluate the selectivity of the GDC-0084 method, blank human plasma and CSF from six different sources were analyzed. Chromatograms of blank human plasma and LLOQ samples in human plasma are shown in Figure 3. By visual inspection, no interfering peaks coeluted with GDC-0084 or ISTD in the blank human plasma samples from various sources. No interference was observed in six different sources of human CSF (data not shown).
FIGURE 3.
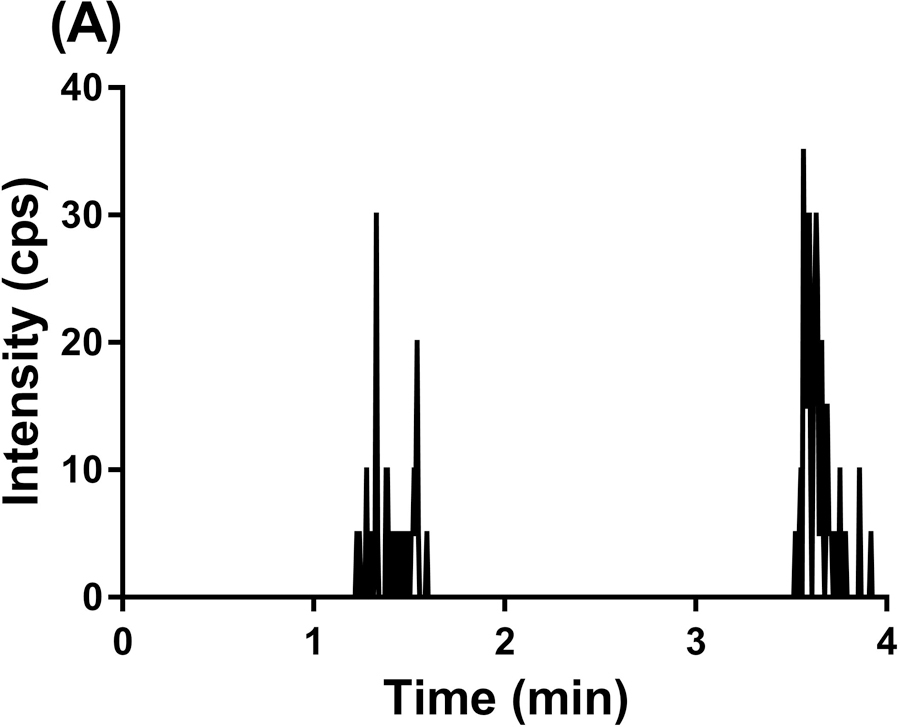
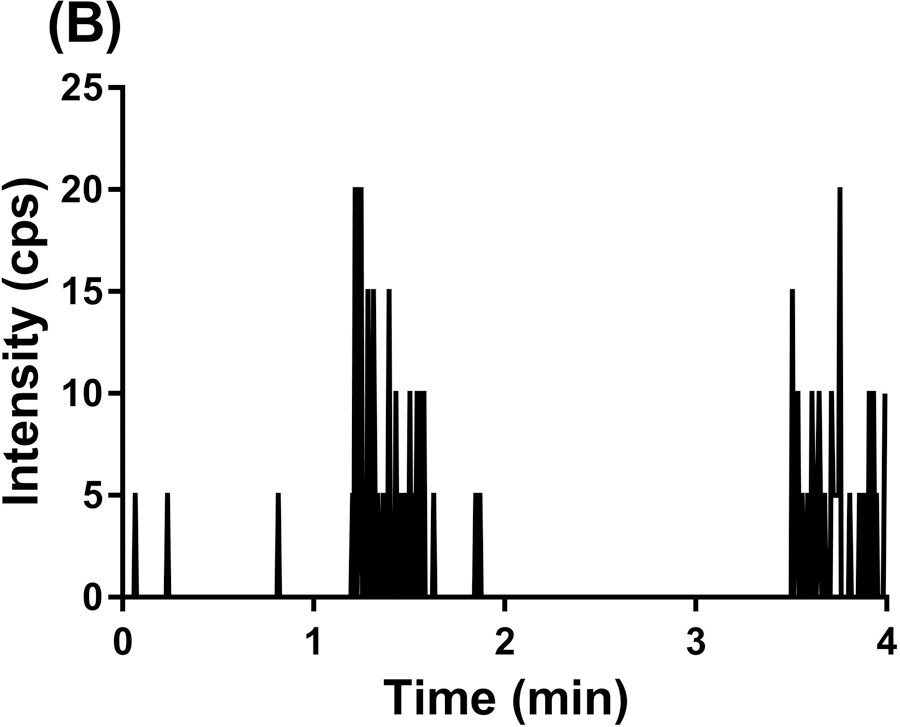
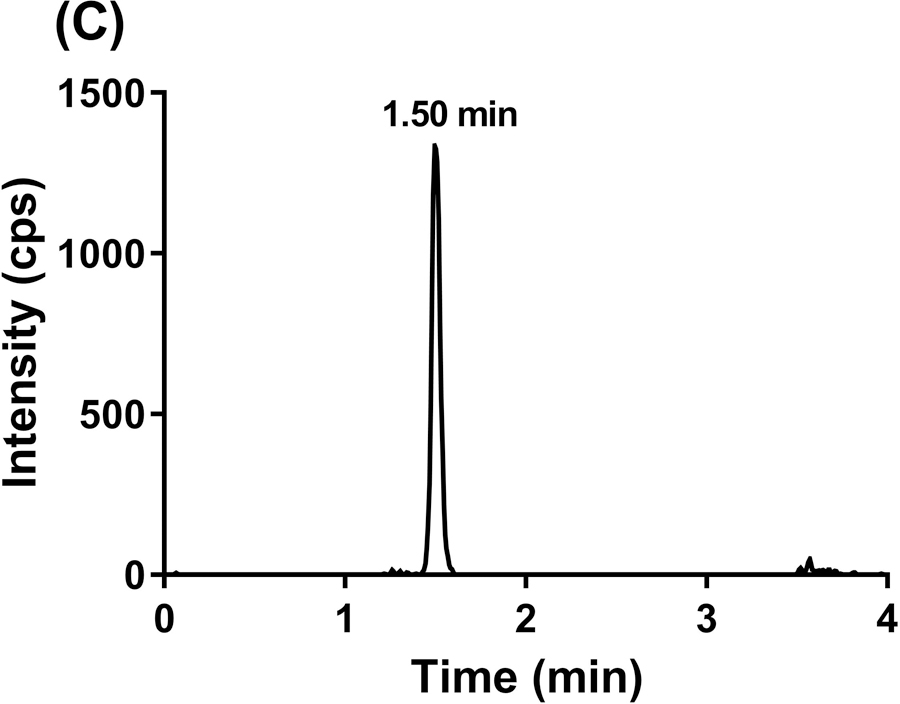
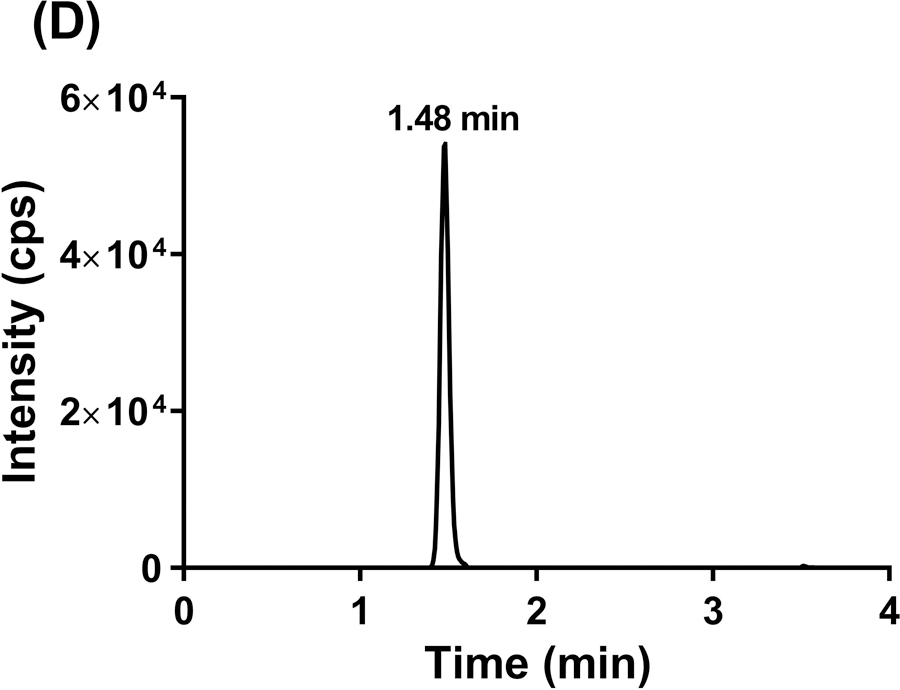
Representative MRM chromatograms of GDC-0084 scan in blank human plasma (a), ISTD scan in blank human plasma (b), GDC-0084 scan in LLOQ (0.2 ng/mL) human plasma sample (c), and ISTD scan in LLOQ (0.2 ng/mL) human plasma sample (d).
The matrix effects and extraction efficiencies were evaluated at two concentrations. As shown in Table 2, human CSF did not have any matrix effects for GDC-0084 and ISTD, whereas human plasma showed moderate matrix effects for both compounds. The average matrix factors (MFs) for GDC-0084 at LQC and HQC in six different sources of human plasma were 1.85 and 1.71, respectively, whereas the average MF for ISTD ranged from 1.49 to 1.64. The ISTD-normalized MF was approximately 1.1, suggesting that ISTD can compensate for the matrix effects. Additionally, the matrix effects did not cause quantitation biases, as evidenced by the %CV and %nominal values. Therefore, we did not attempt to further minimize the matrix effects. The recovery of GDC-0084 from human plasma was 83% to 99%, demonstrating marked consistency for two different concentrations (0.5 and 160 ng/mL). A similarly high level of recovery was also observed for ISTD in human plasma. Additionally, the recovery of GDC-0084 and ISTD in human CSF was efficient and consistent.
TABLE 2.
Matrix effects and recovery in human plasma and CSF
| Concentration (ng/mL) |
aMatrix Factor |
%Recovery |
|||||||
|---|---|---|---|---|---|---|---|---|---|
| GDC-0084 |
bISTD |
GDC-0084 |
bISTD |
||||||
| cMean | CV% | cMean | CV% | dMean | CV% | dMean | CV% | ||
| Human plasma | 0.5 | 1.85 | 9.2 | 1.64 | 8.5 | 83.2 | 16.8 | 86.8 | 12.8 |
| 160 | 1.71 | 8.2 | 1.49 | 6.7 | 99.1 | 6.9 | 100.0 | 6.6 | |
| Human CSF | 0.5 | 1.01 | 2.0 | 1.02 | 2.0 | 110.9 | 5.9 | 101.5 | 2.0 |
| 160 | 1.02 | 2.0 | 1.01 | 2.0 | 107.5 | 2.3 | 101.9 | 4.4 | |
Matrix effects and recovery were evaluated for GDC-0084 at human plasma and CSF at two concentration levels (0.5 and 160 ng/mL).
ISTD was fixed at a concentration of 24 ng/mL.
Mean matrix factors of six lots of human plasma and CSF.
Mean recovery from one lot of human plasma in six replicates.
3.7 |. Stability
The stability findings of GDC-0084 in human plasma and CSF are shown in Table 3. GDC-0084 is stable up to 24 h in human plasma and CSF at 4°C and room temperature. It was also observed that GDC-0084 was stable up to 355 days in human plasma and up to 7 days in human CSF when stored at –80°C, and up to three freeze–thaw cycles in both human plasma and CSF. The human plasma extracts and CSF extracts were stable at 4°C in the autosampler up to 48 h and 96 h respectively, thereby permitting reinjection of the samples for reanalysis.
TABLE 3.
Stability of GDC-0084 in human plasma and whole blood
| Matrix | Storage condition | 0.5 ng/mL |
160 ng/mL |
|||
|---|---|---|---|---|---|---|
| Mean (%CV) | %Change | Mean (%CV) | %Change | |||
| Human plasma | 4°C, 24 h | 0.502 (0.5) | −3.5 | 166 (2.8) | 7.8 | |
| RT, 24 h | 0.516 (0.9) | −0.2 | 164 (2.3) | 7.9 | ||
| −80°C, 355 days | 0.547 (0.4) | 6.4 | 163 (4.3) | 4.7 | ||
| Three F/T cycles | 0.489 (1.2) | −4.9 | 144 (2.2) | −7.1 | ||
| Extracts, 4°C, 24 h | 0.499 (1.6) | −2.2 | 160 (1.6) | 2.6 | ||
| Extracts, 4°C, 48 h | 0.506 (1.8) | −0.8 | 157 (1.6) | 0.6 | ||
| Human whole blood | 4°C, 0 h | 0.318 (2.4) | aND | 108 (1.1) | aND | |
| 4°C, 1 h | 0.315 (1.0) | −1.2 | 107 (0.5) | −1.5 | ||
| 4°C, 24 h | 0.369 (4.6) | 15.8 | 124 (0.8) | 14.5 | ||
| Human CSF | 4°C, 24 h | 0.469 (1.5) | −7.6 | 153 (3.0) | −1.5 | |
| RT, 24 h | 0.479 (1.8) | −5.5 | 154 (2.0) | −0.2 | ||
| −80°C, 7 days | 0.499 (4.4) | 0.27 | 155 (0.7) | 0.0 | ||
| Three F/T cycles | 0.506 (7.4) | 3.1 | 156 (2.1) | 1.1 | ||
| Extracts, 4°C, 24 h | 0.501 (4.4) | 0.6 | 154 (1.5) | −0.9 | ||
| Extracts, 4°C, 96 h | 0.458 (3.7) | −8.0 | 153 (1.0) | −1.5 | ||
ND, not determined.
Since plasma sample is separated from whole blood, the stability of GDC-0084 in whole blood and its binding/partition to cellular components may significantly affect GDC-0084 concentration in plasma. The stability of GDC-0084 in whole blood was evaluated by analyzing the plasma which was separated from the GDC-0084 spiked whole blood at each time point. At time 0, the measured plasma concentration was considerably lower than in the spiked whole blood concentration for both low and high levels, which may be attributed to strong partitioning of the drug into red blood cells. At 1 h, the plasma concentration was comparable to that of time 0. However, after 24 h, the plasma concentration increased by approximately 15%. This suggests that the drug was released or dissociated from the lysed cells, potentially increasing plasma GDC-0084 concentrations. This whole blood stability data may provide insight for GDC-0084 sample collection.
The stability of GDC-0084 master stock solution in DMSO and of the working solution in ACN/H2O (1:1, v/v) was also determined (data not shown). GDC-0084 in DMSO and ACN/H2O (1:1, v/v) was stable at –80°C up to 353 and 381 days, respectively.
3.8 |. Application of method to clinical sample analysis
GDC-0084 plasma was collected from a child enrolled in the clinical trial on Day 1, Course 1 of therapy. Then these samples were analyzed with our validated LC/ES–MS/MS method. The one-compartment model parameterized with an absorption rate constant, apparent clearance, and apparent volume of distribution was fitted to the GDC-0084 concentration–time data. The representative plasma concentration–time curve for this patient is shown in Figure 4 and includes both the observed data and model predictions, demonstrating the applicability of the method. The patient’s apparent oral clearance and the AUC0−∞ of GDC-0084 were estimated to be 10.6 L/h/m2 and 2426 ng·h/mL, respectively. The quantification of the GDC-0084 AUC0−∞ is valuable for future studies investigating the association between drug plasma exposure and toxicity or response in our population of children with brain tumors.
FIGURE 4.
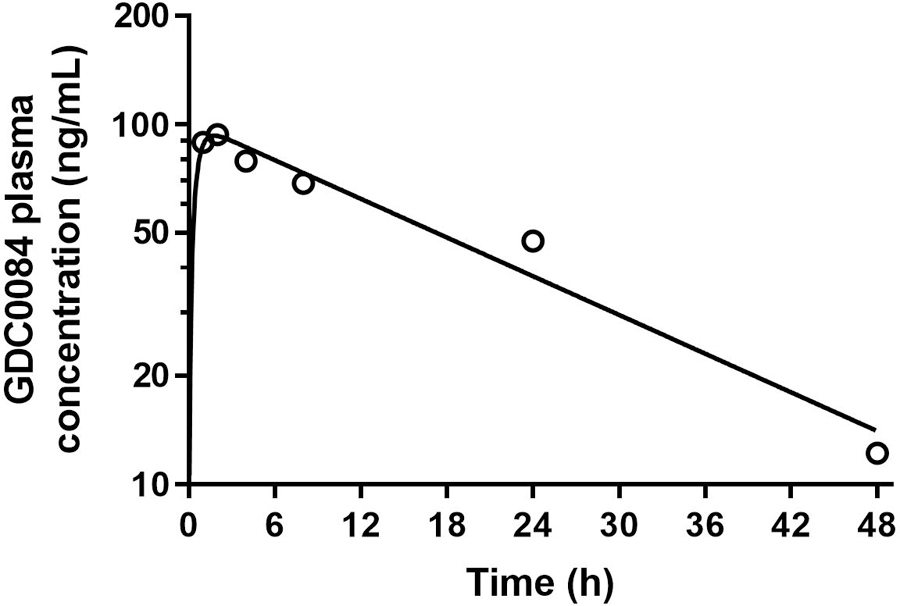
GDC-0084 plasma concentration–time profile for a pediatric patient after administration of an oral dose of GDC-0084 (27 mg/m2). Open circles depict observed data. Solid black line represents model predictions.
3.9 |. Incurred sample reanalysis
Currently, a total of 66 plasma samples have been analyzed using this method, and 18 of those samples have been selected for ISR. The difference between original and repeat analysis have ranged from −9.2 to 5.0%, which meets the acceptance criteria of ±20% of the mean for at least 67% of incurred samples.
4 |. CONCLUSION
The quantitation of GDC-0084 in human plasma and CSF was enabled by SPE followed by LC-MS/MS detection. This assay is fast, sensitive, and specific for the analysis of GDC-0084 in human plasma and CSF. The LC run time was 4 min. The LLOQ was 0.2 ng/ml, demonstrating excellent S/N values. This assay also provides excellent precision, accuracy, and reproducibility for routine analyses. This LC/ESI–MS/MS method is currently used to measure GDC-0084 concentrations in plasma obtained from children enrolled in the ongoing clinical trial. A pharmacokinetic model will be developed on the basis of the generated concentration–time data, which ultimately can be used to guide the clinical development of GDC-0084 for the treatment of children with brain tumors.
ACKNOWLEDGEMENTS
Research reported in this publication was supported by a Cancer Center Support (CORE) Grant CA 21765 and the American Lebanese Syrian Associated Charities (ALSAC). The authors acknowledge the contributions of Genentech, Covance, and Kazia scientists to aspects of the early development of the chromatography and mass spectrometry settings for the GDC-0084 method.
Footnotes
CONFLICT OF INTEREST
The authors have no conflict of interest to declare.
REFERENCES
- Guidance for Industry, Bioanalytical Method Validation. (May 2018). Retrieved from https://www.fda.gov/downloads/Drugs/GuidanceComplianceRegulatoryInformation/Guidances/UCM070107.pdf.
- Heffron TP, Ndubaku CO, Salphati L, Alicke B, Cheong J, Drobnick J, … Olivero AG. (2016). Discovery of Clinical Development Candidate GDC-0084, a Brain Penetrant Inhibitor of PI3K and mTOR. ACS Med Chem Lett, 7, 351–356. [DOI] [PMC free article] [PubMed] [Google Scholar]
- MacDonald TJ, Aguilera D, & Kramm CM. (2011). Treatment of high-grade glioma in children and adolescents. Neuro Oncol, 13, 1049–1058. [DOI] [PMC free article] [PubMed] [Google Scholar]
- Mould DR, Walz AC, Lave T, Gibbs JP, & Frame B. (2015). Developing Exposure/Response Models for Anticancer Drug Treatment: Special Considerations. CPT Pharmacometrics Syst Pharmacol, 4, e00016. [DOI] [PMC free article] [PubMed] [Google Scholar]
- Mueller S, Phillips J, Onar-Thomas A, Romero E, Zheng S, Wiencke JK, … Haas-Kogan DA. (2012). PTEN promoter methylation and activation of the PI3K/Akt/mTOR pathway in pediatric gliomas and influence on clinical outcome. Neuro Oncol, 14, 1146–1152. [DOI] [PMC free article] [PubMed] [Google Scholar]
- Ostrom QT, de Blank PM, Kruchko C, Petersen CM, Liao P, Finlay JL, … Barnholtz-Sloan JS. (2015). Alex’s Lemonade Stand Foundation Infant and Childhood Primary Brain and Central Nervous System Tumors Diagnosed in the United States in 2007–2011. Neuro Oncol, 16 Suppl 10, x1–x36. [DOI] [PMC free article] [PubMed] [Google Scholar]
- Salphati L, Alicke B, Heffron TP, Shahidi-Latham S, Nishimura M, Cao T, … Olivero AG. (2016). Brain Distribution and Efficacy of the Brain Penetrant PI3K Inhibitor GDC-0084 in Orthotopic Mouse Models of Human Glioblastoma. Drug Metab Dispos, 44, 1881–1889. [DOI] [PubMed] [Google Scholar]
- Vanan MI, & Eisenstat DD. (2015). DIPG in Children - What Can We Learn from the Past? Front Oncol, 5, 237. [DOI] [PMC free article] [PubMed] [Google Scholar]
- Wu G, Diaz AK, Paugh BS, Rankin SL, Ju B, Li Y, … St. Jude Children’s Research Hospital-Washington University Pediatric Cancer Genome, P. (2014). The genomic landscape of diffuse intrinsic pontine glioma and pediatric non-brainstem high-grade glioma. Nat Genet, 46, 444–450. [DOI] [PMC free article] [PubMed] [Google Scholar]


