Figure 7.
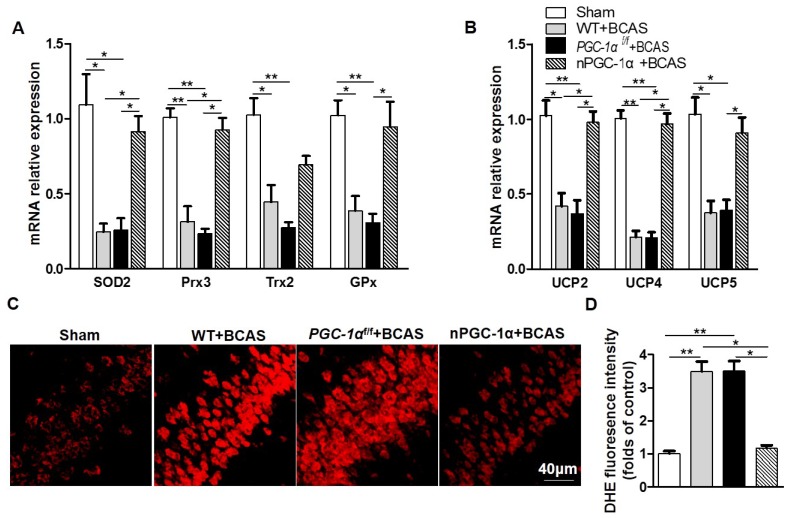
PGC-1α reduces ROS production. (A) The relative mRNA expressions of mitochondrial antioxidants including SOD2, Prx3, Trx2 and GPx1 were determined by qRT-PCR. (B) The relative mRNA expressions of UCPs including UCP2, UCP4 and UCP5 in the hippocampus from 4 groups were also measured. (C) Representative images of DHE staining reflected the ROS levels in the hippocampus of these 4 groups, indicating that PGC-1α greatly reduced ROS production. (D) DHE fluorescence intensity was quantified, and then expressed as the folds of control. *p<0.05, **p<0.01 as determined by one-way ANOVA. n = 6 in each group.

