Abstract
Study Objectives:
To investigate relationships between sleep duration and adherence to healthy diets, but also associations with meal patterns, in a large population-based cohort.
Methods:
Participants (n = 23,829, males and females, aged 45 to 75 years) from the Swedish EpiHealth cohort study were included in a cross-sectional analysis. The participants filled out an extensive Internet-based questionnaire, and also visited a test center for anthropometric measurements and blood sampling. Sleep duration was classified as short (< 6 h/night; n = 1,862), normal (6 to less fewer than 9 h/night; n = 19,907) and long sleep (≥ 9 h/night; n = 858). In addition, a combination variable of sleep duration (short/normal/long) and sleep quality (good/poor) was constructed, giving six categories. Adherence to a healthy diet was assessed using the modified Mediterranean diet (mMED) score and the Healthy Nordic Food Index (HNFI) score based on food groups from a food frequency questionnaire. A regular meal pattern was considered if the participant had breakfast, lunch and dinner on a daily basis.
Results:
Compared with normal sleepers, short sleepers displayed lower adherence to a healthy diet when using both the mMED score (adjusted odds ratio = 0.70; 95% confidence interval 0.56-0.88) and the HNFI score (0.70; 0.56–0.88). When combining sleep duration and sleep quality, short sleepers with poor sleep quality showed an independent relationship with low adherence to a healthy diet (0.67; 0.52–0.86) compared with normal sleepers with good sleep quality. In addition, both short sleepers (0.71; 0.62–0.82) and long sleepers (0.75; 0.62–0.91) showed low adherence to regular meal patterns, compared with normal sleepers. Furthermore, short sleepers with poor sleep quality had reduced odds of having a regular meal pattern (0.67; 0.57–0.79) as compared with normal sleepers with good sleep quality.
Conclusions:
Short sleep duration combined with poor sleep quality is associated with low adherence to a healthy diet and regular meal patterns.
Citation:
Theorell-Haglöw J, Lemming EW, Michaëlsson K, Elmeståhl S, Lind L, Lindberg E. Sleep duration is associated with healthy diet scores and meal patterns: results from the population-based EpiHealth study. J Clin Sleep Med. 2020;16(1):9–18.
Keywords: diet, meal pattern, population-based, sleep duration, sleep quality
BRIEF SUMMARY
Current Knowledge/Study Rationale: Although sleep duration has been associated with dietary intake, knowledge relating to the relationship between sleep duration and adherence to a healthy diet as a whole, is lacking. In addition, knowledge on the relationship between sleep duration and meal patterns is still sparse. This large population-based study aimed to investigate relationships between sleep duration and adherence to healthy diets, as well as associations with meal patterns, in a large population-based cohort.
Study Impact: The study showed that short sleepers with poor sleep quality had low adherence to a healthy diet and regular meal patterns, whereas this was not seen in short sleepers with good sleep quality. Future studies therefore need to examine the effect of the combination of short sleep with poor sleep quality on diet and metabolic disease.
INTRODUCTION
Several studies have reported associations between sleep duration and a number of metabolic disturbances.1–6 Compared with people sleeping 6 to fewer than 9 h/night, those with shorter or longer sleep duration have more obesity and central obesity and they also have higher morbidity and mortality rates.1–5 Longitudinal studies have further revealed that both short and long sleepers gain more weight as compared to normal sleepers.7 Some data also indicate that short and long sleep duration is more closely related to metabolic disturbances among individuals who display concurrent sleep problems.8
In addition, to identify short sleep duration as a risk factor for the development of obesity and metabolic disease (such as the metabolic syndrome), both experimental and some epidemiological studies have investigated the association between sleep duration and dietary intake.9–11 In relation to normal sleepers (7 to 8 hours), short sleepers (5 to 6 hours) report higher intakes of absolute protein, carbohydrate, and total fat but a lower intake of dietary fiber.9–11 In small experimental studies, sleep deprivation or sleep restriction has been shown to affect levels of ghrelin and leptin but also to affect dietary choices, in particular a higher carbohydrate intake.11–14 To date, the studies that have been conducted have been relatively small or restricted to specific groups of people, such as students or workers. In addition, knowledge of the relationship between sleep and adherence to a healthy diet as a whole, rather than specific components of a diet, is lacking.
Dietary risk, such as a low consumption of fruit, vegetables, and whole grains, but also meal patterns have been identified as important factors in the burden of disease. As a result, high adherence to a healthy diet has the potential to prevent disease.15 The most studied healthy dietary pattern is the Mediterranean diet, where high adherence shows a decrease in the risk of chronic metabolic disease and lower cardiometabolic risk markers.16,17 Moreover, the Healthy Nordic Food Index (HNFI) has been linked to reduced cardiovascular risk18,19 but not to all-cause and cardiovascular mortality independent of the Mediterranean diet.20 To date, there are no studies assessing the relationship between sleep duration and adherence to healthy diets. In addition, knowledge relating to the connection between sleep duration and dietary patterns is still sparse, although a cohort study in nonobese Japanese male workers (aged 40–59 years) showed that the effect of short sleep duration on the incidence of obesity was only partially explained by regular meal patterns.21 Large population-based studies also comprising women are still lacking.
Hypothesis and aims
We hypothesized that both short and long sleepers would have a lower adherence to a healthy diet. In addition, we hypothesized that sleep duration is associated with meal patterns. The primary aim was to investigate relationships between sleep duration and adherence to healthy diets in a large population-based sample of men and women. A secondary exploratory aim was to assess whether short and long sleepers show differences in meal patterns compared with normal sleepers. We also wanted to assess whether sleep quality affects these relationships.
METHODS
Cohort description
The current study used data from the Swedish EpiHealth cohort study (https://www.epihealth.se/).22 In short, the EpiHealth study started in 2011 with the primary aim of studying how interactions between lifestyle factors and genotypes contribute to the development of common disorders, such as cardiovascular and respiratory diseases, but also quality of life. Participants (males and females; aged 45 to 75 years) were randomly selected between 2011 and 2016 from the population registry in the Swedish cities of Malmö and Uppsala. The participants filled out an extensive internet-based questionnaire, as well as visiting one of two Swedish test centers (located in Malmö and Uppsala, Sweden) for anthropometric measurements and blood sampling. For the current study, all the participants who were not pregnant, physically able to prepare food themselves, and had answered the questions on sleep duration, sleep quality, diet (nmMED = 21,339; nHNFI = 22,627), and eating pattern questions (n = 22,476) were included.
Sleep duration and other sleep-related variables
Sleep duration was assessed by the question “How many hours do you normally sleep a day (24 hours)?” and answers were indicated as 4 hours or less; 5 hours; 6 hours; 7 hours; 8 hours; 9 hours; or 10 or more hours. Short sleepers were defined as sleeping fewer than 6 h/night, normal sleepers as sleeping 6 to less than 9 h/night and long sleepers as sleeping more than 9 h/night.
One question assessed sleep quality. The participants were asked to indicate on a five-point scale from “very poor” to “very good” how they perceived the quality of their sleep. Answers were dichotomized into good (“good” to “very good”) and poor (“very poor” to “neither poor nor good”) sleep quality.
Insomnia was indicated by the Minimal Insomnia Symptom Scale.23 This questionnaire assesses insomnia using the questions “Do you have difficulty falling asleep?” “Do you wake up several times a night and cannot fall back to sleep?” and “Do you not feel rested?” Indicating having problems more than four times per week one or more of these three question was regarded as indicating symptoms of insomnia.
Snoring was assessed by indicating on a four-point scale how often the participant snored loudly (never-rarely, one to three times a month, one to three times a week, and four times or more a week) and snoring was affirmed by answering one to three times a week or four times or more per week. The participants further indicated if they had a diagnosis of obstructive sleep apnea (yes/no).
Dietary measurements
The Internet-based questionnaire included an extensive food frequency questionnaire called MiniMealQ.24 The questionnaire includes common Swedish foods, dishes and beverages and covers diet during the past few months. All dietary items were reported on an ordinary scale using five or eight levels, depending on the food. The five-level frequency scale ranged from one to three times a month to more than seven times a week (information on fruits, vegetables, bakery products, and different dishes). The eight-level frequency scale ranged from one to two times a week to five or more times a day (for example, information on bread and dairy products). In addition, a six-level ordinal scale ranging from never to four or more times a week was used to collect information on alcohol consumption. To assess diet, the modified Mediterranean diet (mMED) score and the HNFI score, based on the answers to the food frequency questionnaire, were used. The Mediterranean diet score was developed by Trichopoulou et al25 and the mMED score, range 0 to 8, was used.20,26 The mMED score includes intake of eight groups of food/drink: fruit and vegetables, legumes and nuts, nonrefined or high-fiber grains, fermented dairy products, fish, red or processed food, use of olive or rapeseed oil and moderate alcohol consumption. One point was given for intakes above the median for each food group except for red or processed food, where one point was given for intakes below the median. For alcohol, one point was given for moderate intake (5 to 15 grams per day). A score of six to eight points was considered to indicate high adherence.27
The HNFI (range 0 to 6) was calculated according to previous literature.20,28,29 The HNFI score assesses intake of six food groups: apples and pears, root vegetables, cruciferous vegetables, whole-grain bread, oatmeal/porridge, and fish. One point was given for intakes above the median for each food group and a score of five to six points was considered to indicate high adherence.20
Meal patterns were assessed using three questions assessing breakfast, lunch, and dinner frequency. The dietary pattern variable was dichotomized to indicate having breakfast, lunch and dinner every day versus not, where indicating having breakfast, lunch and dinner on a daily basis was regarded as having healthy meal patterns.
Anthropometric measurements and lifestyle factors
Weight and height were measured at the test center. The body mass index (BMI) was calculated as weight divided by height squared (kg/m2).
From the questionnaire, the participants’ civil status (married/living together versus single/living alone), educational level, information on shift work (working shifts versus not working shifts), physical activity during leisure time, frequency of alcohol consumption, and smoking status (nonsmoker, former smoker, and current smoker) were assessed.
Educational level was categorized into three categories: primary and elementary school (a maximum of 9 years of formal schooling); secondary high school (a maximum of 12 years of formal schooling) and university.
Physical activity was assessed on a seven-level scale assessing physical activity during leisure time. For the statistical analysis, answers were categorized into four groups. A low level of physical activity was defined as watching television, reading and being sedentary for most of their leisure time. A medium-low level was defined as performing light physical activity, such as walking, dancing, ordinary gardening 2 to 4 hours a week. A medium-high physical activity was defined as performing more intense physical activity, such as walking and cycling, for at least 1 to 2 hours a week and also including doing all household work. Last, a high physical activity level was defined as performing strenuous exercise for at least 3 hours a week.30
To assess alcohol consumption and behavior, the three-item screening tool, Alcohol Use Disorders Identification Test, or AUDIT-C, was used. The AUDIT-C is a short version of the 10-question AUDIT (screening tool developed by the World Health Organization to assess alcohol consumption, drinking behaviors and alcohol-related problems).31
Depressive symptoms were assessed by indicating having been sad or empty all day for more than 2 weeks or having lost interest in normally engaging activities for more than 2 weeks during life but not being related to a traumatic event. Stress/anxiety was assessed by the question “How often (over the past month) have you felt nervous or stressed?” and the answers were: never-rarely-sometimes-often-very often. Stress/anxiety was considered if “often” or “very often” was indicated.
Medical disease and medication
In the questionnaire, the participants were asked to indicate if they had received a diagnosis of hypertension, hyperlipidemia/hypercholesterolemia, or diabetes and, from information gathered at the test center visit, there was information on medication for hypertension, hyperlipidemia/hypercholesterolemia, or diabetes.
Statistical analyses
Univariate analysis was performed and differences between groups were compared with the χ2 test for categorical variables and t test for continuous variables. Relationships between study variables and the minimal required set of variables to adjust were evaluated through a Directed Acyclical Graph (DAG) using DAGitty (www.dagitty.net) and subject matter knowledge (Figure S1 in the supplemental material).
The main outcome variables were adherence to a healthy diet (dichotomous variable) and regular meal patterns (dichotomous variable) respectively. The independent variables were sleep duration and sleep duration in combination with sleep quality. The combination variable was used as there was a significant interaction between sleep duration and sleep quality (Pnteraction < .0001) and it contained six categories. The categories were normal sleepers with good sleep quality (reference group [n = 13,114]), normal sleepers with poor sleep quality (n = 6,793), short sleepers with good sleep quality (n = 270), short sleepers with poor sleep quality (n = 1,592), long sleepers with good sleep quality (n = 675), and long sleepers with poor sleep quality (n = 183). Covariates in the final adjusted models were lifestyle and social factors, psychological distress, and medical comorbidities.
The overall relationship between sleep duration and adherence to the mMED and HNFI respectively, as well as meal patterns, was assessed using logistic regression analysis. To assess linear or curvilinear relationships between sleep duration and the outcome variables, the regression models were performed unadjusted, with sleep duration as a linear term, and also adjusted for the quadratic term for sleep duration. This analysis generated a P for trend or a P for curve for the relationship between sleep duration and diet and meal pattern variables.
The independent relationship between short and long sleep duration, as well as the combination of sleep and sleep quality, with adherence to the mMED and HNFI respectively, as well as meal patterns, was assessed using multivariable logistic regression analysis. The analyses were performed unadjusted, adjusted for age and BMI, and adjusted for all the variables in the DAG. In addition, a sensitivity analysis was performed adjusting for all variables in the DAG and BMI and total energy intake. The results are presented as the odds ratio with 95% confidence intervals (95% CI). Statistical analyses were performed using Stata 14 (StataCorp, College Station, Texas, USA). A value of P < .05 was considered statistically significant.
Ethics
The Ethical Review Board (Etikprövningsnämnden) in Uppsala (Dnr 2010/402, decision date December 1, 2010 and November 17, 2011) approved data collection within EpiHealth. The study was reported to and inspected by the Swedish Data Protection Authority and was found to be clear of any objections (Dnr 307-2011, March 3, 2011). The current study was approved by the Ethical Review Board in Uppsala (Dnr 2017/487, decision date December 13, 2017) and data extraction was approved by the EpiHealth steering committee.
RESULTS
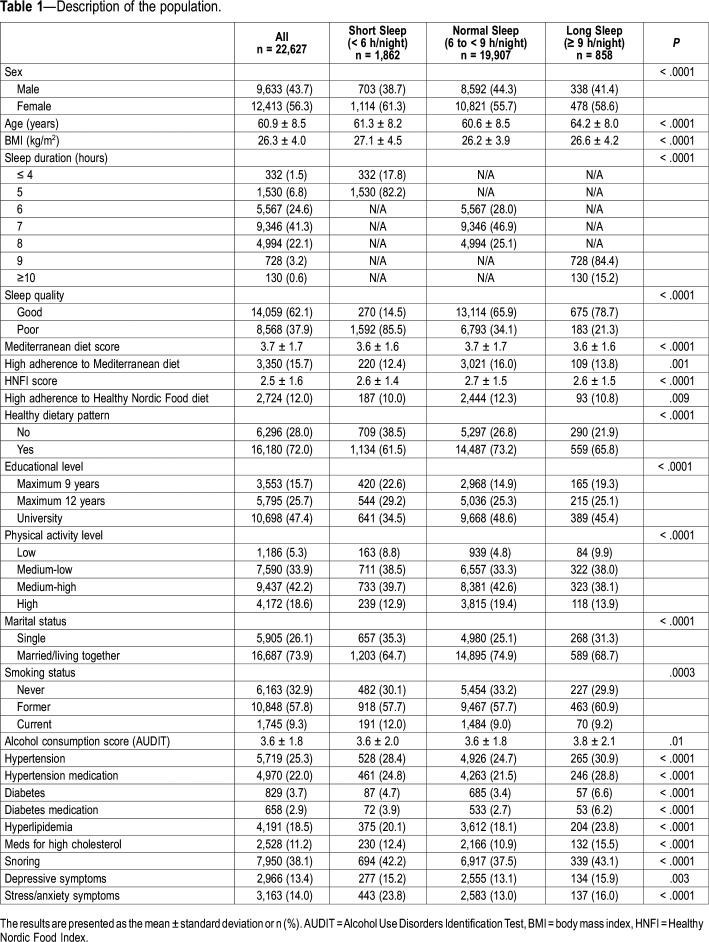
Table 1 shows a description of the population. Overall, the participants were 60.9 years (8.5 standard deviation), mildly overweight, and most often married/living with someone. Almost half of the participants had a university degree. In addition, 1 in 10 was a smoker. Most participants reported sleeping 7 to 8 hours a night. Both short and long sleepers were older and somewhat more overweight than normal sleepers, whereas short sleepers were more often smokers. In the short sleeping group, more individuals reported poor sleep quality than among normal and long sleepers. Women were more prevalent in all the sleep duration groups, but there was a larger numerical difference between sexes in the short sleeping group than among normal or long sleepers. In general, both short and long sleepers were less adherent to a healthy diet using the mMED or the HNFI score. Most participants indicated a regular meal pattern, although both short and long sleepers reported less regular meal patterns than normal sleepers (Table 1).
Table 1.
Description of the population.
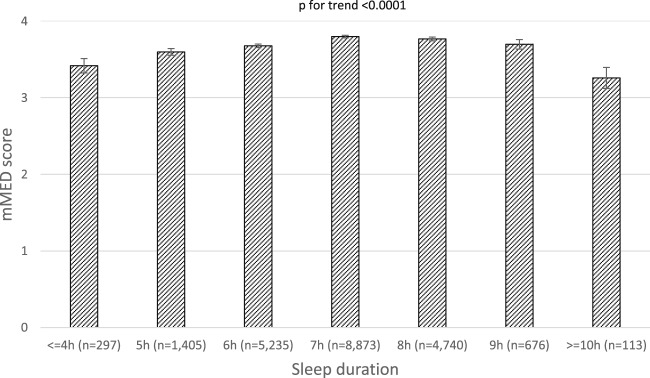
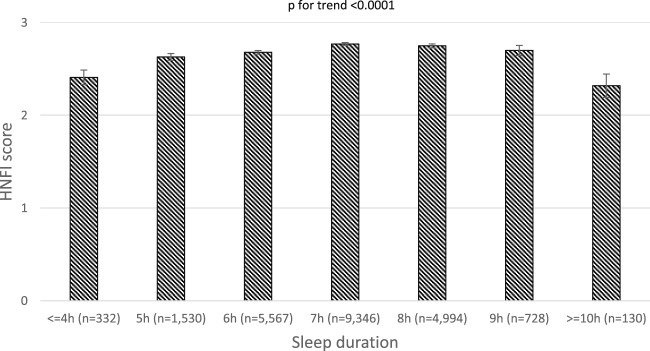
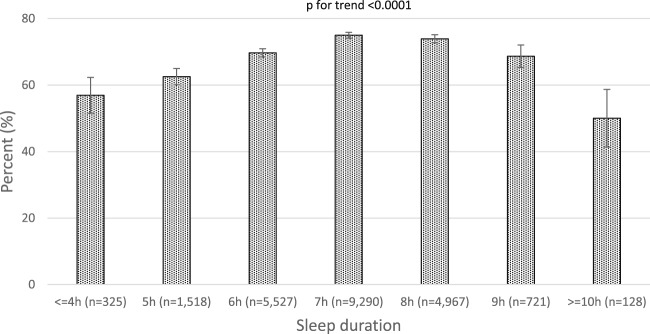
There was a significant curvilinear relationship between sleep duration and adherence to both diet scores (Figure 1 and Figure 2). Sleep duration also showed a curvilinear relationship with a regular meal pattern, with the highest prevalence of a daily regular meal pattern (breakfast, lunch and dinner) in the groups sleeping 7 to 9 h/night (Figure 3).
Figure 1. Modified Mediterranean Diet score by sleep duration.
The results are presented as the mean ± standard error.
Figure 2. The Healthy Nordic Food Index score by sleep duration.
The results are presented as the mean ± standard error.
Figure 3. Prevalence of having a healthy meal pattern (ie, eating breakfast, lunch and dinner on a daily basis) by sleep duration.
The results are presented as prevalence (%) with 95% confidence interval.
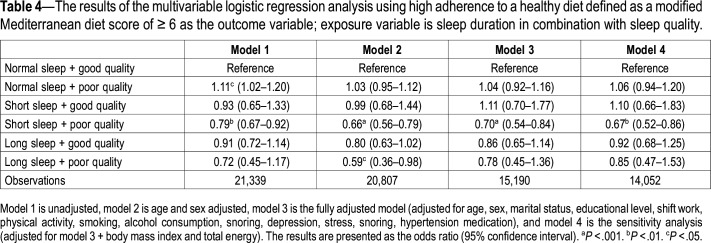
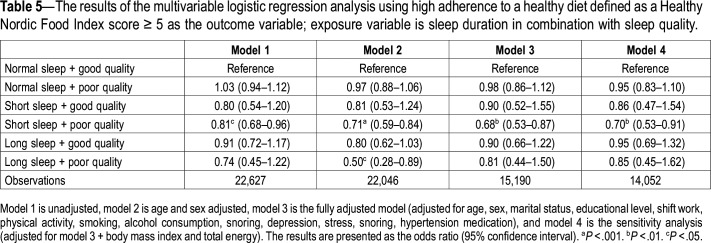
The multivariable analysis showed that short sleepers displayed poorer adherence to a healthy diet when defined by both the mMED and the HNFI score. The relationships remained significant in the fully adjusted model, as well as after adjusting for BMI and total energy intake in the sensitivity analysis (Table 2 and Table 3). It was further observed that participants with short sleep duration combined with poor sleep quality had lower odds for adherence to a healthy diet. In contrast, short sleepers with good sleep quality did not have low adherence to a healthy diet (Table 4 and Table 5).
Table 2.
The results of the multivariable logistic regression analysis using high adherence to a healthy diet defined as a modified Mediterranean diet score of ≥ 6 as the outcome variable; exposure variable is sleep duration.
Table 3.
The results of the multivariable logistic regression analysis using high adherence to a healthy diet defined as a Healthy Nordic Food Index score ≥ 5 as the outcome variable; exposure variable is sleep duration.
Table 4.
The results of the multivariable logistic regression analysis using high adherence to a healthy diet defined as a modified Mediterranean diet score of ≥ 6 as the outcome variable; exposure variable is sleep duration in combination with sleep quality.
Table 5.
The results of the multivariable logistic regression analysis using high adherence to a healthy diet defined as a Healthy Nordic Food Index score ≥ 5 as the outcome variable; exposure variable is sleep duration in combination with sleep quality.
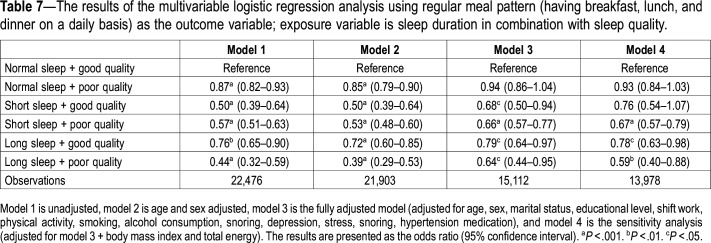
When assessing the association between sleep duration and regular meal patterns, the multivariable analysis showed that both short and long sleepers had lower odds of having a healthy dietary pattern. This result remained significant after adjusting for potential confounders (Table 6). In addition, when combining sleep duration with sleep quality, both short and long sleepers, regardless of sleep quality, had reduced odds of having healthy meal patterns independent of confounders. However, when also adjusting for BMI and total energy intake, short sleep with good sleep quality did not remain significant (Table 7).
Table 6.
The results of the multivariable logistic regression analysis using regular meal pattern (having breakfast, lunch, and dinner on a daily basis) as the outcome variable; exposure variable is sleep duration.
Table 7.
The results of the multivariable logistic regression analysis using regular meal pattern (having breakfast, lunch, and dinner on a daily basis) as the outcome variable; exposure variable is sleep duration in combination with sleep quality.
DISCUSSION
The main result of this study is that there is a curvilinear relationship between sleep duration and adherence to a healthy diet but also with regular meal patterns. Moreover, there was an interaction between sleep time and sleep quality and short and long sleepers with poor sleep quality displayed lower adherence to a healthy diet and healthy meal patterns, even after adjustment for confounders. In contrast, there was no association between short sleep time and adherence to a healthy diet among those with good sleep quality.
Observational studies of sleep duration and dietary intake
In line with previous studies, we saw the strongest relationships in the short sleeping group. Previous observational studies show a higher total energy intake,32–37 a higher intake of fats and cholesterol,32,34,38–40 higher carbohydrates and sugar,32,35,39,41 a smaller amount of energy from protein,35,41 and lower dietary fiber32,35 in short sleepers. In addition, short sleep duration has been associated with fewer servings of fruits,35,42,43 vegetables,43,44 whole grains,35 and beans,35 and overall poorer dietary quality.33,35 As high adherence to the Mediterranean diet and the Healthy Nordic diet respectively includes a higher intake of fruits and vegetables, as well as whole grains, the results of the current study are well in line with previous research. It could be argued that not only does unhealthy food intake lead to a smaller intake of healthy micronutrients and bioactive molecules (from fruit, vegetables, whole grains, and fish) but also that sleep deprivation may aggravate the metabolic effects of this unhealthy eating and also that a higher energy intake further adds to this.
The current study shows that short sleep duration is associated with low adherence to a healthy diet but only in combination with poor sleep quality. This result adds a new insight into the relationship and possible pathways between sleep and metabolism. Previous studies have mainly focused on short sleep duration and have not assessed the combination of sleep duration and sleep quality, as we have done. A recent study showed that short sleep duration was only related to obesity in those with concurrent insomnia.45 In addition, a Mediterranean diet is associated with fewer insomnia symptoms46 and adequate sleep duration and is less likely to be associated with insomnia accompanied by short sleep.47 It is plausible that there are genetic differences in sleep requirements, where those sleeping too little due to sleep disturbances (thereby getting too little sleep in relation to their sleep needs) will experience an effect on diet and dietary intake, as shown in the present study. Moreover, previous genetic studies have shown that some short sleepers require considerably less sleep than others do. Data from Drosophila melanogaster show a clear genetic component for sleep duration but no difference in lifespan between Drosophila mutants with an extremely short or long sleep time and control subjects. This suggests that there are few physiologic consequences from being an extremely long or short sleeper.48
Experimental studies of sleep duration and dietary intake
Several experimental studies have assessed sleep restriction and dietary intake. Spiegel et al13 showed that short sleep promotes an increase in the intake of unhealthy foods. Most studies show a higher total energy intake49–53 with sleep restriction and, in addition, sleep restriction has been associated with a higher intake of fat,49,51,52,54 snacks,55 and desserts.51 From a mechanistic point of view, Greer et al have shown that insufficient sleep through sleep deprivation negatively affects the brain mechanisms involved in food evaluation and selection, resulting in the selection of foods most capable of triggering weight gain.56 Taken together, these findings could also further support the link between short sleep duration and metabolic effects.7,8
Two studies have assessed objectively measured sleep in relation to diet.57,58 Mossavar-Rahmani et al found that an increase in sleep duration and sleep efficiency was associated with healthier diet quality,57 a result in line with the current study. Spaeth et al showed that sleep restriction affected both dietary intake and dietary patterns and behavior where sleep-restricted subjects increased their daily caloric intake by eating late at night and consuming more fat.58
Sleep and dietary patterns
Both short and long sleep with poor sleep quality were associated with irregular meal patterns in the current study. Previous studies, mostly of selected individuals, have shown that short sleep is associated with more irregular eating (not eating three times a day at defined times),44,59 reduced adherence to healthy eating patterns,13 a lower frequency of main meals,41,60 and irregular meal times,44 all in line with the current study. Moreover, short sleep duration has been related to poorer food variety,32,59 greater snacking41,44,60 and more eating out.44 In addition, Hogenkamp et al showed that sleep deprivation increased portion size61and the timings of food intake.51,58 Furthermore, Chapman et al showed that sleep-deprived men purchased significantly more calories and grams of food than they did after 1 night of sleep.62
This study was performed in a large, population-based cohort of men and women and assessed the not previously studied relationship between U-shaped sleep duration in combination with sleep quality and the adherence to healthy dietary patterns, as well as meal patterns. Nonetheless, there are some limitations to consider when interpreting the results. All the data are self-reported and thereby associated with measurement errors. However, measurement errors are partially reduced by a large sample size. In addition, because the study is cross-sectional, causality is difficult to infer.
CONCLUSIONS
In conclusion, the current study shows that short sleep duration combined with poor sleep quality, but not good sleep quality, is associated with poor adherence to a healthy diet and regular meal patterns. This implies a need to study the combination of short sleep and poor sleep quality further in relation to metabolic disease.
DISCLOSURE STATEMENT
All the authors have seen and approved the manuscript. Work for this study was performed at Department of Medical Sciences, Respiratory, Allergy and Sleep Research and the Epi Hub, Uppsala University, Uppsala, Sweden. The study was supported by the Swedish Research Council. The authors report no conflicts of interest.
ABBREVIATIONS
- AUDIT
alcohol use disorders identification test
- BMI
body mass index
- DAG
directed acyclical graph
- HNFI
Healthy Nordic Food Index
- mMED
Modified Mediterranean diet
REFERENCES
- 1.Theorell-Haglöw J, Berglund L, Janson C, Lindberg E. Sleep duration and central obesity in women - differences between short sleepers and long sleepers. Sleep Med. 2012;13(8):1079–1085. doi: 10.1016/j.sleep.2012.06.013. [DOI] [PubMed] [Google Scholar]
- 2.Buscemi D, Kumar A, Nugent R, Nugent K. Short sleep times predict obesity in internal medicine clinic patients. J Clin Sleep Med. 2007;3(7):681–688. [PMC free article] [PubMed] [Google Scholar]
- 3.Cai H, Shu XO, Xiang YB, et al. Sleep duration and mortality: a prospective study of 113 138 middle-aged and elderly Chinese men and women. Sleep. 2015;38(4):529–536. doi: 10.5665/sleep.4564. [DOI] [PMC free article] [PubMed] [Google Scholar]
- 4.Choi KM, Lee JS, Park HS, Baik SH, Choi DS, Kim SM. Relationship between sleep duration and the metabolic syndrome: Korean National Health and Nutrition Survey 2001. Int J Obes (Lond) 2008;32(7):1091–1097. doi: 10.1038/ijo.2008.62. [DOI] [PubMed] [Google Scholar]
- 5.Léger D, Beck F, Richard JB, Sauvet F, Faraut B. The risks of sleeping “too much”. Survey of a national representative sample of 24671 adults (INPES health barometer) PLoS One. 2014;9(9):e106950. doi: 10.1371/journal.pone.0106950. [DOI] [PMC free article] [PubMed] [Google Scholar]
- 6.Cai GH, Janson C, Theorell-Haglöw J, et al. Both weight at age 20 and weight gain have an impact on sleep disturbances later in life: results of the EpiHealth study. Sleep. 2018;41(1) doi: 10.1093/sleep/zsx176. [DOI] [PubMed] [Google Scholar]
- 7.Theorell-Haglöw J, Berglund L, Berne C, Lindberg E. Both habitual short sleepers and long sleepers are at greater risk of obesity: a population-based 10-year follow-up in women. Sleep Med. 2014;15(10):1204–1211. doi: 10.1016/j.sleep.2014.02.014. [DOI] [PubMed] [Google Scholar]
- 8.Vgontzas AN, Fernandez-Mendoza J, Miksiewicz T, et al. Unveiling the longitudinal association between short sleep duration and the incidence of obesity: the Penn State Cohort. Int J Obes (Lond) 2014;38(6):825–832. doi: 10.1038/ijo.2013.172. [DOI] [PMC free article] [PubMed] [Google Scholar]
- 9.Knutson KL, Spiegel K, Penev P, Van Cauter E. The metabolic consequences of sleep deprivation. Sleep Med Rev. 2007;11(3):163–178. doi: 10.1016/j.smrv.2007.01.002. [DOI] [PMC free article] [PubMed] [Google Scholar]
- 10.Leproult R, Copinschi G, Buxton O, Van Cauter E. Sleep loss results in an elevation of cortisol levels the next evening. Sleep. 1997;20(10):865–870. [PubMed] [Google Scholar]
- 11.Spiegel K, Leproult R, L’hermite-Baleriaux M, Copinschi G, Penev PD, Van Cauter E. Leptin levels are dependent on sleep duration: relationships with sympathovagal balance, carbohydrate regulation, cortisol, and thyrotropin. J Clin Endocrinol Metab. 2004;89(11):5762–5771. doi: 10.1210/jc.2004-1003. [DOI] [PubMed] [Google Scholar]
- 12.Spiegel K, Leproult R, Van Cauter E. Impact of sleep debt on metabolic and endocrine function. Lancet. 1999;354(9188):1435–1439. doi: 10.1016/S0140-6736(99)01376-8. [DOI] [PubMed] [Google Scholar]
- 13.Spiegel K, Tasali E, Penev P, Van Cauter E. Brief communication: Sleep curtailment in healthy young men is associated with decreased leptin levels, elevated ghrelin levels, and increased hunger and appetite. Ann Intern Med. 2004;141(11):846–850. doi: 10.7326/0003-4819-141-11-200412070-00008. [DOI] [PubMed] [Google Scholar]
- 14.Broussard JL, Kilkus JM, Delebecque F, et al. Elevated ghrelin predicts food intake during experimental sleep restriction. Obesity (Silver Spring) 2016;24(1):132–138. doi: 10.1002/oby.21321. [DOI] [PMC free article] [PubMed] [Google Scholar]
- 15.GBD 2013 Risk Factor Collaborators, Forouzanfar MH, Alexander L, et al. Global, regional, and national comparative risk assessment of 79 behavioural, environmental and occupational, and metabolic risks or clusters of risks in 188 countries, 1990-2013: a systematic analysis for the Global Burden of Disease Study 2013. Lancet. 2015;386(10010):2287–2323. doi: 10.1016/S0140-6736(15)00128-2. [DOI] [PMC free article] [PubMed] [Google Scholar]
- 16.Anderson JJ, Nieman DC. Diet quality-the Greeks had it right! Nutrients. 2016;8(10) doi: 10.3390/nu8100636. [DOI] [PMC free article] [PubMed] [Google Scholar]
- 17.Martinez-González MA, Salas-Salvado J, Estruch R, et al. Benefits of the Mediterranean diet: insights from the PREDIMED study. Prog Cardiovasc Dis. 2015;58(1):50–60. doi: 10.1016/j.pcad.2015.04.003. [DOI] [PubMed] [Google Scholar]
- 18.Adamsson V, Cederholm T, Vessby B, Riserus U. Influence of a healthy Nordic diet on serum fatty acid composition and associations with blood lipoproteins - results from the NORDIET study. Food Nutr. Res. 2014;58(1):24114. doi: 10.3402/fnr.v58.24114. [DOI] [PMC free article] [PubMed] [Google Scholar]
- 19.Uusitupa M, Hermansen K, Savolainen MJ, et al. Effects of an isocaloric healthy Nordic diet on insulin sensitivity, lipid profile and inflammation markers in metabolic syndrome–a randomized study (SYSDIET) J Intern Med. 2013;274(1):52–66. doi: 10.1111/joim.12044. [DOI] [PMC free article] [PubMed] [Google Scholar]
- 20.Warensjö Lemming E, Byberg L, Wolk A, Michaelsson K. A comparison between two healthy diet scores, the modified Mediterranean diet score and the Healthy Nordic Food Index, in relation to all-cause and cause-specific mortality. Br J Nutr. 2018;119(7):836–846. doi: 10.1017/S0007114518000387. [DOI] [PubMed] [Google Scholar]
- 21.Nishiura C, Noguchi J, Hashimoto H. Dietary patterns only partially explain the effect of short sleep duration on the incidence of obesity. Sleep. 2010;33(6):753–757. doi: 10.1093/sleep/33.6.753. [DOI] [PMC free article] [PubMed] [Google Scholar]
- 22.Lind L, Elmstahl S, Bergman E, et al. EpiHealth: a large population-based cohort study for investigation of gene-lifestyle interactions in the pathogenesis of common diseases. Eur J Epidemiol. 2013;28(2):189–197. doi: 10.1007/s10654-013-9787-x. [DOI] [PubMed] [Google Scholar]
- 23.Broman JE, Smedje H, Mallon L, Hetta J. The Minimal Insomnia Symptom Scale (MISS): a brief measure of sleeping difficulties. Ups J Med Sci. 2008;113(2):131–142. doi: 10.3109/2000-1967-221. [DOI] [PubMed] [Google Scholar]
- 24.Almqvist C, Adami H-O, Franks PW, et al. LifeGene—a large prospective population-based study of global relevance. Eur J Epidemiol. 2011;26(1):67–77. doi: 10.1007/s10654-010-9521-x. [DOI] [PMC free article] [PubMed] [Google Scholar]
- 25.Trichopoulou A, Costacou T, Bamia C, Trichopoulos D. Adherence to a Mediterranean diet and survival in a Greek population. N Engl J Med. 2003;348(26):2599–2608. doi: 10.1056/NEJMoa025039. [DOI] [PubMed] [Google Scholar]
- 26.Tektonidis TG, Akesson A, Gigante B, Wolk A, Larsson SC. A Mediterranean diet and risk of myocardial infarction, heart failure and stroke: a population-based cohort study. Atherosclerosis. 2015;243(1):93–98. doi: 10.1016/j.atherosclerosis.2015.08.039. [DOI] [PubMed] [Google Scholar]
- 27.Bellavia A, Tektonidis TG, Orsini N, Wolk A, Larsson SC. Quantifying the benefits of Mediterranean diet in terms of survival. Eur J Epidemiol. 2016;31(5):527–530. doi: 10.1007/s10654-016-0127-9. [DOI] [PubMed] [Google Scholar]
- 28.Roswall N, Eriksson U, Sandin S, et al. Adherence to the healthy Nordic food index, dietary composition, and lifestyle among Swedish women. Food Nutr Res. 2015;59(1):26336. doi: 10.3402/fnr.v59.26336. [DOI] [PMC free article] [PubMed] [Google Scholar]
- 29.Olsen A, Egeberg R, Halkjaer J, Christensen J, Overvad K, Tjonneland A. Healthy aspects of the Nordic diet are related to lower total mortality. J Nutr. 2011;141(4):639–644. doi: 10.3945/jn.110.131375. [DOI] [PubMed] [Google Scholar]
- 30.Byberg L, Melhus H, Gedeborg R, et al. Total mortality after changes in leisure time physical activity in 50 year old men: 35 year follow-up of population based cohort. BMJ. 2009;338:b688. doi: 10.1136/bmj.b688. [DOI] [PMC free article] [PubMed] [Google Scholar]
- 31.Saunders JB, Aasland OG, Babor TF, de la Fuente JR, Grant M. Development of the Alcohol Use Disorders Identification Test (AUDIT): WHO Collaborative Project on Early Detection of Persons with Harmful Alcohol Consumption–II. Addiction. 1993;88(6):791–804. doi: 10.1111/j.1360-0443.1993.tb02093.x. [DOI] [PubMed] [Google Scholar]
- 32.Grandner MA, Jackson N, Gerstner JR, Knutson KL. Dietary nutrients associated with short and long sleep duration. Data from a nationally representative sample. Appetite. 2013;64:71–80. doi: 10.1016/j.appet.2013.01.004. [DOI] [PMC free article] [PubMed] [Google Scholar]
- 33.Stern JH, Grant AS, Thomson CA, et al. Short sleep duration is associated with decreased serum leptin, increased energy intake and decreased diet quality in postmenopausal women. Obesity (Silver Spring) 2014;22(5):E55–E61. doi: 10.1002/oby.20683. [DOI] [PMC free article] [PubMed] [Google Scholar]
- 34.Grandner MA, Kripke DF, Naidoo N, Langer RD. Relationships among dietary nutrients and subjective sleep, objective sleep, and napping in women. Sleep Med. 2010;11(2):180–184. doi: 10.1016/j.sleep.2009.07.014. [DOI] [PMC free article] [PubMed] [Google Scholar]
- 35.Haghighatdoost F, Karimi G, Esmaillzadeh A, Azadbakht L. Sleep deprivation is associated with lower diet quality indices and higher rate of general and central obesity among young female students in Iran. Nutrition. 2012;28(11-12):1146–1150. doi: 10.1016/j.nut.2012.04.015. [DOI] [PubMed] [Google Scholar]
- 36.Patterson F, Malone SK, Lozano A, Grandner MA, Hanlon AL. Smoking, screen-based sedentary behavior, and diet associated with habitual sleep duration and chronotype: data from the UK Biobank. Ann Behav Med. 2016;50(5):715–726. doi: 10.1007/s12160-016-9797-5. [DOI] [PMC free article] [PubMed] [Google Scholar]
- 37.Galli G, Piaggi P, Mattingly MS, et al. Inverse relationship of food and alcohol intake to sleep measures in obesity. Nutr Diabetes. 2013;3(1):e58. doi: 10.1038/nutd.2012.33. [DOI] [PMC free article] [PubMed] [Google Scholar]
- 38.Santana AA, Pimentel GD, Romualdo M, et al. Sleep duration in elderly obese patients correlated negatively with intake fatty. Lipids Health Dis. 2012;11(1):99. doi: 10.1186/1476-511X-11-99. [DOI] [PMC free article] [PubMed] [Google Scholar]
- 39.Dashti HS, Follis JL, Smith CE, et al. Habitual sleep duration is associated with BMI and macronutrient intake and may be modified by CLOCK genetic variants. Am J Clin Nutr. 2015;101(1):135–143. doi: 10.3945/ajcn.114.095026. [DOI] [PMC free article] [PubMed] [Google Scholar]
- 40.Shi Z, McEvoy M, Luu J, Attia J. Dietary fat and sleep duration in Chinese men and women. Int J Obes (Lond) 2008;32(12):1835–1840. doi: 10.1038/ijo.2008.191. [DOI] [PubMed] [Google Scholar]
- 41.Kant AK, Graubard BI. Association of self-reported sleep duration with eating behaviors of American adults: NHANES 2005-2010. Am J Clin Nutr. 2014;100(3):938–947. doi: 10.3945/ajcn.114.085191. [DOI] [PMC free article] [PubMed] [Google Scholar]
- 42.Tu X, Cai H, Gao YT, et al. Sleep duration and its correlates in middle-aged and elderly Chinese women: the Shanghai Women’s Health Study. Sleep Med. 2012;13(9):1138–1145. doi: 10.1016/j.sleep.2012.06.014. [DOI] [PMC free article] [PubMed] [Google Scholar]
- 43.Stamatakis KA, Brownson RC. Sleep duration and obesity-related risk factors in the rural Midwest. Prev Med. 2008;46(5):439–444. doi: 10.1016/j.ypmed.2007.11.008. [DOI] [PMC free article] [PubMed] [Google Scholar]
- 44.Imaki M, Hatanaka Y, Ogawa Y, Yoshida Y, Tanada S. An epidemiological study on relationship between the hours of sleep and life style factors in Japanese factory workers. J Physiol Anthropol Appl Human Sci. 2002;21(2):115–120. doi: 10.2114/jpa.21.115. [DOI] [PubMed] [Google Scholar]
- 45.Cai GH, Theorell-Haglow J, Janson C, et al. Insomnia symptoms and sleep duration and their combined effects in relation to associations with obesity and central obesity. Sleep Med. 2018;46:81–87. doi: 10.1016/j.sleep.2018.03.009. [DOI] [PubMed] [Google Scholar]
- 46.Campanini MZ, Guallar-Castillon P, Rodriguez-Artalejo F, Lopez-Garcia E. Mediterranean diet and changes in sleep duration and indicators of sleep quality in older adults. Sleep. 2017;40(3) doi: 10.1093/sleep/zsw083. [DOI] [PubMed] [Google Scholar]
- 47.Castro-Diehl C, Wood AC, Redline S, et al. Mediterranean diet pattern and sleep duration and insomnia symptoms in the Multi-Ethnic Study of Atherosclerosis. Sleep. 2018;41(11) doi: 10.1093/sleep/zsy158. [DOI] [PMC free article] [PubMed] [Google Scholar]
- 48.Harbison ST, Serrano Negron YL, Hansen NF, Lobell AS. Selection for long and short sleep duration in Drosophila melanogaster reveals the complex genetic network underlying natural variation in sleep. PLoS Genet. 2017;13(12):e1007098. doi: 10.1371/journal.pgen.1007098. [DOI] [PMC free article] [PubMed] [Google Scholar]
- 49.Brondel L, Romer MA, Nougues PM, Touyarou P, Davenne D. Acute partial sleep deprivation increases food intake in healthy men. Am J Clin Nutr. 2010;91(6):1550–1559. doi: 10.3945/ajcn.2009.28523. [DOI] [PubMed] [Google Scholar]
- 50.Calvin AD, Carter RE, Adachi T, et al. Effects of experimental sleep restriction on caloric intake and activity energy expenditure. Chest. 2013;144(1):79–86. doi: 10.1378/chest.12-2829. [DOI] [PMC free article] [PubMed] [Google Scholar]
- 51.Spaeth AM, Dinges DF, Goel N. Sex and race differences in caloric intake during sleep restriction in healthy adults. Am J Clin Nutr. 2014;100(2):559–566. doi: 10.3945/ajcn.114.086579. [DOI] [PMC free article] [PubMed] [Google Scholar]
- 52.St-Onge MP, Roberts AL, Chen J, et al. Short sleep duration increases energy intakes but does not change energy expenditure in normal-weight individuals. Am J Clin Nutr. 2011;94(2):410–416. doi: 10.3945/ajcn.111.013904. [DOI] [PMC free article] [PubMed] [Google Scholar]
- 53.Markwald RR, Melanson EL, Smith MR, et al. Impact of insufficient sleep on total daily energy expenditure, food intake, and weight gain. Proc Natl Acad Sci U S A. 2013;110(14):5695–5700. doi: 10.1073/pnas.1216951110. [DOI] [PMC free article] [PubMed] [Google Scholar]
- 54.Fang Z, Spaeth AM, Ma N, et al. Altered salience network connectivity predicts macronutrient intake after sleep deprivation. Sci Rep. 2015;5(1):8215. doi: 10.1038/srep08215. [DOI] [PMC free article] [PubMed] [Google Scholar]
- 55.Heath G, Roach GD, Dorrian J, Ferguson SA, Darwent D, Sargent C. The effect of sleep restriction on snacking behaviour during a week of simulated shiftwork. Accid Anal Prev. 2012;45(Suppl):62–67. doi: 10.1016/j.aap.2011.09.028. [DOI] [PubMed] [Google Scholar]
- 56.Greer SM, Goldstein AN, Walker MP. The impact of sleep deprivation on food desire in the human brain. Nat Commun. 2013;4(1):2259. doi: 10.1038/ncomms3259. [DOI] [PMC free article] [PubMed] [Google Scholar]
- 57.Mossavar-Rahmani Y, Weng J, Wang R, et al. Actigraphic sleep measures and diet quality in the Hispanic Community Health Study/Study of Latinos Sueno ancillary study. J Sleep Res. 2017;26(6):739–746. doi: 10.1111/jsr.12513. [DOI] [PMC free article] [PubMed] [Google Scholar]
- 58.Spaeth AM, Dinges DF, Goel N. Effects of experimental sleep restriction on weight gain, caloric intake, and meal timing in healthy adults. Sleep. 2013;36(7):981–990. doi: 10.5665/sleep.2792. [DOI] [PMC free article] [PubMed] [Google Scholar]
- 59.Ohida T, Kamal AM, Uchiyama M, et al. The influence of lifestyle and health status factors on sleep loss among the Japanese general population. Sleep. 2001;24(3):333–338. doi: 10.1093/sleep/24.3.333. [DOI] [PubMed] [Google Scholar]
- 60.Kim S, DeRoo LA, Sandler DP. Eating patterns and nutritional characteristics associated with sleep duration. Public Health Nutr. 2011;14(5):889–895. doi: 10.1017/S136898001000296X. [DOI] [PMC free article] [PubMed] [Google Scholar]
- 61.Hogenkamp PS, Nilsson E, Nilsson VC, et al. Acute sleep deprivation increases portion size and affects food choice in young men. Psychoneuroendocrinology. 2013;38(9):1668–1674. doi: 10.1016/j.psyneuen.2013.01.012. [DOI] [PubMed] [Google Scholar]
- 62.Chapman CD, Nilsson EK, Nilsson VC, et al. Acute sleep deprivation increases food purchasing in men. Obesity (Silver Spring) 2013;21(12):E555–E560. doi: 10.1002/oby.20579. [DOI] [PubMed] [Google Scholar]
Associated Data
This section collects any data citations, data availability statements, or supplementary materials included in this article.


