Abstract
Study Objectives:
Body posture has a significant impact on the presence and severity of obstructive sleep apnea (OSA). The majority of polysomnography (PSG) systems have the capacity to categorize body (torso) posture as supine, left-lateral, right-lateral or prone, each within a 90-degree range. However, such broad categorization may limit the identification of subtle relationships between posture and OSA severity. The aim of this study was to quantify sleeping posture as a continuous variable; and to develop an intuitive tool for visualizing the relationship between body posture and OSA severity.
Methods:
A customized triaxial accelerometer-based posture sensor which quantifies torso posture as a continuous variable was developed. 38 participants attending the sleep laboratory for suspected OSA were recruited. Each participant underwent a diagnostic PSG with an additional customized posture sensor securely attached to the sternum. Individual data were presented using a novel circular histogram-based visualization which displays sleeping position and position-specific OSA severity.
Results:
Acceptable measurements were obtained in 21 participants. The mean ± standard deviation percentage of total sleep time spent within ± 15 degrees of the center of supine, left-lateral, right-lateral and prone was 59.7 ± 26.0%. A further 40.3 ± 26.0% of sleep time was spent in intermediate positions outside these traditional categorizations. The novel visualization revealed a wide variety of positional OSA phenotypes.
Conclusions:
Quantification of torso posture as a continuous variable and analysis of these data using a novel visualization enables the identification of subtle relationships between body posture and OSA severity that are not apparent using standard clinical sensors and summary statistics.
Citation:
Tate A, Walsh J, Kurup V, Shenoy B, Mann D, Freakley C, Eastwood P, Terrill P. An emerging technology for the identification and characterization of postural-dependent obstructive sleep apnea. J Clin Sleep Med. 2020;16(2):309–318.
Keywords: accelerometry, obstructive sleep apnea, postural-dependent obstructive sleep apnea, sleeping posture, supine predominant obstructive sleep apnea
BRIEF SUMMARY
Current Knowledge/Study Rationale: Sleeping posture has a significant impact on obstructive sleep apnea (OSA) severity in many individuals and is currently measured by categorizing sleeping position into four discrete postures: supine, left-lateral, right-lateral and prone. In this study we apply a novel measurement device to quantify torso posture as a continuous variable; and develop a method to visually display sleeping positions, time spent in each position and position-specific OSA severity.
Study Impact: These innovations allow more detailed phenotyping of postural dependent OSA in the individual; and we speculate that it may facilitate the identification of individuals most likely to respond to postural therapy.
INTRODUCTION
Sleeping posture has a significant impact on the presence and severity of obstructive sleep apnea (OSA),1 and body posture modification can be an effective primary or complementary therapy in some people.2 Despite emerging technologies, particularly modern accelerometer-based sensors which allow posture to be resolved on a finer scale, the majority of polysomnography (PSG) systems categorize torso posture as supine, left-lateral, right-lateral or prone, each with a 90-degree range. This is likely due to: (1) consistency with historical mercury-switch based sensors which only coarsely resolve position ranges; and (2) the present lack of an analytical technique to display and interpret finer resolution positional data and its relationship with sleep apnea severity.
If changes in body posture could be resolved at finer increments than the current 90-degree range, it might be possible to identify more subtle, but potentially clinically important, relationships between body posture and OSA severity. As such, we (1) developed a customized sensor for measuring torso rotation in degrees from supine, and (2) invented a graphical tool to allow a quick and intuitive assessment of the relationship between body posture and OSA severity. These two new technologies were applied to a cohort of patients with suspected OSA attending a sleep laboratory for a diagnostic PSG.
METHODS
Measuring torso posture using tri-axial accelerometry
The data from a stationary accelerometer allows the orientation of the sensor to be determined around the two axes of rotation perpendicular to the Earth’s gravitational field.3,4 Thus, a triaxial accelerometer securely attached to the torso of a participant can be utilized to resolve the rotation of the torso relative to a reference posture (ie a calibrated supine position). In practice, the combination of accelerometry and triaxial gyroscopic data fed into a Kalman filter was used to provide more accurate measurements during dynamic periods.5
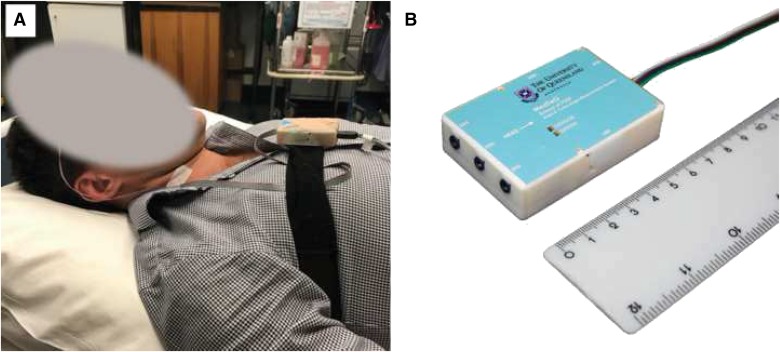
To facilitate this measurement in the sleep laboratory environment, we developed a customized sensor device at the University of Queensland, Brisbane, Queensland, Australia. This device contained a digital triaxial accelerometer (InvenSense MPU9150, Sunnyvale, California) which was sampled at 10 Hz with a dynamic range of ± 4 g and 16-bit resolution. A microcontroller was programmed to combine the accelerometry and gyroscopic data to a torso rotation measurement with a Kalman filter. Torso rotation was provided as an analog output to facilitate integration with conventional PSG acquisition systems. All components were contained within a 3D printed ABS (acrylonitrile butadiene styrene) plastic case (approximately 70 mm × 30 mm × 10 mm). A physical accuracy validation test of the device was performed using a THORLABS manual goniometer (PR01, Newton, New Jersey) with half-degree resolution, whereby ‘posture’ was manipulated and measured in 10-degree increments over a 180-degree range. This process was repeated ten times to ensure consistency.
Participants and procedures
Patients attending the sleep laboratory at Sir Charles Gardiner Hospital for an overnight diagnostic PSG to investigate suspected OSA were invited to participate in the study. In total, 38 participants provided informed consent and were enrolled in the study.
Patients underwent a clinical diagnostic PSG with the addition of the minimally invasive posture sensor. The diagnostic PSG included nasal prongs, thermistor, EEG, pulse oximetry, ECG, RIP bands, EMG, and the traditional posture sensor. The customized posture sensor was affixed directly to the sternum with tape (first 12 participants), or securely fastened with an elasticized band around the chest (Figure 1). To account for variation in the torso shape of participants and specific placement of the device, the reference supine position was calibrated by asking the participant to lie as still as possible with the body supine and horizontal to the floor. The reference position was then defined as the average over a 10 second period. Sleep staging and respiratory and arousal events were manually scored by experienced sleep scientists according to the 2012 criteria of the American Academy of Sleep Medicine.6
Figure 1. Customized torso posture measurement device.
(A) The custom posture measurement device was affixed in a sternal placement using either an elasticized band around the chest (shown) or taped directly to the chest. (B) The custom posture measurement device was approximately 70 mm × 30 mm × 10 mm, and was encapsulated in a 3D printed plastic case.
This study was approved by the Human Research Ethics Committees at the Sir Charles Gardiner Hospital (reference 2010-144) and the University of Queensland (reference 2015000719). US Federal Drug Administration or Australian Therapeutic Goods Administration regulatory approval of the device has not been sought for this device at time of publishing.
Data analysis and visualization
Data preprocessing
Physiological data (in European Data Format7), scored respiratory events and hypnogram data were imported into Matlab (The MathWorks, Inc., Natick, Massachusetts, United States), where all channels were resampled at 100 Hz for further analysis.
Limitation of conventional clinical definitions in quantifying torso posture
To examine the limitations of standard 90-degree clinical definitions of sleeping posture, torso posture data were analyzed to determine the percentage of time that each participant slept within reasonable bounds (± 15 degrees) of the conventionally defined anatomical positions. Specifically, the percentage of total sleep time spent in each of the following positions was calculated: supine position (0 ± 15 degrees); left lateral position (270 ± 15 degrees); right lateral position (90 ± 15 degrees); and prone position (180 ± 15 degrees). The percentage of total sleep time spent in intermediate positions was also calculated.
Visualization of relationship between posture and sleep apnea severity
One of the key challenges in moving from discrete categorizations of postural data to a continuous variable is the additional complexity of the data, and subsequently, the challenges associated with displaying and interpreting such data and its relationships with other important variables (ie sleep apnea severity). In this study we invented a graphic that combined multiple variables of interest. This graphic is founded on a circular histogram which describes the percentage of sleep time as a function of degrees of rotation. This can be presented most naturally on a circular map whereby the angular position of slices describes the torso rotation and the radial length of the wedges describes the proportion of the night spent in that position. A similar concept has previously been used by Tiotiu et al to characterize discrete postures.8
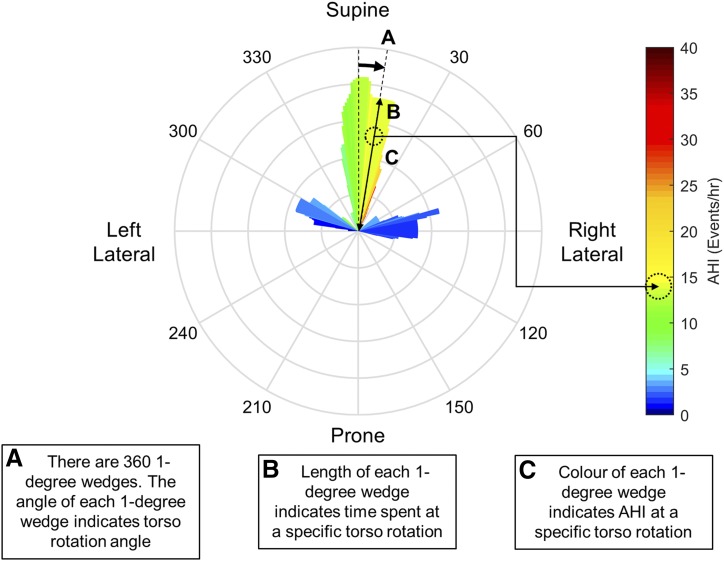
We extend the standard circular histogram by defining bin centers at each integer degree of rotation (ie, 0, 1, 2, …359 degrees), and then calculating the percentage of the night spent at that position ±15 degrees. This leads to a circular histogram plot with 360 individual wedges each 1 degree wide (but representing the time spent across a 30 degree range). ie the wedge at 90 degrees represents the percentage of the night spent between 75 and 105 degrees; the wedge at 91 degrees represents the percentage of the night spent between 76 and 116 degrees; and so on. This process has a smoothing effect analogous to a moving average filter in time-series data. The sleep apnea severity corresponding to these positions were quantified by calculating the apnea-hypopnea index (AHI) associated with that “wedge” by calculating the number of apneas and hypopnea occurring in that position range and dividing by the total time spent in that position. This is then communicated on the image by coloring each wedge according to a heat-map (ie, representing individual values of AHI as colors). Figure 2 shows an illustrative tutorial example for interpreting these figures.
Figure 2. Infographic describing interpretation of a posture severity plot.
(A) The circular axis, marked around the edge of the circle, corresponds to a particular torso position; 0 degrees is supine, 90 degrees is right lateral, 180 degrees is prone, and 270 degrees is left lateral. (B) At each particular angle of torso posture there extends a narrow “wedge.” The length of this wedge indicates the relative time spent at that exact angle ± 15 degrees. Therefore, taken around the entire circle, the wedge lengths represent a smoothed histogram of how much time a patient spends in a particular position. (C) The apnea-hypopnea index (AHI) associated with each individual wedge is calculated as the number of apneas and hypopneas occurring in that position, divided by the total time spent in that position. This position-specific AHI is communicated by coloring the wedge with a heat-map. This visualization therefore allows a clinician to quickly identify positional dependence of OSA in an individual with a high resolution; and therefore use this information to assist in recommending a postural therapy.
This single graphic therefore conveniently communicates what position(s) an individual patient slept in; how long they spent in each position; and the relationship between those positions and sleep apnea severity. These data and images were produced for each participant for total sleep time.
RESULTS
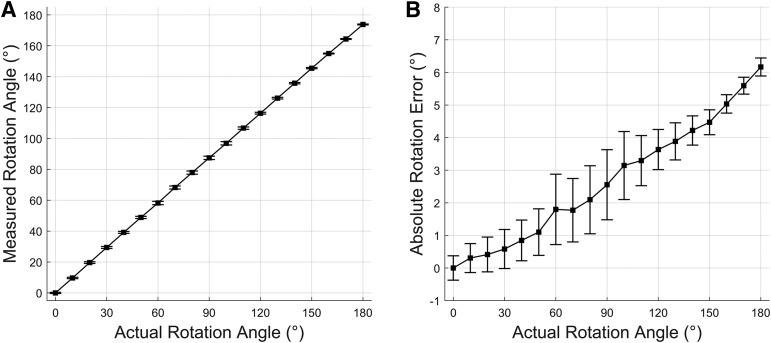
The device measured angular error was found to be an average of 2.6 degrees across the full range of 180 degrees (Figure 3). Higher angles were associated with greater error.
Figure 3. Accuracy validation of torso posture measurement device.
(A) Measured rotation angle very closely replicates actual rotation angle. Actual rotation angle is measured by a THORLABS PR01 manual goniometer mounted to a wooden rig. Error bars show standard deviation of ten repeated experiments. (B) Absolute error of rotation angle. Error is associated with rotation angle due to imperfect alignment of sensor axes with gravity. Error bars show standard deviation of ten repeated experiments.
This was the first study in which the customized torso sensor device was used, and of the 38 participants recruited, 17 were excluded from further analysis due to a technical device failure or detachment of the device during the night (as either noted by the technician or by manual inspection of the data). The 21 remaining participants (11 male) had a mean age of 51.0 (range 19–76) years, and a mean AHI of 24.2 (range 2.8–75.7) events/h.
There was large inter-subject variability in the distribution of sleeping posture. The mean percentage ± standard deviation of total sleep time spent within ± 15 degrees of supine, left-lateral, right-lateral, and prone was 39.7 ± 25.1%, 6.5 ± 8.4%, 12.5 ± 15.0% and 1.0 ± 4.2% respectively. Consequently, 40.3 ± 26.1% of total sleep time was spent in intermediate positions outside the bounds of these standard anatomical positions.
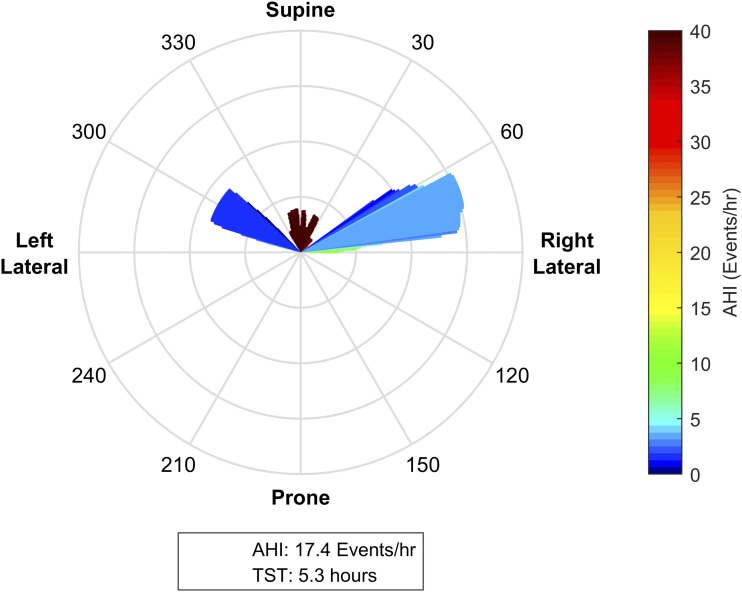
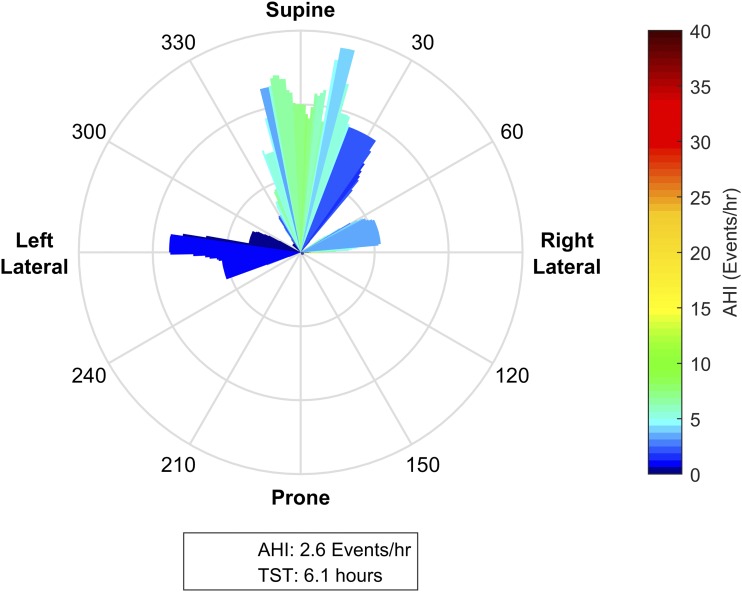
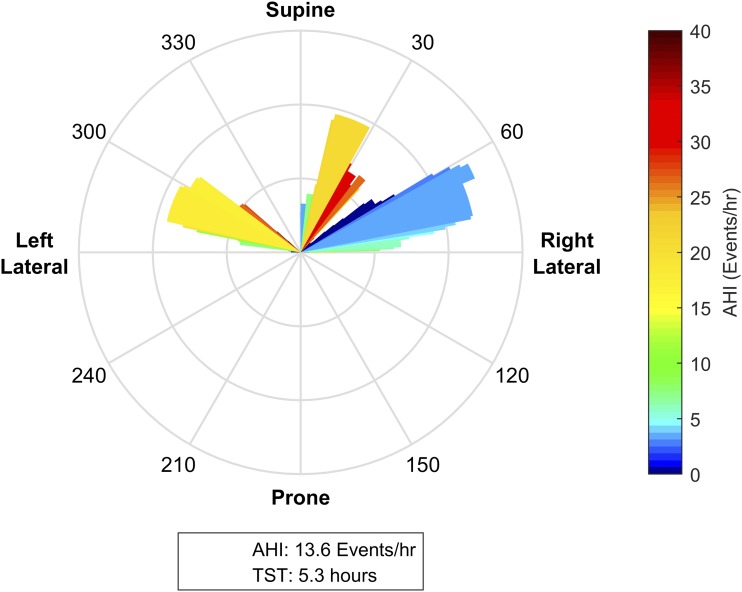
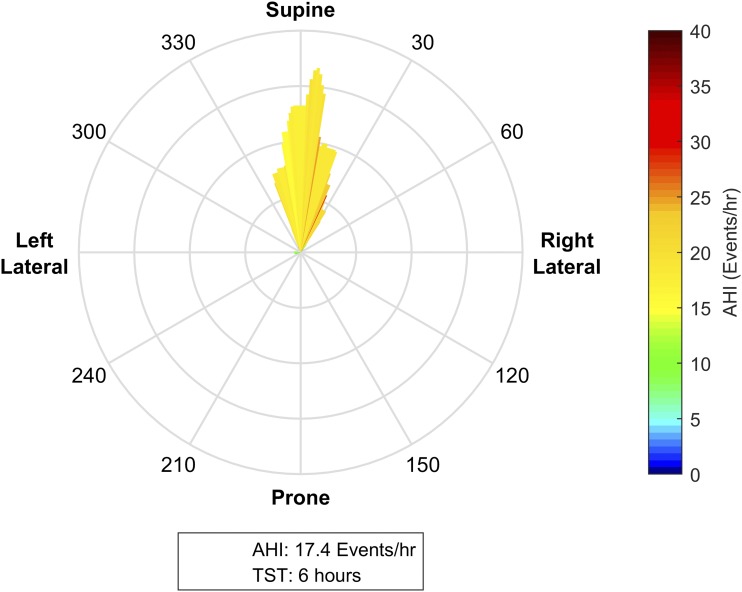
There was substantial variation across the cohort in both the torso rotation histogram and the relationship with OSA severity. Figure 4, Figure 5, Figure 6, Figure 7, and Figure 8 show illustrative examples of the posture-OSA severity visualization tool which highlight key characteristics in inter-subject postural variation and OSA severity.
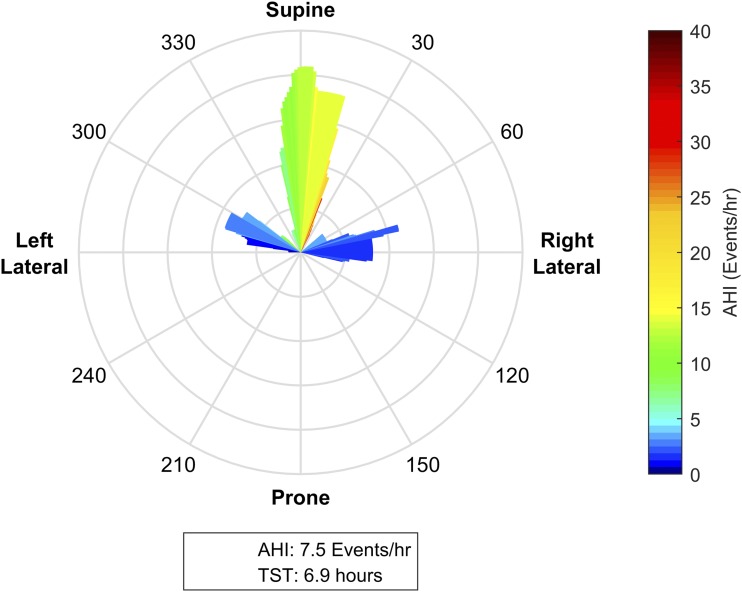
Figure 4. Mild supine predominant obstructive sleep apnea.
This patient spent the majority of the night within ± 15 degrees of supine; other significant portions of the night were between 270–300 degrees (supine of left lateral) and between 60–90 degrees (right lateral). While the patient has an overall apnea-hypopnea index (AHI) of 7.5 events/h, when the patient is in the supine position range, the posture specific AHI is predominantly in the moderate range of 15–25 events/h. With the available postural data, we can infer that with torso rotation of 60 degrees or more from supine, the position specific AHI reduces to 0–5 events/h. As such, positional therapy to prevent sleeping postures within ± 60 degrees of supine could potentially control this individual’s sleep apnea. The presence of significant periods of lateral sleep in the observational study indicates that this individual is likely to be able to tolerate a postural therapy.
Figure 5. Supine-predominant obstructive sleep apnea patient who self-selects to sleep nonsupine.
This patient spent significant portions of the night between 290–310 degrees (supine of left lateral); and between 60–80 degrees (supine of right lateral). The patient also spent a small period of the night within ± 30 degrees of supine. This patient has an overall AHI of 18.4 events/h, which is concentrated almost entirely in the small percentage of the night that the patient spent in the supine position where we observe position specific AHIs of > 40 events/h. In contrast, when sleeping in the left and right lateral positions, the posture-specific AHIs reduce to < 5 events/h. Providing a postural therapy to prevent sleeping within ± 60 degrees of supine appears likely to almost fully control this individual’s sleep apnea. The relatively small period of supine sleep indicates that this patient self-selects nonsupine positions, and is likely to tolerate a postural therapy.
Figure 6. Subtle postural dependence.
This patient spent significant portions of the night within ± 30 degrees of supine, between 240–300 degrees (± 30 degrees of left lateral), and between 60–90 degrees (just supine of right lateral). While the patient has an overall apnea-hypopnea index (AHI) of 2.6 events/h, the posture-specific AHI is as high as 18 events/h when the patient is in the supine position. Notably, with torso rotation as little as 15 degrees to the left of supine, the position specific AHI reduces to approximately < 5 events/h. These data suggest that in this individual, effective treatment may be achieved with mild postural manipulations (ie, a small wedge under one shoulder). In patients who prefer to sleep supine, such interventions may be more tolerable than therapies that enforce lateral sleep.
Figure 7. No clear relationship between torso posture and obstructive sleep apnea severity.
This patient spent significant portions of the night between 20–35 degrees (right of supine), between 60–90 degrees (supine of right lateral), and between 270–300 degrees (supine of left lateral). While the apnea-hypopnea index (AHI) in the postures close to right lateral position were relatively low compared to the overall AHI, this was not reflected in the postures in left lateral position. As such, while there is clear variability in OSA severity across the night, there is no clear trend in the relationship between torso posture and AHI, suggesting that this patient is not a candidate for postural therapy.
Figure 8. Supine only sleeping position.
This patient spends almost their entire night in the supine position. The lack of variation in posture means that no assessment can be made about the relationship between posture and obstructive sleep apnea (OSA) severity. A simple survey about the preferred sleeping position at home may help to determine whether this postural variation reflects normal sleep, or may be an artifact of the sleep laboratory environment. Even if this person had position-dependent OSA that was able to be elucidated in a follow-up study with enforced lateral sleep, the apparent preference for supine sleep may suggest that the individual is unlikely to tolerate a postural therapy.
DISCUSSION
The objective of this study was to present and demonstrate the clinical utility of an emerging technology for characterizing the relationship between sleeping posture and OSA severity. This technology is composed of a sensor capable of measuring torso posture during sleep as a continuous variable (degrees of rotation from supine); and a graphical tool for visualizing the complex relationships between sleeping position, sleep duration and sleep apnea severity. Our results demonstrate: (1) a large inter-subject variability in sleeping posture; (2) that individuals spend significant periods of time in postures intermediate to the classically defined supine, left lateral, right lateral and prone positions; (3) that there is a complex relationship between posture and sleep apnea severity in many individuals. It is speculated that the information obtained from this technology may have the potential to quickly identify individuals who are likely to both respond and be adherent to postural therapies.
Measuring sleeping posture has been an area of interest since its relationship with sleep apnea severity was first described.9 Traditional measurements utilized mercury switch based sensors which coarsely resolve discrete postures: supine, left-lateral, right-lateral and prone. While further research work has documented posture measurements using a range of other technologies (including pressure sensitive beds/bedsheets, video analysis and other accelerometer based devices10–14), clinical analysis has continued to use discrete posture categorizations. However, triaxial accelerometer based sensors in particular have the capacity to resolve orientation in space with fine resolution and such measurements are routine in other fields such as avionics and robotics.15,16 Indeed, many readers will be familiar with smart-phone applications that measure inclination. It is therefore no surprise that since commencing this study, sensors which measure sleeping posture with fine resolution have become available commercially. As such, the key novelty of the emerging technology presented here is not the measurement of sleeping posture with a 1-degree resolution; but rather, exploiting these measurements by presenting the relationship between posture and OSA severity with an elegant and intuitive visualization.
Our results suggest that this technology has the ability to inform both clinical practice and further research. Critically, the ability to quickly and intuitively communicate the sleeping posture and its relationship with sleep apnea severity may have the ability to improve the success of postural therapies by identifying: (1) individuals in whom postural therapy is likely to cure or significantly improve their disease; and (2) individuals who spend significant periods of the night in nonsupine positions, and are therefore likely to tolerate postural therapy better than patients who choose to primarily sleep supine. From a technical perspective, this visualization could easily be incorporated within a standard sleep study report where it could be interpreted in conjunction with standard clinical data. These data also demonstrate that the relationship between posture and OSA severity may be subtle, and that there are individuals (ie, Figure 6) in whom it appears that only a small postural intervention (ie, a foam wedge under one shoulder) is required to achieve therapeutic benefit. These subtle relationships may partially explain the documented night-to-night variability within an individual’s AHI.17 Although large inter-subject variability observed in this small cohort is consistent with earlier studies,18,19 the complexity of the variability also suggests that there may be several disparate causes of positional dependence in sleep apnea, the exact physiology of which remains unclear.
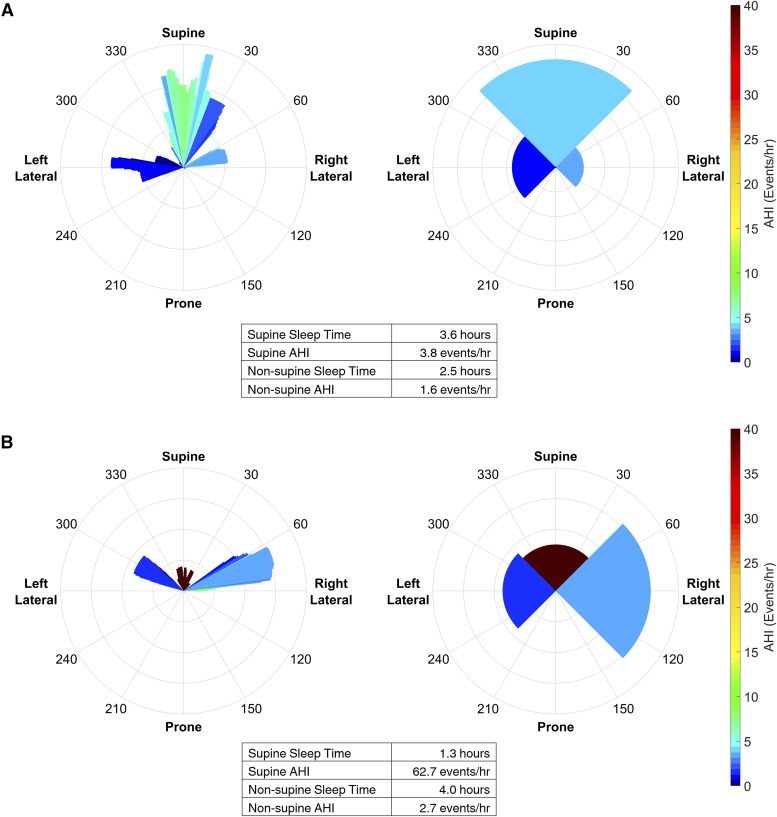
The initial motivation for the visualization was to communicate the detailed data available from the novel posture sensor. However, it is also possible to apply the visualization to data available from conventional discrete posture sensor whereby the circular histogram is simply divided into four quadrants corresponding to supine, prone, left and right lateral (thus presenting information that is currently available in tabulated format in PSG reports in a graphical form). This extends the utility of the visualization where adoption of new posture sensor hardware is difficult; but for the purposes of the current study, also allows (1) the value of the high resolution posture data to be further examined, and (2) the value of the visualization relative to typically reported summary statistics. Figure 9 highlights an individual where the novel sensor provides additional detail that may provide clinical insight (Figure 9A); and for an individual where it is unlikely to make a difference to a management decision (Figure 9B).
Figure 9. Adaption of the visualization for discrete posture data from a traditional sensor.
The visualization can also be applied to discretized posture data (ie, as available from conventional posture sensors) by simply dividing the circular histogram into four quadrants. (A) The visualization for the participant in Figure 6 using both the novel and discretized posture data. In this individual, the extra information from the high resolution sensor changes the interpretation of the posture dependent apnea severity. In the high resolution figure the patient has a supine AHI between 6–10 events/h (ie, mild OSA) when sleeping within approximately ± 10 degrees of supine. However, if the posture information is discretized into four values (ie, equivalent to a traditional sensor), the supine AHI falls within the normal range (ie, below 5 events/h). (B) The visualization for the participant in Figure 5 using both the novel and discretized posture data. It is clear that this individual has supine predominant OSA in both visualizations, and it is unlikely that utilizing the high resolution sensor would impact management decisions. The visualization of the discretized data allows a quick and intuitive interpretation of the data that is conventionally presented as summary statistics.
There are a number of limitations of this study. Firstly, this study applied an in-house manufactured sensor to a clinical cohort for the first time; and there were problems related to practical application and reliability. The sensor was initially attached using tape (first 12 participants). However, patients reported discomfort associated with the tape use, and this was modified thereafter to affixation with an elasticized band. The rate of data loss was high in both methods, with data from 17 of the 38 participants being inadequate for final analysis. Typical causes of failure included device software configuration errors, batteries running flat, and the device becoming unplugged during the night. Improvements to the device hardware, usability and overnight staff training will ensure future applications of this device have substantially lower data loss. Second, this was a small cohort of patients with a relatively high proportion of women.20 Third, sleep state and time-of-night have not been examined in this analysis, and may explain some of the within-patient variability in AHI that has been attributed to torso posture in this study.21–23 It is possible to generate the visualization for specific sleep states and/or time of night, and clinically it would be possible to distinguish postural effects from these other factors. Similarly, we did not quantify head posture which may also influence OSA severity.22,24 Finally, the color-based information may be lost if clinical reports are reviewed in black and white . This may be addressed by providing an option to produce a gray-scale intensity version of the figure. Future work should address these limitations by examining a much larger cohort, and ideally, measuring torso and head posture using a commercially available sensor to ensure generalizability. Ultimately, the efficacy of this technology needs to be validated by examining its ability to predict successful treatment with postural therapy and thereby improve patient outcomes.
In conclusion, we present a novel method for measuring and displaying the relationship between sleeping posture and sleep apnea severity. These methods elucidate information not available using conventional sensors and clinical metrics; and this emerging technology may assist in the identification of patients who are suitable candidates for postural therapy.
DISCLOSURE STATEMENT
This study was supported by a University of Queensland Early Career Researcher Grant; The Hull Family Donation at the Faculty of Engineering, Architecture and Information Technology at the University of Queensland; and a Sir Charles Gardiner Hospital Research Advisory Committee Grant. PR Eastwood is funded by a National Health and Medical Research Council Senior Research Fellowship [No. 1136548]. Commercialization of this technology has been pursued with a number of commercial entities, but there are no financial or other agreements in place at the time of writing this manuscript. The authors report no conflicts of interest.
EDITOR'S NOTE
The Emerging Technologies section focuses on new tools and techniques of potential utility in the diagnosis and management of any and all sleep disorders. The technologies may not yet be marketed, and indeed may only exist in prototype form. Some preliminary evidence of efficacy must be available, which can consist of small pilot studies or even data from animal studies, but definitive evidence of efficacy will not be required, and the submissions will be reviewed according to this standard. The intent is to alert readers of Journal of Clinical Sleep Medicine of promising technology that is in early stages of development. With this information, the reader may wish to (1) contact the author(s) in order to offer assistance in more definitive studies of the technology; (2) use the ideas underlying the technology to develop novel approaches of their own (with due respect for any patent issues); and (3) focus on subsequent publications involving the technology in order to determine when and if it is suitable for application to their own clinical practice. The Journal of Clinical Sleep Medicine and the American Academy of Sleep Medicine expressly do not endorse or represent that any of the technology described in the Emerging Technologies section has proven efficacy or effectiveness in the treatment of human disease, nor that any required regulatory approval has been obtained.
ACKNOWLEDGEMENTS
The authors thank all who participated in this study. Author contributions: conception and study design: AT, JW, PE, PT; analysis and interpretation: all authors; drafting the manuscript for important intellectual content: all authors.
ABBREVIATIONS
- AHI
apnea-hypopnea index
- OSA
obstructive sleep apnea
REFERENCES
- 1.Oksenberg A, Silverberg DS, Arons E, Radwan H. Positional vs nonpositional obstructive sleep apnea patients: anthropomorphic, nocturnal polysomnographic, and multiple sleep latency test data. Chest. 1997;112(3):629–639. doi: 10.1378/chest.112.3.629. [DOI] [PubMed] [Google Scholar]
- 2.Joosten SA, O’Driscoll DM, Berger PJ, Hamilton GS. Supine position related obstructive sleep apnea in adults: pathogenesis and treatment. Sleep Med Rev. 2014;18(1):7–17. doi: 10.1016/j.smrv.2013.01.005. [DOI] [PubMed] [Google Scholar]
- 3.Tan C-W, Park S. Design of accelerometer-based inertial navigation systems. IEEE Trans Instrum Meas. 2005;54(6):2520–2530. [Google Scholar]
- 4.Pedley M. Tilt Sensing Using a Three-Axis Accelerometer. Austin, TX: Freescale Semiconductor, Inc.; 2013. [Google Scholar]
- 5.Zihajehzadeh S, Loh D, Lee M, Hoskinson R, Park EJ. A cascaded two-step Kalman filter for estimation of human body segment orientation using MEMS-IMU. Conf Proc IEEE Eng Med Biol Soc. 2014;2014:6270–6273. doi: 10.1109/EMBC.2014.6945062. [DOI] [PubMed] [Google Scholar]
- 6.Berry RB, Budhiraja R, Gottlieb DJ, et al. Rules for scoring respiratory events in sleep: update of the 2007 AASM Manual for the Scoring of Sleep and Associated Events. Deliberations of the Sleep Apnea Definitions Task Force of the American Academy of Sleep Medicine. J Clin Sleep Med. 2012;8(5):597–619. doi: 10.5664/jcsm.2172. [DOI] [PMC free article] [PubMed] [Google Scholar]
- 7.Kemp B, Värri A, Rosa AC, Nielsen KD, Gade J. A simple format for exchange of digitized polygraphic recordings. Electroencephalogr Clin Neurophysiol. 1992;82(5):391–393. doi: 10.1016/0013-4694(92)90009-7. [DOI] [PubMed] [Google Scholar]
- 8.Tiotiu A, Mairesse O, Hoffman G, Todea D, Noseda A. Body position and breathing abnormalities during sleep: a systematic analysis. Pneumologica. 2011;60(4):216–221. [PubMed] [Google Scholar]
- 9.Cartwright RD. Effect of sleep position on sleep apnea severity. Sleep. 1984;7(2):110–114. doi: 10.1093/sleep/7.2.110. [DOI] [PubMed] [Google Scholar]
- 10.Alihanka J, Vaahtoranta K. A static charge sensitive bed. A new method for recording body movements during sleep. Electroencephalogr Clin Neurophysiol. 1979;46(6):731–734. doi: 10.1016/0013-4694(79)90113-5. [DOI] [PubMed] [Google Scholar]
- 11.Liu JJ, Xu W, Huang MC, et al. A dense pressure sensitive bedsheet design for unobtrusive sleep posture monitoring. In: Proceedings from the 2013 IEEE International Conference on Pervasive Computing and Communications (PerCom); March 18-22, 2013. [Google Scholar]
- 12.Wang C-W, Hunter A, Gravill N, Matusiewicz S. Real time pose recognition of covered human for diagnosis of sleep apnoea. Comput Med Imaging Graph. 2010;34(6):523–533. doi: 10.1016/j.compmedimag.2009.11.004. [DOI] [PubMed] [Google Scholar]
- 13.Huang W, Wai AAP, Foo SF, Biswas J, Hsia CC, Liou K. Multimodal Sleeping Posture Classification. In: Proceedings from the 2010 20th International Conference on Pattern Recognition; August 23-26, 2010. [Google Scholar]
- 14.Yoon H, Hwang S, Jung D, et al. Estimation of sleep posture using a patch-type accelerometer based device. Conf Proc IEEE Eng Med Biol Soc. 2015;2015:4942–4945. doi: 10.1109/EMBC.2015.7319500. [DOI] [PubMed] [Google Scholar]
- 15.Roberts A, Tayebi A. A new position regulation strategy for VTOL UAVs using IMU and GPS measurements. Automatica. 2013;49(2):434–440. [Google Scholar]
- 16.Ghassemi F, Tafazoli S, Lawrence PD, Hashtrudi-Zaad K. Design and calibration of an integration-free accelerometer-based joint-angle sensor. IEEE Trans Instrum Meas. 2008;57(1):150–159. [Google Scholar]
- 17.Joosten SA, O’Donoghue FJ, Rochford PD, et al. Night-to-night repeatability of supine-related obstructive sleep apnea. Ann Am Thorac Soc. 2014;11(5):761–769. doi: 10.1513/AnnalsATS.201309-306OC. [DOI] [PubMed] [Google Scholar]
- 18.Tiotiu A, Mairesse O, Hoffmann G, Todea D, Noseda A. Body position and breathing abnormalities during sleep: a systematic study. Pneumologia. 2011;60(4):216–221. [PubMed] [Google Scholar]
- 19.Joosten SA, Hamza K, Sands SA, Turton A, Berger PJ, Hamilton GS. Phenotypes of patients with mild to moderate obstructive sleep apnoea as confirmed by cluster analysis. Respirology. 2012;17(1):99–107. doi: 10.1111/j.1440-1843.2011.02037.x. [DOI] [PubMed] [Google Scholar]
- 20.Young T, Peppard PE, Gottlieb DJ. Epidemiology of obstructive sleep apnea. Am J Respir Crit Care Med. 2002;165(9):1217–1239. doi: 10.1164/rccm.2109080. [DOI] [PubMed] [Google Scholar]
- 21.Montserrat JM, Kosmas EN, Cosio MG, Kimoff RJ. Mechanism of apnea lengthening across the night in obstructive sleep apnea. Am J Respir Crit Care Med. 1996;154(4):988–993. doi: 10.1164/ajrccm.154.4.8887596. [DOI] [PubMed] [Google Scholar]
- 22.van Kesteren ER, van Maanen JP, Hilgevoord AAJ, Laman DM, de Vries N. Quantitative effects of trunk and head position on the apnea hypopnea index in obstructive sleep apnea. Sleep. 2011;34(8):1075–1081. doi: 10.5665/SLEEP.1164. [DOI] [PMC free article] [PubMed] [Google Scholar]
- 23.Pevernagie DA, Shepard JW., Jr Relations between sleep stage, posture and effective nasal CPAP levels in OSA. Sleep. 1992;15(2):162–167. doi: 10.1093/sleep/15.2.162. [DOI] [PubMed] [Google Scholar]
- 24.Drakatos P, Higgins SE, Kosky CA, Muza RT, Williams AJ. The value of video polysomnography in the assessment of intermittent obstructive sleep apnea. Am J Respir Crit Care Med. 2013;187(10):e18–e20. doi: 10.1164/rccm.201207-1152IM. [DOI] [PubMed] [Google Scholar]


