Abstract
Purpose
To further understand the relationship between cardiac function and flow, on the basis of sex, by quantifying cardiac flow characteristics and relating them to cardiac muscle performance in young adults.
Materials and Methods
In this cross-sectional study, cardiac four-dimensional flow MRI and two-dimensional cine MRI were performed in 20 male and 19 female volunteers aged 20–35 years. Velocity-based metrics of flow, kinetic energy (KE), vorticity, and efficiency indexes were quantified, as well as cardiac strain metrics.
Results
Peak systolic blood KE (men: 4.76 mJ ± 2.66 [standard deviation]; women: 3.36 mJ ± 1.43; P = .047) was significantly higher in the male left ventricle (LV) than in the female LV. Peak systolic vorticity index (men: 0.008 radian · m2/mL · sec ± 0.005; women: 0.014 radian · m2/mL · sec ± 0.007; P = .007), peak diastolic vorticity index (men: 0.007 radian · m2/mL · sec ± 0.006; women: 0.014 radian · m2/mL · sec ± 0.010; P = .015), and cycle-average vorticity (men: 0.006 radian/sec ± 0.001; women: 0.011 radian/sec ± 0.002; P = .001) were significantly higher in the LV of women than they were in the LV of men. Radial, circumferential, and long-axis strain metrics were significantly higher in the female LV than in the male LV (P < .05). Circumferential systolic and diastolic strain rates displayed moderate correlation to peak systolic (r = −0.38; P = .022) and diastolic vorticity (r = 0.40; P = .015) values, respectively. Results are reported as mean ± standard deviation.
Conclusion
LV vorticity metrics were observed to be higher in women than in men and displayed moderate correlation to cardiac strain metrics. The methods and results of this study may be used to further understand the sex-based cardiac efficiency relationship between cardiac function and flow.
© RSNA, 2020
See also the commentary by Ordovas in this issue.
Summary
Left ventricular blood flow vorticity metrics were observed to be higher in women than in men and displayed moderate correlation to cardiac strain metrics; the methods and results of this study may be used to further understand the sex-based cardiac efficiency relationship between cardiac function and flow.
Key Points
■ Cardiac flow data were obtained from 20 healthy men and 19 healthy women using four-dimensional flow MRI.
■ MRI-derived parameters of blood flow kinetic energy (higher in men), vorticity (higher in women), and cardiac strain (higher in women) were compared between sexes.
■ Moderate positive correlations were observed between the left ventricular blood flow kinetic energy and circumferential strain; such metrics and relationships may indicate discrepancies in cardiac efficiency between sexes.
Introduction
To understand why the hearts of men and women respond differently to physiologic stresses and disease, efforts have been made to determine sex differences in cardiovascular function in healthy populations (1–3). Sex differences have been detected in myocardial contractile performance, resting heart rate, cardiac growth, stroke volume response to exercise, and arterial blood pressure (1,4). Differences in myocyte contraction have been supported by evidence of higher circumferential and longitudinal strain in the left ventricle (LV) of women than in the LV of men using cardiovascular MRI feature tracking (5,6). However, the relationship of such metrics as a strain to the output of the heart (blood flow) has not yet been fully explained.
A method that has recently gained traction in the evaluation of cardiac function is flow analysis with four-dimensional (4D) flow MRI. Through analysis of blood velocity and derived hemodynamic metrics, cardiac energetics and components of cardiac work can be analyzed (7–16). Kinetic energy (KE) metrics, in particular, may indicate the amount of energy that is dissipated in blood motion and, therefore, can be used with flow parameters to provide ventricular efficiency indexes. Furthermore, KE can be calculated with velocity information alone, making its analysis much less invasive. It has also been suggested that a healthy heart will remain efficient by minimizing the dissipation of KE through the formation of large vortex rings (11,12,17). Recent KE and vortex studies have provided insight into the flow dynamics of a variety of heart diseases (7,9,11–14,17–20). Some work has also been done to compare the regional ventricular blood flow vortex development across sex and age (21). However, to our knowledge, no study to date has examined differences in both KE and vorticity metrics, and their relationship to cardiac strain, between the LV of men and women by using 4D flow MRI. Therefore, the purpose of this study was to determine sex differences in ventricular flow dynamics, coupled with cardiac strain, of healthy volunteers.
Materials and Methods
Human Participants
In this institutional review board–approved and Health Insurance Portability and Accountability Act–compliant study, data from 39 healthy volunteers (20 men: mean age 25.8 years ± 2.7 [standard deviation]; 19 women: mean age 27.1 years ± 2.9) were used. Data from 19 healthy volunteers were analyzed retrospectively. Of these retrospective 19 volunteers, 15 volunteers overlapped with a study examining differences in cardiac flow between single-ventricle patients and healthy volunteers (14). The remaining four data sets (from the retrospective 19 volunteers) were from preliminary work aimed at setting up the analysis methods of this study. When differences were observed in our original retrospective cases, 20 additional volunteers were recruited prospectively as per the power analysis described in the Statistical Analysis section of this study. Written informed consent was obtained, and each healthy participant underwent a health screening for cardiovascular disease before enrollment. Body surface area was calculated for each participant based on height and weight, except for the original four preliminary study participants, whose heights were not recorded.
MRI Flow Acquisition
For the 4D flow MRI acquisition, the participants were scanned on a 3.0-T clinical system (MR750 and Signa Premier; GE Healthcare, Waukesha, Wis) using an investigational 4D flow MRI sequence known as phase-contrast with vastly undersampled isotropic projection reconstruction (22,23). The 4D flow MRI parameters were 1.25-mm isotropic spatial resolution, 320-mm field of view, 6.2-msec repetition time, 160 cm/sec velocity encoding, and 11-minute scan time. A method for double gating to the electrocardiographic and respiratory cycles was used. This respiratory gating method was based on a bellows signal, and it provided a series of cardiac flow data for separate respiratory phases during a single free-breathing scan (24). A moving average filter was applied to the respiratory waveform to subdivide data into two 4D flow MRI data sets: above and below the moving average bellows signal. A 40% acceptance threshold above and below the moving average for each respiratory cycle was applied to mitigate potential motion during active respiration. A contrast agent was used in the 15 healthy volunteers from the study examining single-ventricle flow to match the patient group in that study. However, the contrast agent was not administered in the prospectively recruited participants.
Two-dimensional (2D) cine images were obtained at increments throughout the heart of each volunteer in the short-axis, long-axis, two-chamber, and four-chamber orientations. Cine steady-state free precession images had imaging parameters of 146 × 146-mm field of view, 7-mm slice thickness, a flip angle of 45°, an echo time of 1.18 msec, a repetition time of 3.26 msec, and an x-y spatial resolution of 1.37 mm.
4D Flow MRI Analysis
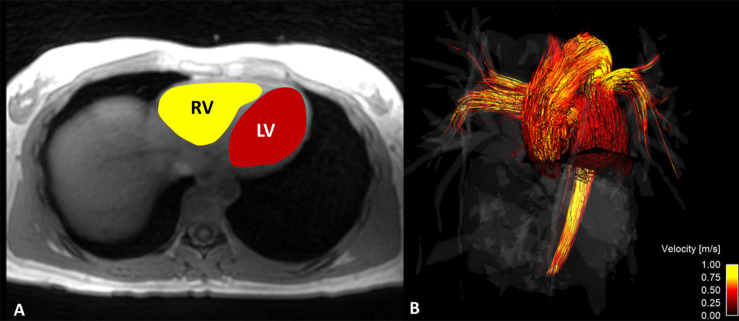
Segmentation.—Time-averaged magnitude images from the 4D flow MRI data were exported in Digital Imaging and Communications in Medicine format to semiautomatic segmentation software (Mimics; Materialise, Leuven, Belgium) to segment the right ventricle (RV) and LV of each participant. Time-averaged analysis was selected instead of a time-resolved analysis for a couple of reasons. First, the time-resolved images produced low ventricle boundary contrast, making reliable ventricular segmentation difficult. It has been shown in past work that the usage of time-resolved images for ventricular segmentation can lead to much higher intraobserver error in flow analysis metrics (25). Second, time-averaged data processing is much quicker relative to the decrease in ventricle accuracy that is obtained versus time-resolved processing, and, because data in this study were used for group comparison, the difference between group flow metrics was of more importance than the exact magnitude of individual metrics across the cardiac cycle. After segmentation, the time-averaged ventricular volumes were created by interpolating between the boundaries of the marked regions of each axial slice (Fig 1, A). The ventricular volume data were exported in gray value format to be used for the KE analysis.
Figure 1:
Four-dimensional (4D) flow MRI was used to calculate, A, kinetic energy in the right ventricle (RV) and left ventricle (LV). Time-averaged 4D flow MRI magnitude data were used to segment the RV and LV and, B, flow through the main pulmonary artery and ascending aorta.
Flow.—Time-resolved 4D flow MRI data were reconstructed into 14 time frames per cardiac cycle. For group analysis purposes, individual flow curves were registered by matching cardiac-cycle time frames according to peak systole. Phase offsets for Maxwell terms and eddy currents were corrected automatically during reconstruction (22,26). The eddy current correction was performed using a second-order polynomial fitting of background tissue segmented based on the thresholding of an angiogram. Velocity-weighted angiograms were calculated from the final velocity and magnitude data for all 14 time frames (23). Data were imported to Ensight (CEI, Apex, NC), where 2D analysis planes were placed orthogonal to the ascending aorta (AAo) and main pulmonary artery (MPA) (Fig 1, B). Flow (Q) measurements were made at each plane for each time frame of the cardiac cycle.
Kinetic energy.—The KE within each ventricle was quantified through an analysis of the MR image data files and ventricular volumes using Matlab (Mathworks, Natick, Mass). This calculation was made with the standard KE equation, KE = 1/2 mv2. The mass of blood, m, was calculated by multiplying the density of blood (ρ = 1060 kg/m3) by the volume of each voxel within the ventricle. The velocity, v, of each voxel was obtained throughout the cardiac cycle from the 4D flow MRI data. The KE from each voxel within the ventricular volume was then summed to obtain the total KE in both the RV (KERV) and LV (KELV) of each participant during all frames of the cardiac cycle. Finally, QMPA and QAAo were normalized to KERV and KELV, respectively, as an index of cardiac efficiency.
Efficiency index.—The aortic flow of each volunteer was normalized to the respective ventricular KE, as an index of cardiac efficiency. The resulting parameter was termed the efficiency index, with the intention of representing how much flow was generated per amount of KE dissipated. We hypothesized that a large amount of flow generated per a small amount of KE dissipated would indicate a more efficient system.
Vorticity.—Vorticity represents the magnitude of the three components of flow rotation:
,
|
where x, y, and z represent the three coordinate directions, and u, v, and w represent the velocity components in x, y, and z, respectively. As noted earlier, the degree of vortex formation may indicate the level of energy conservation in the ventricular flow. Using 4D flow MRI data, the components of flow rotation were computed within each voxel of the segmented ventricular volumes. The magnitudes of the three components of vorticity were computed and summed throughout each ventricle. This time-averaged calculation was performed for each participant in Ensight.
Cardiac Strain and Cardiac Function
Strain was calculated from 2D short-axis MR images based on the lengthening and shortening of the LV wall using Segment 2.2 R6423 (http://segment.heiberg.se/) software. Strain analysis reproducibility using Segment has been demonstrated in past work (27). Global systolic and diastolic strains were calculated for longitudinal, circumferential, and radial dimensions (28,29). Additionally, cardiac function metrics of stroke volume, end-diastolic volume, end-systolic volume, cardiac output, and ejection fraction were calculated using the Segment software.
Statistical Analysis
After analyzing data from the initial 19 retrospective volunteers, a power analysis was conducted to determine how many additional volunteers were needed to obtain sufficiently powered (90% power level) significant differences in flow metrics. Peak systolic vorticity index, LV peak systolic KE, and LV efficiency index parameters were chosen as the key analysis variables. Testing was based on obtaining a significant difference with a P value less than .05 in a two-tailed analysis. Per the analysis, it was determined that at least 18 additional participants were needed. Therefore, it was decided that 20 additional volunteers be prospectively recruited to obtain meaningful sex differences in several fluid dynamic parameters.
Hemodynamic parameters measured from volunteer data that were normally distributed were compared using a Student t test. Normality of the data was tested with both a D’Agostino-Pearson normality test and a Shapiro-Wilk normality test. For variables that were not definitively normally distributed, a Mann-Whitney U test was used for statistical analysis. However, it should be noted that a statistical analysis with both test types produced similar results on statistical significance. Pearson correlation coefficient analyses were also performed to determine the strength of correlations between the measured parameters. Results were visually plotted with cardiac-cycle averaged line plots and box plots to represent data spread. Summary results in the text were reported as mean ± standard deviation.
Results
4D Flow MRI
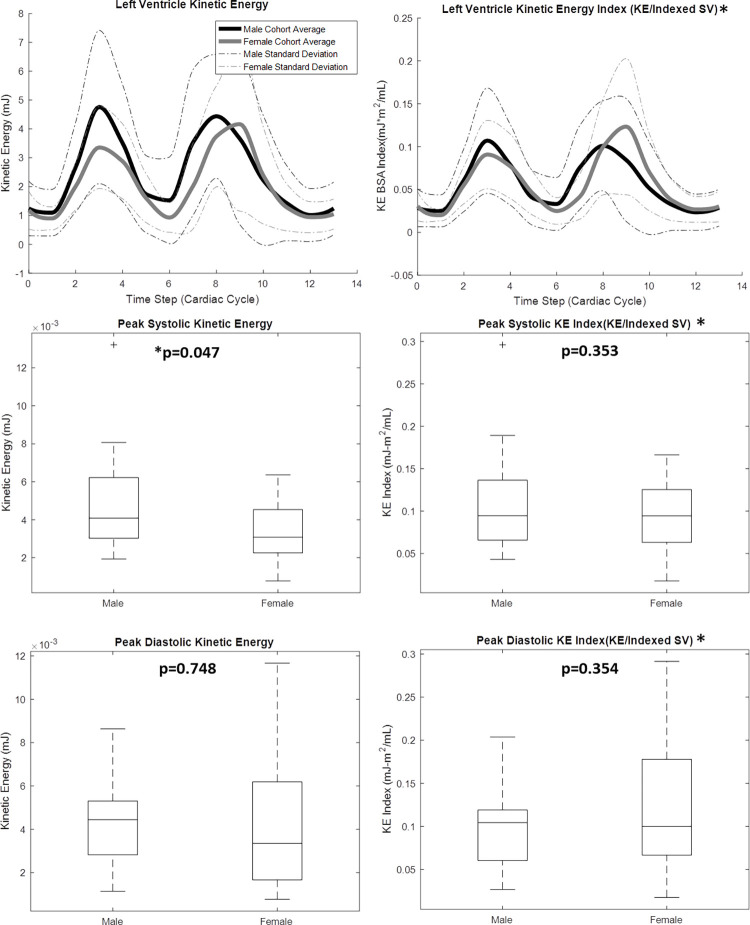
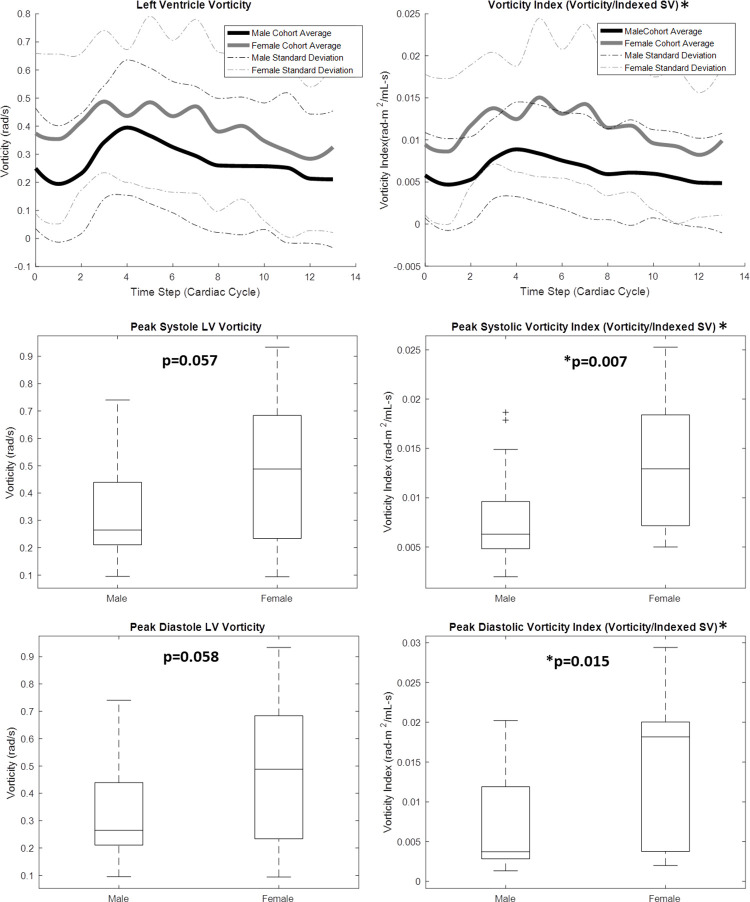
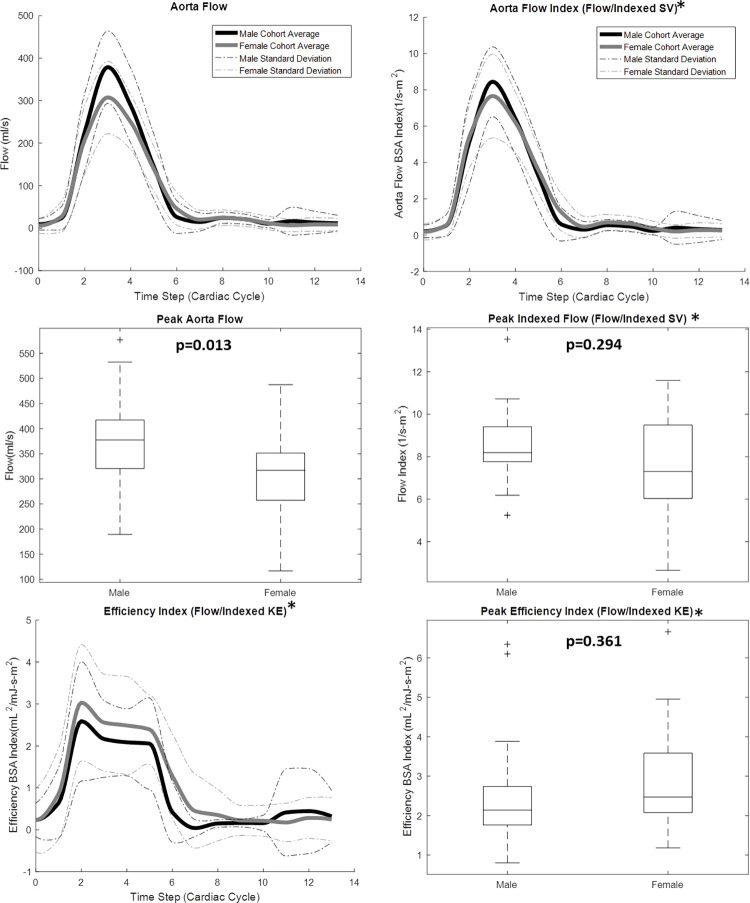
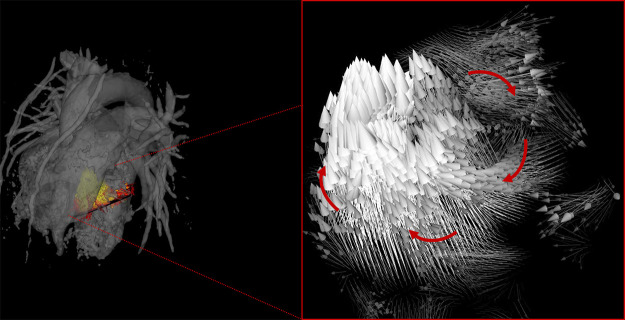
4D flow MRI–derived metrics were plotted across the group-average cardiac cycle for men and women, and peak flow parameters were compared between groups, as shown in Figures 2–4. As shown in Figure 2, peak systolic blood KE (men: 4.76 mJ ± 2.66; women: 3.36 mJ ± 1.43; P = .047) was significantly higher in the male LV than in the female LV. However, when KE was normalized to the stroke volume index, the peak systolic difference was not significant (men: 0.107 mJ-m2/mL ± 0.061; women: 0.091 mJ-m2/mL ± 0.040; P = .353). Furthermore, although visible differences were observed in the LV diastolic KE index between men and women (Fig 2, cardiac time step 8–10), they were not significant. Peak aortic flow (men: 378.96 mL/sec ± 85.21; women: 307.67 mL/sec ± 85.50; P = .013) was significantly higher in the aorta of men than in that of women (Fig 3). However, when the flow was normalized by the stroke volume index, peak systolic differences were not significant. The efficiency index was generally higher in women than in men (Fig 3), although this difference was also not significant. When analyzing LV blood flow vorticity, significant differences were observed in the peak systolic vorticity index (men: 0.008 radian ∙ m2/mL ∙ sec ± 0.005; women: 0.014 radian ∙ m2/mL ∙ sec ± 0.007; P = .007), peak diastolic vorticity index (men: 0.007 radian ∙ m2/mL ∙ sec ± 0.006; women: 0.014 radian ∙ m2/mL ∙ sec ± 0.010; P = .015), and cycle-average vorticity (men: 0.006 radian/sec ± 0.001; women: 0.011 radian/sec ± 0.002; P = .001). As shown in Figure 4, all of these vorticity markers were higher in the LV of women than in the LV of men. A qualitative representation of blood velocity vectors was generated in a plane of an LV, as shown in Figure 5.
Figure 2:
Four-dimensional flow MRI data were used to calculate left ventricular blood flow kinetic energy (KE) throughout the cardiac cycle for 20 healthy men and 19 healthy women. Cardiac function data from two-dimensional short-axis MR images were used, in conjunction with body surface areas (BSAs), to create a KE index parameter. Lines in box plots represent median values. *Indexed data were reported on 35 of the 39 volunteers: BSA was not recorded for four participants. SV = stroke volume.
Figure 4:
Four-dimensional flow MRI data were used to calculate left ventricular (LV) blood flow vorticity throughout the cardiac cycle for 20 healthy men and 19 healthy women. Cardiac function data from two-dimensional short-axis MR images were used, in conjunction with volunteer body surface areas (BSAs), to create a vorticity index parameter. *Indexed data were reported on 35 of the 39 volunteers: BSA was not recorded for four participants. Lines in box plots represent median values. SV = stroke volume.
Figure 3:
Four-dimensional flow MRI data were used to calculate aorta flow throughout the cardiac cycle for 20 healthy men and 19 healthy women. Cardiac function data from two-dimensional short-axis MR images were used, in conjunction with body surface areas (BSAs), to create an aorta flow index parameter. *Indexed data were reported on 35 of the 39 volunteers: BSA was not recorded for four participants. Lines in box plots represent median values. KE = kinetic energy, SV = stroke volume.
Figure 5:
Four-dimensional flow MRI data were used to create velocity vector visualizations of left ventricle blood flow throughout the cardiac cycle in healthy volunteers. Through this visualization, areas of vortex formation were observed, as emphasized with arrows.
Myocardial Strain
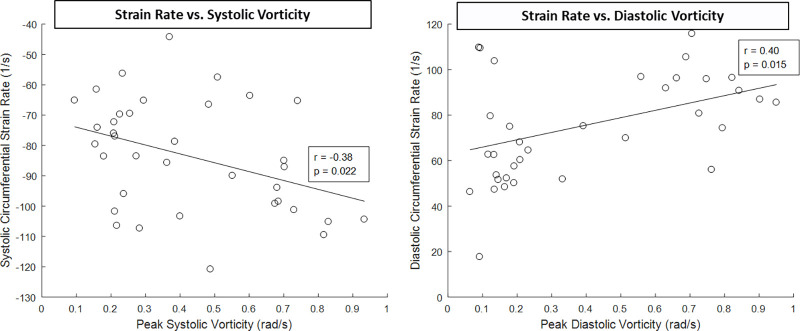
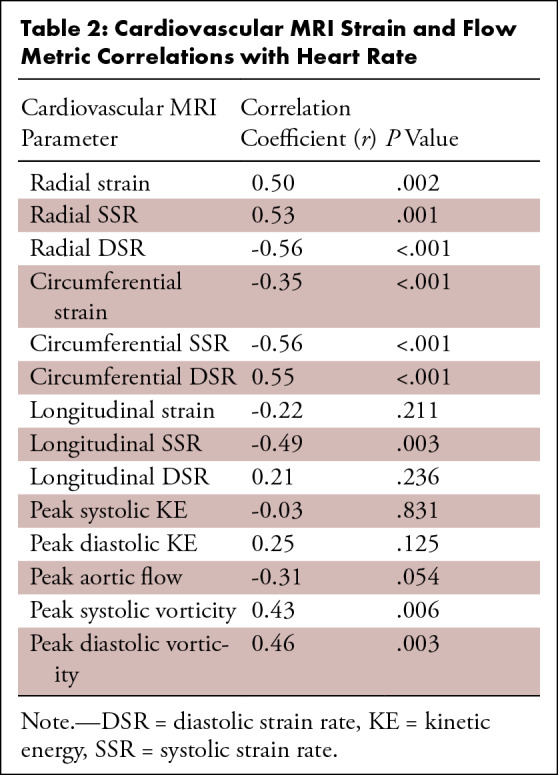
Myocardial strain metrics derived from 2D cine images were also recorded and compared between men and women. Figure 6 displays the LV radial, circumferential, and long-axis strain values of men and women, as well as the LV strain rates. Radial global (men: 24.18 ± 10.08; women: 32.81 ± 13.98; P = .044), radial apex (men: 17.19 ± 10.17; women: 26.75 ± 15.85; P = .043), circumferential global (men: 15.50 ± 3.01; women: 20.20 ± 3.25; P < .001), circumferential base (men: 15.96 ± 2.65; women: 18.74 ± 1.63; P < .001), circumferential mid (men: 14.81 ± 3.41; women: 19.32 ± 2.52; P < .001), circumferential apex (men: 15.72 ± 4.42; women: 22.55 ± 6.56; P = .001), and long-axis (men: 13.50 ± 1.75; women: 16.88 ± 1.58; P < .001) LV strain were significantly higher in women than in men. Additionally, radial systolic (male: 97.04 1/sec ± 40.37; female: 141.90 1/sec ± 60.43; P = .015), circumferential systolic (male: 73.12 1/sec ± 13.96; female: 95.06 1/sec ± 15.72; P = .001), circumferential diastolic (male: 61.16 1/sec ± 16.87; female: 90.95 1/sec ± 20.83; P < .001), long-axis systolic (male: 53.96 1/sec ± 10.39; female: 60.77 1/sec ± 5.78; P = .021), and long-axis diastolic (male: 33.08 1/sec ± 6.89; female: 40.63 1/sec ± 8.52; P = .008) LV strain rates were significantly higher in women than in men. Furthermore, circumferential systolic and diastolic strain rates displayed moderate correlation to peak systolic (r = −0.38; P = .022) and diastolic vorticity (r = 0.40; P = .015) values, respectively (Fig 7). There were also many moderately strong correlations observed when comparing both strain and flow parameters with LV mass and heart rate, as shown in Tables 1 and 2. In particular, peak aortic flow and many strain rates were significantly correlated to both LV mass and heart rate.
Figure 6:
Cardiac strain was calculated in the radial, circumferential, and long-axis orientation in the left ventricle (LV) of 20 healthy men and 19 healthy women. Additionally, systolic and diastolic strain rates were recorded. *Significant sex-based differences were observed, as noted. Circum = circumferential.
Figure 7:
Left ventricle (LV) strain rates obtained from two-dimensional cine images were compared with LV blood flow kinetic energy derived from four-dimensional flow MRI data. A moderate relationship was observed in both systolic and diastolic phases of the cardiac cycle. Note that increased strain is correlated with increased vorticity in both systole (negative strain) and diastole (positive strain). The sign (positive vs negative) of the strain metrics in systole and diastole is opposite to maintain consistency of wall motion with the designated coordinate direction (wall moving inward in systole and outward in diastole).
Table 1:
Cardiovascular MRI Strain and Flow Metric Correlations with Left Ventricular Mass
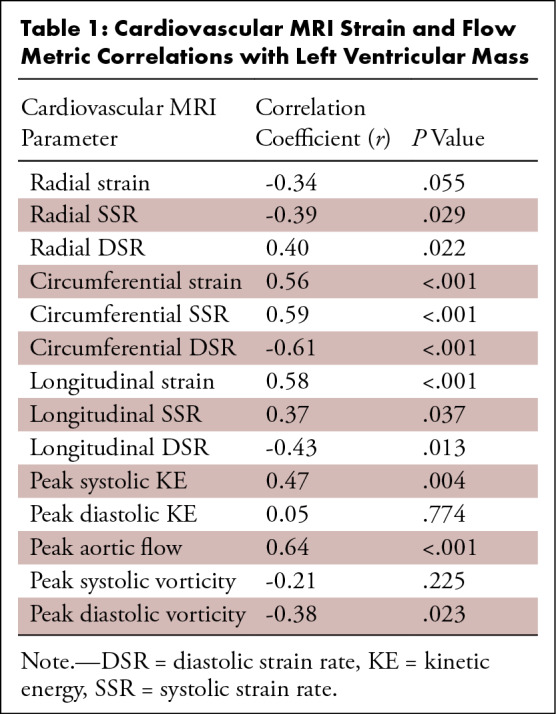
Table 2:
Cardiovascular MRI Strain and Flow Metric Correlations with Heart Rate
Volumetric Data
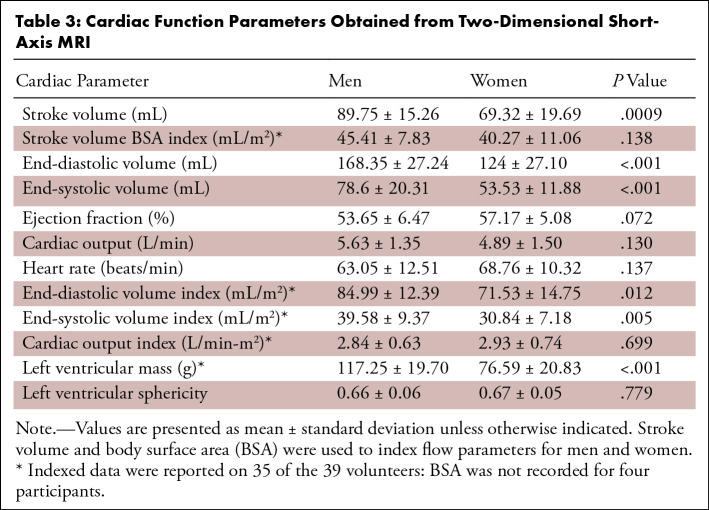
Cardiac function data from the 2D short-axis cine images are recorded as male and female group averages in Table 3. Stroke volume (P < .001), end-systolic volume (P < .001), end-diastolic volume (P < .001), end-systolic volume index (P = .005), and end-diastolic volume index (P = .012) were all significantly higher in men than they were in women. Stroke volume index was used to normalize ventricular blood flow KE, flow, and vorticity, as shown in Figures 2–4.
Table 3:
Cardiac Function Parameters Obtained from Two-Dimensional Short-Axis MRI
Discussion
The physiologic differences in cardiac function between men and women are not fully understood. Although the development and application of many cardiac metrics on myocyte function and metabolism have shed light on sex differences in cardiac function (1,4), a full connection between such metrics and cardiac flow has not been made. In an effort to further understand the connection between cardiac function and flow, as it relates to cardiac sex differences, this study used both traditional cardiac MRI and 4D flow MRI on 20 healthy men and 19 healthy women. We hypothesized that the young adult female heart would demonstrate increased indicators of myocardial function (increased myocardial strain, decreased energy use, and more efficient flow patterns) as compared with the male heart. The major findings of this study were that women demonstrate increased systolic and diastolic 4D flow MRI–derived vorticity and lower blood flow KE dissipation as compared with men. Additionally, the female heart showed increases in myocardial global strain and strain rates (systolic and diastolic), which may be related to the increased LV vorticity observed with 4D flow MRI in women. Finally, some of these sex-dependent functional differences may be in part owing to intrinsic differences in LV anatomy (ie, LV mass) and the resting heart rate.
While there have been numerous studies that have probed sex differences in cardiac function, most of these studies have been either cross-sectional aging studies or based on aged adults (30–35). Fewer studies have been strictly designed to determine sex differences in a young adult population, a time in life when women display a much lower incidence of cardiovascular disease (36,37). In this study, we found that young women had smaller normalized LV volumes but increased systolic and diastolic function indicators (circumferential strain and blood flow vorticity) as measured by myocardial feature tracking strain and 4D flow MRI. These findings are consistent with a study by Petersen et al, who used cardiac MRI in a large population and demonstrated smaller indexed LV volumes in older adult women compared with age-matched men (33). Previous work has also demonstrated that the female heart, before menopause, has augmented diastolic function (myocardial strain) compared with the age-matched male heart (34,35), which corresponds to the results of this study that found increased diastolic strain rates and peak diastolic vorticity.
Sex-dependent differences in systolic function in young adults have been equivocal when using standard clinical measurements (ie, ejection fraction) (34,35,38). While we found that ejection fraction was slightly higher in women using cardiac MRI, this was not significant. However, myocardial strain has been used previously to discriminate systolic functional differences (5). This supports our findings of increased global myocardial strain and systolic strain rates in young adult women as compared with men. Additionally, we found that peak systolic vorticity is greater in the female LV as compared with the male LV, which is a potential measure that can help delineate sex-dependent systolic function. Taken together, our results agree well with many of the previous findings of sex-dependent differences in cardiovascular function. However, the major contribution of this work is that it is the first to use 4D flow MRI and cardiac strain analysis to determine sex differences in myocardial function in a young healthy adult population.
4D flow MRI results revealed significantly higher peak systolic blood flow KE in the LV of men than in the LV of women. Considering published studies are showing higher blood flow KE dissipation in the cardiac chambers of diseased patients than in more efficient healthy controls (11,14,18,20), this may suggest that the LV of men is less efficient than the LV of women. This may be further supported by the results of our efficiency index analysis, which showed that the ratio of flow to LV KE dissipation was generally higher in women than in men, although not statistically significant. It is, however, important to note that when KE was normalized to the indexed stroke volume, the difference in peak systole was no longer significant.
In an effort to uncover more cardiac flow differences between sexes, metrics of ventricular blood flow vorticity were analyzed. Past studies have suggested that vortex core formation in the ventricular blood volume can be indicative of a more efficient, functioning heart (9,13,39–41). The presence of physiologic vortex formation has been postulated to produce direct flow routes, which avoids excessive turbulence and energy dissipation, and may be a reflection of the heart’s ability to adapt to varying conditions. However, in its absence, flow may develop a disordered motion, with an improper redirection of the blood during contraction, which may result in pathologic peak pressure development (42). Previous work has determined that diastolic vorticity is a sensitive marker of diastolic function (39,40,43,44). To our knowledge, what has been previously unexplored is systolic vorticity, and how it may be a mechanism of ventricular blood ejection. In this study, women exhibited augmented peak systolic vorticity, indexed to stroke volume, as compared with men. Subclinical systolic dysfunction is difficult to determine on the basis of measuring ejection fraction alone, while measures of myocardial deformation and 4D flow–based metrics (ie, vorticity) may provide a more sensitive modality for determining differences in systolic function that could be a marker for future outcomes in an otherwise healthy population. Taken together, increased myocardial function in young women compared with men may be a function of lower energy dissipation of the blood in the LV during filling and ejection owing to the greater vortical flow of the blood in the female heart. These metrics may shed light on sex-dependent changes in myocardial function with age, which may provide a clinical measure of the risk of cardiovascular disease.
Notably, data from the strain analysis of this study may support our hypothesis on increased functional efficiency of the female heart even further. Results displayed that circumferential and long-axis strain, as well as systolic and diastolic strain rates, were higher in the LV of women than in the LV of men. Therefore, the higher strain, particularly in the circumferential direction, may have contributed to the higher vorticity observed in the LV of women. In turn, the higher vorticity may have led to more efficient flow and less energy dissipation in the female ventricle than in the male ventricle. We postulated that strain in the circumferential direction is related to twisting (systole) and untwisting (diastole) of the ventricle, and the enhanced circumferential systolic and diastolic strain rate observed in the female myocardium may permit the development of greater vortical flow as compared with the male myocardium. This postulated relationship between cardiac strain and blood flow vorticity was supported by the observation of moderate correlations between circumferential strain rate and peak vorticity, in both systole and diastole, and may explain the underlying cardiac functional advantage that young women display compared with age-matched men. Furthermore, myocardial strain was observed to have an inverse correlation relationship with LV mass. This suggests that smaller hearts (ie, lower LV mass) may permit larger myocardial deformation throughout the cardiac cycle. Owing to the addition of 4D flow MRI data with such a strain analysis, this would be the first report to our knowledge to relate sex-dependent myocardial deformation to blood flow dynamics in the heart. These measures of cardiac function may provide markers of age-dependent changes in myocardial function between sexes.
There were some limitations to this study that warrant discussion. First, the subject group for this study was taken from two separate data sets. Nonetheless, both portions of the subject group had the same age and health recruitment requirements, and both studies used the same MRI protocols. Second, owing to the fact that this study focuses on sex differences in cardiac flow physiology, it must be acknowledged that hormonal differences between participants, such as menstrual cycle, were not controlled for. Previous work has shown that the menstrual cycle phase may alter cardiovascular function (45–50), although these findings are equivocal. Finally, the ventricular flow metrics presented in this study were derived from time-averaged analysis. Owing to the large amount of ventricular wall motion over the cardiac cycle, this may have introduced some quantification error. However, it is important to note that the time-averaged analysis is weighted heavily to diastolic ventricle volumes. Therefore, the ventricular volumes used for analysis in this study encompassed most of the ventricular flow regimen throughout the cardiac cycle. The portion of the cardiac cycle in which analysis would be affected the most would be during peak diastole, when the actual ventricular volume is larger than the segmented ventricular volume, and, because flow is lowest in peak diastole, many of the key flow metrics presented in this work would be expected to be unaffected. Furthermore, the alternative time-resolved analysis has been shown to produce a high amount of interobserver error owing to the lower resolution of ventricle boundaries (25). Combining these factors with the fact that a time-averaged analysis provides a much more time-efficient analysis, the time-averaged approach was taken in this work.
In conclusion, significant sex-based differences were observed in flow and cardiac strain parameters, which were associated to ventricular anatomy (LV mass). The methods and results of this study may be used to further understand the intricate relationship between cardiac function and flow, as it relates to differences between male and female cardiac physiology.
Acknowledgments
Acknowledgments
We gratefully acknowledge funding by NIH awards UL1TR000427, TL1TR000429, T32HL007936, AHA 14SDG19690010 and GE Healthcare for their assistance and support.
Study supported by the National Institutes of Health (UL1TR000427, TL1TR000429), under Ruth L. Kirschstein National Research Service Award T32HL007936 from the National Heart, Lung, and Blood Institute to the University of Wisconsin-Madison Cardiovascular Research Center and the American Heart Association (14SDG19690010).
Disclosures of Conflicts of Interest: D.R.R. Activities related to the present article: author partially funded by NIH awards UL1TR000427 and TL1TR000429, (institutional predoctoral training grant) and T32HL007936 (postdoctoral training) for a portion of the time this study took place; a subset of the volunteer data was obtained from a past study funded by AHA award 14SDG19690010 (C.J.F. and A.R.A. were PIs). Activities not related to the present article: disclosed no relevant relationships. Other relationships: disclosed no relevant relationships. G.P.B. disclosed no relevant relationships. C.J.F. Activities related to the present article: disclosed no relevant relationships. Activities not related to the present article: institution (University of Wisconsin-Madison, department of radiology) receives research support from GE Healthcare. Other relationships: disclosed no relevant relationships. N.A. disclosed no relevant relationships. A.R.A. disclosed no relevant relationships.
Abbreviations:
- 4D
- four-dimensional
- KE
- kinetic energy
- LV
- left ventricle
- RV
- right ventricle
- 2D
- two-dimensional
References
- 1.Kolar F, Ostadal B. Sex differences in cardiovascular function. Acta Physiol (Oxf) 2013;207(4):584–587. [DOI] [PubMed] [Google Scholar]
- 2.Humphries KH, Izadnegahdar M, Sedlak T, et al. Sex differences in cardiovascular disease - Impact on care and outcomes. Front Neuroendocrinol 2017;46:46–70. [DOI] [PMC free article] [PubMed] [Google Scholar]
- 3.Aggarwal NR, Patel HN, Mehta LS, et al. Sex differences in ischemic heart disease: advances, obstacles, and next steps. Circ Cardiovasc Qual Outcomes 2018;11(2):e004437. [DOI] [PubMed] [Google Scholar]
- 4.Pianosi PT, Emerling E, Mara KC, Weaver AL, Fischer PR. Sex differences in fitness and cardiac function during exercise in adolescents with chronic fatigue. Scand J Med Sci Sports 2018;28(2):524–531. [DOI] [PubMed] [Google Scholar]
- 5.Lawton JS, Cupps BP, Knutsen AK, et al. Magnetic resonance imaging detects significant sex differences in human myocardial strain. Biomed Eng Online 2011;10(1):76. [DOI] [PMC free article] [PubMed] [Google Scholar]
- 6.Andre F, Steen H, Matheis P, et al. Age- and gender-related normal left ventricular deformation assessed by cardiovascular magnetic resonance feature tracking. J Cardiovasc Magn Reson 2015;17(1):25. [DOI] [PMC free article] [PubMed] [Google Scholar]
- 7.Al-Wakeel N, Fernandes JF, Amiri A, et al. Hemodynamic and energetic aspects of the left ventricle in patients with mitral regurgitation before and after mitral valve surgery. J Magn Reson Imaging 2015;42(6):1705–1712. [DOI] [PubMed] [Google Scholar]
- 8.Arvidsson PM, Töger J, Heiberg E, Carlsson M, Arheden H. Quantification of left and right atrial kinetic energy using four-dimensional intracardiac magnetic resonance imaging flow measurements. J Appl Physiol (1985) 2013;114(10):1472–1481. [DOI] [PubMed] [Google Scholar]
- 9.Bermejo J, Benito Y, Alhama M, et al. Intraventricular vortex properties in nonischemic dilated cardiomyopathy. Am J Physiol Heart Circ Physiol 2014;306(5):H718–H729. [DOI] [PMC free article] [PubMed] [Google Scholar]
- 10.Carlsson M, Heiberg E, Toger J, Arheden H. Quantification of left and right ventricular kinetic energy using four-dimensional intracardiac magnetic resonance imaging flow measurements. Am J Physiol Heart Circ Physiol 2012;302(4):H893–H900. [DOI] [PubMed] [Google Scholar]
- 11.Han QJ, Witschey WR, Fang-Yen CM, et al. Altered right ventricular kinetic energy work density and viscous energy dissipation in patients with pulmonary arterial hypertension: a pilot study using 4D flow MRI. PLoS One 2015;10(9):e0138365. [DOI] [PMC free article] [PubMed] [Google Scholar]
- 12.Kanski M, Arvidsson PM, Töger J, et al. Left ventricular fluid kinetic energy time curves in heart failure from cardiovascular magnetic resonance 4D flow data. J Cardiovasc Magn Reson 2015;17(1):111. [DOI] [PMC free article] [PubMed] [Google Scholar]
- 13.Pierrakos O, Vlachos PP. The effect of vortex formation on left ventricular filling and mitral valve efficiency. J Biomech Eng 2006;128(4):527–539. [DOI] [PubMed] [Google Scholar]
- 14.Rutkowski DR, Barton G, François CJ, Bartlett HL, Anagnostopoulos PV, Roldán-Alzate A. Analysis of cavopulmonary and cardiac flow characteristics in fontan patients: comparison with healthy volunteers. J Magn Reson Imaging 2019;49(6):1786–1799. [DOI] [PMC free article] [PubMed] [Google Scholar]
- 15.Prec O, Katz LN. Determination of kinetic energy of the heart in man. Am J Physiol 1949;159(3):483–491. [DOI] [PubMed] [Google Scholar]
- 16.Katz AM. Physiology of the Heart. Philadelphia, Pa: Wolters Kluwer Health, 2015. [Google Scholar]
- 17.Gürel E, Prinz C, Van Casteren L, Gao H, Willems R, Voigt JU. The impact of function-flow interaction on left ventricular efficiency in patients with conduction abnormalities: a particle image velocimetry and tissue Doppler study. J Am Soc Echocardiogr 2016;29(5):431–440. [DOI] [PubMed] [Google Scholar]
- 18.Sjöberg P, Heiberg E, Wingren P, et al. Decreased diastolic ventricular kinetic energy in young patients with fontan circulation demonstrated by four-dimensional cardiac magnetic resonance imaging. Pediatr Cardiol 2017;38(4):669–680 [Published correction appears in Pediatr Cardiol 2017;38(5):1087.]. [DOI] [PMC free article] [PubMed] [Google Scholar]
- 19.Wong J, Chabiniok R, Pushparajah K, et al. Kinetic energy ejection fraction: a better marker of cardiac function in the single ventricle circulation. J Am Coll Cardiol 2015;65(10 Suppl):A1290. [Google Scholar]
- 20.Jeong D, Anagnostopoulos PV, Roldan-Alzate A, et al. Ventricular kinetic energy may provide a novel noninvasive way to assess ventricular performance in patients with repaired tetralogy of Fallot. J Thorac Cardiovasc Surg 2015;149(5):1339–1347. [DOI] [PMC free article] [PubMed] [Google Scholar]
- 21.Föll D, Taeger S, Bode C, Jung B, Markl M. Age, gender, blood pressure, and ventricular geometry influence normal 3D blood flow characteristics in the left heart. Eur Heart J Cardiovasc Imaging 2013;14(4):366–373. [DOI] [PubMed] [Google Scholar]
- 22.Gu T, Korosec FR, Block WF, et al. PC VIPR: a high-speed 3D phase-contrast method for flow quantification and high-resolution angiography. AJNR Am J Neuroradiol 2005;26(4):743–749. [PMC free article] [PubMed] [Google Scholar]
- 23.Johnson KM, Lum DP, Turski PA, Block WF, Mistretta CA, Wieben O. Improved 3D phase contrast MRI with off-resonance corrected dual echo VIPR. Magn Reson Med 2008;60(6):1329–1336. [DOI] [PMC free article] [PubMed] [Google Scholar]
- 24.Schrauben EM, Anderson AG, Johnson KM, Wieben O. Respiratory-induced venous blood flow effects using flexible retrospective double-gating. J Magn Reson Imaging 2015;42(1):211–216. [DOI] [PubMed] [Google Scholar]
- 25.Hussaini SF, Rutkowski DR, Roldán-Alzate A, François CJ. Left and right ventricular kinetic energy using time-resolved versus time-average ventricular volumes. J Magn Reson Imaging 2017;45(3):821–828. [DOI] [PubMed] [Google Scholar]
- 26.Walker PG, Cranney GB, Scheidegger MB, Waseleski G, Pohost GM, Yoganathan AP. Semiautomated method for noise reduction and background phase error correction in MR phase velocity data. J Magn Reson Imaging 1993;3(3):521–530. [DOI] [PubMed] [Google Scholar]
- 27.Heiberg E, Sjögren J, Ugander M, Carlsson M, Engblom H, Arheden H. Design and validation of Segment--freely available software for cardiovascular image analysis. BMC Med Imaging 2010;10(1):1. [DOI] [PMC free article] [PubMed] [Google Scholar]
- 28.Heyde B, Jasaityte R, Barbosa D, et al. Elastic image registration versus speckle tracking for 2-D myocardial motion estimation: a direct comparison in vivo. IEEE Trans Med Imaging 2013;32(2):449–459. [DOI] [PubMed] [Google Scholar]
- 29.Morais P, Marchi A, Bogaert JA, et al. Cardiovascular magnetic resonance myocardial feature tracking using a non-rigid, elastic image registration algorithm: assessment of variability in a real-life clinical setting. J Cardiovasc Magn Reson 2017;19(1):24. [DOI] [PMC free article] [PubMed] [Google Scholar]
- 30.Rosen BD, Cushman M, Nasir K, et al. Relationship between C-reactive protein levels and regional left ventricular function in asymptomatic individuals: the multi-ethnic study of atherosclerosis. J Am Coll Cardiol 2007;49(5):594–600. [DOI] [PubMed] [Google Scholar]
- 31.Fernandes VR, Edvardsen T, Rosen BD, et al. The influence of left ventricular size and global function on regional myocardial contraction and relaxation in an adult population free of cardiovascular disease: a tagged CMR study of the MESA cohort. J Cardiovasc Magn Reson 2007;9(6):921–930. [DOI] [PubMed] [Google Scholar]
- 32.Merz CN, Moriel M, Rozanski A, Klein J, Berman DS. Gender-related differences in exercise ventricular function among healthy subjects and patients. Am Heart J 1996;131(4):704–709. [DOI] [PubMed] [Google Scholar]
- 33.Petersen SE, Aung N, Sanghvi MM, et al. Reference ranges for cardiac structure and function using cardiovascular magnetic resonance (CMR) in Caucasians from the UK Biobank population cohort. J Cardiovasc Magn Reson 2017;19(1):18. [DOI] [PMC free article] [PubMed] [Google Scholar]
- 34.Daimon M, Watanabe H, Abe Y, et al. Gender differences in age-related changes in left and right ventricular geometries and functions. Echocardiography of a healthy subject group. Circ J 2011;75(12):2840–2846. [DOI] [PubMed] [Google Scholar]
- 35.Okura H, Takada Y, Yamabe A, et al. Age- and gender-specific changes in the left ventricular relaxation: a Doppler echocardiographic study in healthy individuals. Circ Cardiovasc Imaging 2009;2(1):41–46. [DOI] [PubMed] [Google Scholar]
- 36.Colditz GA, Willett WC, Stampfer MJ, Rosner B, Speizer FE, Hennekens CH. Menopause and the risk of coronary heart disease in women. N Engl J Med 1987;316(18):1105–1110. [DOI] [PubMed] [Google Scholar]
- 37.Lloyd-Jones DM, Larson MG, Beiser A, Levy D. Lifetime risk of developing coronary heart disease. Lancet 1999;353(9147):89–92. [DOI] [PubMed] [Google Scholar]
- 38.Natori S, Lai S, Finn JP, et al. Cardiovascular function in multi-ethnic study of atherosclerosis: normal values by age, sex, and ethnicity. AJR Am J Roentgenol 2006;186(6 Suppl 2):S357–S365. [DOI] [PubMed] [Google Scholar]
- 39.Elbaz MS, van der Geest RJ, Calkoen EE, et al. Assessment of viscous energy loss and the association with three-dimensional vortex ring formation in left ventricular inflow: in vivo evaluation using four-dimensional flow MRI. Magn Reson Med 2017;77(2):794–805. [DOI] [PMC free article] [PubMed] [Google Scholar]
- 40.Fenster BE, Browning J, Schroeder JD, et al. Vorticity is a marker of right ventricular diastolic dysfunction. Am J Physiol Heart Circ Physiol 2015;309(6):H1087–H1093. [DOI] [PubMed] [Google Scholar]
- 41.Hong GR, Pedrizzetti G, Tonti G, et al. Characterization and quantification of vortex flow in the human left ventricle by contrast echocardiography using vector particle image velocimetry. JACC Cardiovasc Imaging 2008;1(6):705–717. [DOI] [PMC free article] [PubMed] [Google Scholar]
- 42.Sengupta PP, Pedrizzetti G, Kilner PJ, et al. Emerging trends in CV flow visualization. JACC Cardiovasc Imaging 2012;5(3):305–316. [DOI] [PubMed] [Google Scholar]
- 43.Schäfer M, Browning J, Schroeder JD, et al. Vorticity is a marker of diastolic ventricular interdependency in pulmonary hypertension. Pulm Circ 2016;6(1):46–54. [DOI] [PMC free article] [PubMed] [Google Scholar]
- 44.Schäfer M, Humphries S, Stenmark KR, et al. 4D-flow cardiac magnetic resonance-derived vorticity is sensitive marker of left ventricular diastolic dysfunction in patients with mild-to-moderate chronic obstructive pulmonary disease. Eur Heart J Cardiovasc Imaging 2018;19(4):415–424. [DOI] [PMC free article] [PubMed] [Google Scholar]
- 45.Shenouda N, Priest SE, Rizzuto VI, MacDonald MJ. Brachial artery endothelial function is stable across a menstrual and oral contraceptive pill cycle but lower in premenopausal women than in age-matched men. Am J Physiol Heart Circ Physiol 2018;315(2):H366–H374. [DOI] [PubMed] [Google Scholar]
- 46.Priest SE, Shenouda N, MacDonald MJ. Effect of sex, menstrual cycle phase, and monophasic oral contraceptive pill use on local and central arterial stiffness in young adults. Am J Physiol Heart Circ Physiol 2018;315(2):H357–H365. [DOI] [PMC free article] [PubMed] [Google Scholar]
- 47.Adkisson EJ, Casey DP, Beck DT, Gurovich AN, Martin JS, Braith RW. Central, peripheral and resistance arterial reactivity: fluctuates during the phases of the menstrual cycle. Exp Biol Med (Maywood) 2010;235(1):111–118. [DOI] [PMC free article] [PubMed] [Google Scholar]
- 48.D’Urzo KA, King TJ, Williams JS, Silvester MD, Pyke KE. The impact of menstrual phase on brachial artery flow-mediated dilatation during handgrip exercise in healthy premenopausal women. Exp Physiol 2018;103(2):291–302. [DOI] [PubMed] [Google Scholar]
- 49.Yazar Ş, Yazıcı M. Impact of menstrual cycle on cardiac autonomic function assessed by heart rate variability and heart rate recovery. Med Princ Pract 2016;25(4):374–377. [DOI] [PMC free article] [PubMed] [Google Scholar]
- 50.Abidi S, Nili M, Serna S, Kim S, Hazlett C, Edgell H. Influence of sex, menstrual cycle, and oral contraceptives on cerebrovascular resistance and cardiorespiratory function during Valsalva or standing. J Appl Physiol (1985) 2017;123(2):375–386. [DOI] [PMC free article] [PubMed] [Google Scholar]


