Figure 1.
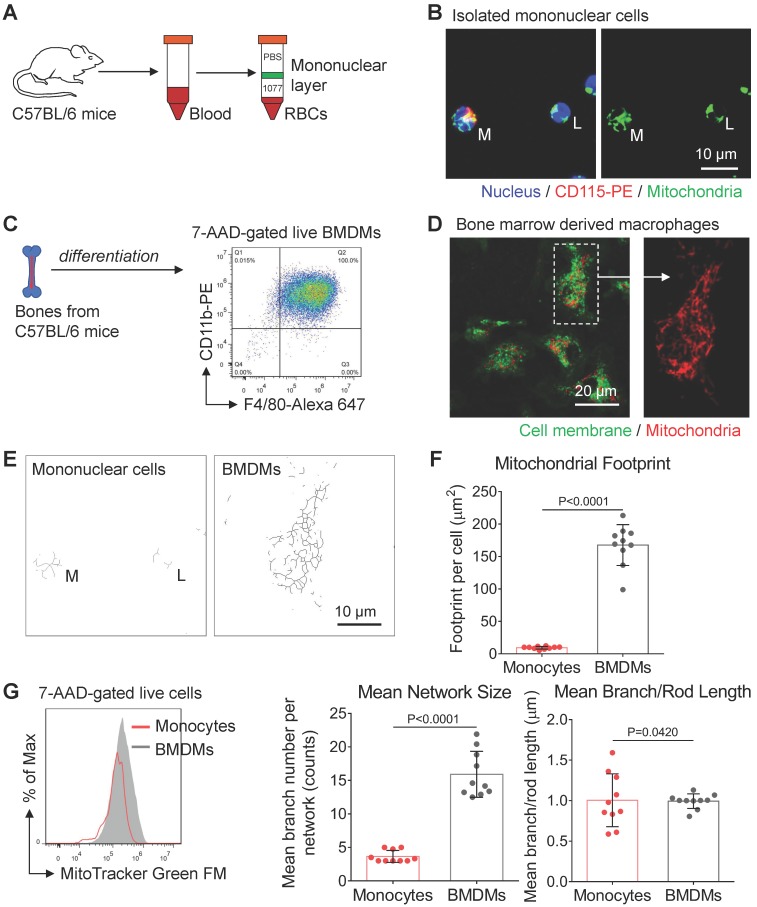
Mitochondrial morphology varies from peripheral blood monocytes to bone marrow-derived macrophages (BMDMs). (A) Schematic diagram showing the isolation of mononuclear leukocytes from the peripheral blood of mice using Histopaque (1.077 g/mL) banding method. (B) Fluorescence confocal images of mitochondria (green color, MitoTracker Green FM), nuclei (blue color, Hoechst 33342), and surface marker (red color, CD115-PE) in monocytes (M) and lymphocytes (L). Scale bar, 10 µm. (C) Schematic diagram showing the preparation of naive bone marrow-derived macrophages (BMDMs) using macrophage colony-stimulating factor (M-CSF) stimulation. The macrophage lineage was validated by the F4/80-Alexa 647 vs CD11b-PE scatter plot. (D) Fluorescence confocal images of mitochondria (red color, MitoTracker Red CMXRos) and cellular membrane (green color, PKH67 Green) in BMDMs. Scale bar, 20 µm. (E) Mitochondrial network morphology of mononuclear cells (corresponds to Figure 1B) and BMDMs (corresponds to Figure 1D) produced by ImageJ macro tools. Scale bar, 10 µm. (F) Mitochondrial organization analysis of monocytes and BMDMs. Mitochondrial footprint reflects mitochondrial mass in a cell, mean network size is the mean number of branches per network, while mean branch/rod length is the average size of all rods/branches. Dots are data from individual cells (n=10). (G) Flow cytometer data of MitoTracker Green FM fluorescence in monocytes (red line) and BMDMs (gray area). All data shown were representative of two or three independent runs of experiments.

