

Abstract
Binary titanium–niobium (Ti–Nb) alloys have recently been attracted due to low Young’s moduli and non-toxic properties. This study explores the influence of low Nb content (0–25 wt%) on the comprehensive parameters of tensile stress–strain relationships (ultimate strength (σUTS), yield strength (σ0.2) and elastic modulus (E)), surfaces properties (Vickers microhardness, surface roughness (Ra), water contact angle (WCA), X-ray diffraction (XRD) and scanning electron microscopy (SEM)), corrosion resistance (in artificial saliva and lactic acid) and biological properties (cytotoxicity and alkaline phosphatase activity of MC3T3-E1 pre-osteoblasts) of Ti–xNb alloys (x = 5, 10, 15, 20 and 25 wt%), with using commercially pure grade 2 titanium (cp-Ti) as control. XRD results shown that all the Ti–xNb alloys comprised α + β Ti alloy phases, such that the β phase increased correspondingly with the increased amount of Nb in the alloy, as well as the reduction of E (69–87 GPa). Except Ti–5Nb, all other Ti–xNb alloys showed a significantly higher hardness, increased σUTS and σ0.2, and decreased WCA compared with cp-Ti. No corrosion was detected on Ti–xNb alloys and cp-Ti in artificial saliva and lactic acid solutions. The cytotoxicity of Ti–xNb alloys was comparable to that of cp-Ti in MC3T3-E1 pre-osteoblasts without interference from differentiation behaviour, but the proliferation rate of the Ti–5Nb alloy was lower than other groups. In overall, binary Ti–(10–25 wt%)Nb alloys are promising candidate for orthopaedic and dental implants due to their improved mechanical properties and comparable biological performance, while Ti–5Nb should be used with caution.
Keywords: biomaterial, titanium–niobium, binary titanium alloys, low Young’s modulus, biocompatibility
Introduction
Titanium (Ti) is an attractive biomaterial because of its osseointegration ability, relatively low elastic modulus and high corrosion stability. As such, Ti has received great attention in the orthopaedic and dental fields [1, 2]. However, pure Ti has insufficient wear resistance and low load-bearing strength. Thus, this hampered the use of pure titanium in long-term applications such as implant. Consequently, titanium alloys, that were commented to be more mechanically advantageous [3, 4], would be more favourable in such an application.
Generally, Ti is a multiphase crystalline metal that is a hexagonal close-packed (α phase) structure at room temperature and can be transformed to a body-centred cubic (β phase) structure above 882°C [5, 6]. According to the lattice at room temperature, Ti alloys can be categorized as an α, a β or an α + β type. Alloying elements for Ti can be roughly divided into three categories according to their capacity to adjust the phase transformation temperatures: an α stabilizer (e.g. Al, O and N), a β stabilizer (Nb, Mo, V and Ta) and a neutral strengthening element (Zr). The properties of Ti alloys are largely dependent on the metallic composition and interior ratio of the α/β phase [7]. Ti–6Al–4V, the most widely used Ti alloys, has long been criticized for high elastic modulus and potential neurological cytotoxicity due to the dissolution of vanadium and aluminium particles [8]. Therefore, not only mechanical characteristics but also biological aspects should be considered simultaneously in the development and application of Ti alloys.
Recently, Ti–Nb alloys, which do not contain toxic elements and possess a low Young’s modulus (E) due to the addition of Nb as a β-stabilizer, have attracted attention. The in vitro and in vivo biological evaluation of pure metals of potential alloying elements, including Nb, Ta and Zr, indicated that they are less cytotoxic than Ti alloys or even non-toxic [9, 10]. Eisenbarth et al. examined the biocompatibility of pure metals of β-stabilizing elements in vitro, and the rank in descending order was as follows: niobium–tantalum, titanium, zirconium–aluminium [1]. Among Ti alloys, β alloys exhibit the lowest elastic modulus and wear resistance as well as a high hardenability [11]. Nb is a β-phase stabilizer that increases ratio of the β/α phase and maintains advantageous mechanical characteristics [12, 13]. The β phase in Ti–Nb alloys becomes stabilized when the ratio of valence electrons and atom numbers (e/a) is >4.2 [14]. Therefore, at least 35–40 wt% of Nb content should be included to achieve a complete and stable β phase in Ti–Nb alloys. However, since Nb is a rare metal with a high melting point, less Nb would be favoured in terms of manufacturing and cost-effectiveness considerations [15].
Some researchers also noted that martensitic Ti–Nb alloys, which have a relatively low Nb content, could have a similar elastic modulus to a Ti–Nb alloy comprising a complete β phase [16–18]. In addition, various studies have focussed on the mechanical properties of Ti–Nb binary alloys and have illustrated promising results, such as Ti–(0.1–5 wt%)Nb [19–22], Ti–(5–10 wt%)Nb [20, 21, 23, 24], Ti–(10–15 wt%)Nb [25, 26], Ti–(15–20 wt%)Nb [27, 28] and Ti–(20–25 wt%)Nb [24, 29]. Nonetheless, the biological effect of Nb content was not investigated in detail. Therefore, this study aimed to explore the influence of Nb content (0–25 wt%) on the mechanical and biological properties of Ti–Nb alloys.
Materials and methods
Sample preparation
The Ti–xNb alloys (x = 5, 10, 15, 20 and 25 wt%) were the study group, and commercially pure grade 2 titanium (cp-Ti) was the control group. All specimens were provided by the Northwest Institute for Non-ferrous Metal Research (Shenyang, China). Briefly, for Ti–xNb alloys, sponge titanium (99.9%) and Nb powder (99.9%) were placed in a vacuum consumable-electrode arc furnace and re-melted thrice for interior homogeneity, and then a series of forging-cogging, rolling, straightening and scaling were done. The final products were metal bars (Φ = 15 mm) that were cut into 2.0 ± 0.5 mm thick coin-like disks to suit the needs of this study. For wettability and cell behaviour studies, one side of the disks was polished sequentially with 80, 320, 600, 1000 and 2000 grit SiC papers and cleaned for 60 min with acetone, ethanol and distilled water in turn.
Microstructural characterization
The crystallinity and phases in the Ti–xNb were identified by X-ray diffraction (XRD) (Bruker Advance, USA) with CuKα radiation (40 kV, 30 mA, 10°/min) at room temperature. Phases were determined by matching the spectra to the files from the Joint Committee on Power Diffraction Standards.
Tensile and micro-hardness tests
The tensile properties, including ultimate strength (σUTS), yield strength (σ0.2)and elongation (E), were measured on an Instron 589X testing system at a crosshead speed of 15 mm/min [30]. The elastic modulus was calculated from the slope of the stress–strain curve in the elastic deformation region, and the yield strength was determined by the 0.2% offset yield method. The Vickers hardness test was performed by using an HVS-1000 digital display microhardness tester with 300 gf loading for 15 s.
Roughness measurement
The roughness (Ra) was quantified by a Surtronic 3+ (Taylor Hobson, UK). The profilometer was set to measure at every 0.8 mm cut-off value. The average of three readings of each material group was measured and recorded in triplicate on difference area.
Corrosion behaviour test in artificial saliva and lactic acid
An immersion test that determines the release of metal elements was conducted with artificial saliva and an acid corrosive solution in accordance to ISO 10271:2011. The chemical composition of artificial saliva [31] was composed of urea (1.50 g/dm3), NaHCO3 (1.50 g/dm3), KCl (1.20 g/dm3), NaCl (0.70 g/dm3), KSCN (0.33 g/dm3), Na2HPO4 (0.26 g/dm3), K2HPO4 (0.20 g/dm3) and drops of lactic acid until the pH reached 6.72 (PHM 250, Radiometer, Denmark) to mimic the oral electrolyte [32]. The specimen was immersed in the artificial saliva with a ratio of 1 ml of solution per 1 cm2 of sample surface area. The solution without any metal was prepared as a blank. Finally, 4.0 ml of metallic and blank solutions were collected at 1, 7 and 28 days to determine the concentration of metallic elements released with inductively coupled plasma-optical emission spectroscopy (Spectro-Arcos) equipped with an auto-sampler. The analytical detection limit was 0.06 ppm (μg/ml), below which the concentration of the dissolved element would be considered as undetectable.
The corrosive solution included 0.1 mol/l lactic acid and 0.1 mol/l sodium chloride, and the pH was 2.21. Each alloy specimen was treated by immersing them in the corrosive solution for 7 days at 37°C, while the untreated samples were kept in the same conditions in distilled water . The corrosion resistance was determined by comparing the surface topography of the treated group and untreated group using scanning electron microscopy (SEM) (SU1510, HITACHI, Japan) together with energy dispersive spectrometry (IXRF Systems, USA) for surface chemical composition analysis.
Water contact angle
Water contact angle (WCA) was tested by sessile drop analysis, and an auto-pipet was employed to make the same volume (10 μl) of distilled water on the suface. The drop image was stored within 1 s and analysed by a goniometer approach [33]. Then, WCA were measured in triplicate for each group (three samples per group).
Biological evaluation
Cell culture
Mouse calvaria-derived MC3T3-E1 subclone 14 pre-osteoblast cells from Shanghai Institute of Biochemistry and Cell Biology (Shanghai, China) were routinely maintained in an α-MEM medium (HyClone, USA) supplemented with 10% foetal bovine serum (HyClone), 100 units/ml penicillin and 100 μg/ml streptomycin at 37°C in a 5% CO2 humidified atmosphere. Cells from 5 to 10 passages were used in the subsequent experiments, and cell culture medium was regularly refreshed at intervals of 2 days. For the study of pre-osteoblast differentiation, differentiation-inducing medium containing 50 μg/ml ascorbic acid and 10 mM β-glycerophosphate was added when cells reached confluence.
The Ti–xNb alloy and cp-Ti disks were sterilized in an autoclave (121°C, 20 min) and dried overnight. MC3T3-E1 cells were seeded on the surface of the disks, which was placed on the plates and pre-wetted using phosphate-buffered saline (PBS) in the clean bench prior to cell research.
Cytotoxicity evaluation of MC3T3-E1 pre-osteoblasts
A cell viability test was conducted to measure the cytotoxicity between the studied metallic material and MC3T3-E1 pre-osteoblasts by a lactate dehydrogenase (LDH) assay and proliferation assay in vitro.
For evaluation of LDH activity, MC3T3-E1 cells were seeded on the surface of tested samples with a density of 1 × 10⁵/ml and incubated for 24 h at 37°C in a humidified atmosphere with 5% CO2. The LDH activity was determined spectrophotometrically at 490 nm according to the manufacturer’s protocol with a cytotoxicity LDH assay kit (Dojindo, Kumamoto, Japan). For metabolic activity, pre-osteoblast MC3T3-E1 was measured with resazurin-based reagent (Prestoblue® Cell Viability Reagent, Life Technologies) at 24, 96 and 168 h after exposure to the material. Briefly, the cells were seeded onto specimens at a density of 2 × 10⁴/ml and incubated at 37°C in a 5% CO2 atmosphere. At the prescribed time, the cell culture medium was removed, replaced by a freshly prepared cell culture medium containing 10% cell viability reagent and incubated for 2 h away from direct light. The non-fluorescent resazurin was converted to highly fluorescent resorufin by live cells, which could be monitored by a colorimeter at 570 nm with 600 nm as the reference wavelength.
The performance of the Ti–xNb alloys (x = 5, 10, 15, 20 and 25 wt%) in the LDH and proliferation assays was compared with that of the control group as a ratio (%) vs. cp-Ti (100%) to assess the difference at different times.
Alkaline phosphatase activity
The alkaline phosphatase (ALP) activity of pre-osteoblast MC3T3-E1 was determined at 7, 14 and 21 days with p-nitrophenyl phosphate (pNPP) after the addition of 50 μg/ml ascorbic acid and 10 mM β-glycerophosphate to the culture medium to induce differentiation. Briefly, at each time point, cells that were seeded on the Ti–xNb alloys and cp-Ti were washed with PBS and incubated with trypsin/ethylenediaminetetraacetic acid for 3 min to obtain a single-cell suspension. Then, the cells were centrifuged at 1000 rpm for 10 min, and the cell pellets were collected in 1.5 ml PBS. The ALP activity was measured using the cell lysates after ultrasonic decomposition of cell pellets in accordance with the protocol provided by the manufacturer. The ALP activity was normalized by the total cellular protein content and calculated as follows:
*: the unit of ALP activity was King–Armstrong unit, which was defined as originally the amount of phosphatase that acting upon disodium phenylphosphate liberates 1 mg of phenol in 37°C in 15 min; 1 King–Armstrong unit equals 7.14 U/l.
**: total protein concentration was measured by bicinchoninic acid protein assay kit (Beyotime, China).
Data analysis
All data were analysed by using the SPSS 19.0 software package (IBM Corporation, USA). The average values of the experiments in triplicate were expressed as the mean ±standard deviation. Multiple comparisons were conducted by one-way analysis of variance and Tukey’s post hoc test with a significance level of 0.05.
Results
Phases and composition
Figure 1 shows the XRD spectra of Ti–xNb alloys (x = 5, 10, 15, 20 and 25 wt%). The hexagonal α phase is marked with bullets, while the cubic β phase is marked with club symbols. All Ti–xNb (x = 5, 10, 15, 20 and 25 wt%) alloys comprised α + β Ti alloy phases, and the increase of Nb content would increase the amount of β phase. There was a very minor amount of β phase in Ti–5Nb, and Ti–10Nb exhibited a minor but detectable amount of β phase, while β phase was dominant in the Ti–25Nb, which had very little α phase.
Figure 1.
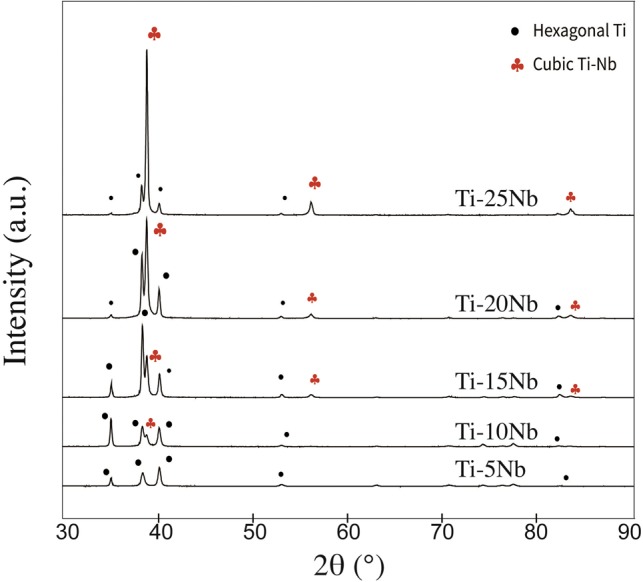
XRD spectra of Ti–xNb alloys (x = 5, 10, 15, 20 and 25 wt%) and cp-Ti. The hexagonal α phase and cubic β phase are marked as bullets and club symbols, respectively
Mechanical properties tests
The result of roughness measurement was shown in Table 1. The roughness of cp-Ti was significantly lower than Ti–xNb (x = 5, 10, 15, 20, 25 wt%) (P < 0.05). Among Ti–xNb alloys, similar roughness was observed in Ti–5Nb, Ti–10Nb and Ti–15Nb and roughness of these groups was higher than Ti–20Nb and Ti–25Nb (P < 0.05). In terms of the Vickers hardness (HV5), only the hardness of the Ti–5Nb group (176.6) was lower than that of the control group (188.5), while Ti–25Nb showed the highest hardness (329.6), followed by Ti–20Nb (304.9), Ti–15Nb (249.9) and Ti–10Nb (199.82).
Table 1.
Roughness (Ra) of cp-Ti and Ti–xNb (x = 5, 10, 15, 20 and 25 wt%)
| Group | R a (μm) |
|---|---|
| Ti–5Nb | 0.34±0.02 |
| Ti–10Nb | 0.37±0.04 |
| Ti–15Nb | 0.34±0.02 |
| Ti–20Nb | 0.26±0.01 |
| Ti–25Nb | 0.27±0.01 |
| Ti | 0.25±0.01 |
Figure 2 shows the stress–strain curves of Ti–xNb alloys as well as an overview of the corresponding mechanical characteristics. In the range studied for the Ti–xNb alloys, the yield strength (σ0.2) increased from 389.5 to 872.5 MPa as a result of the increasing Nb content; the value for cp-Ti was 389.5 MPa. In the meantime, the ability to withstand elongation due to a load, namely, the ultimate tensile strength (σUTS), also increased stepwise from 520.0 to 1014 MPa.
Figure 2.
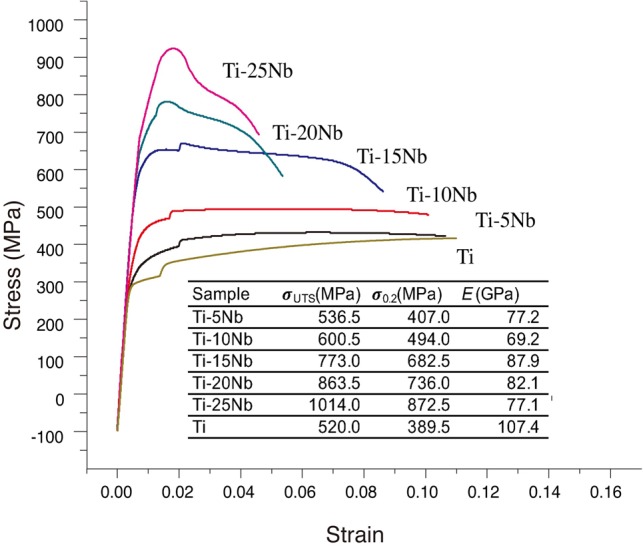
Stress–strain curves and the mechanical properties (ultimate tensile strength (σUTS), yield strength (σ0.2) and elastic modulus (E)) of Ti–Nb alloys and cp-Ti
E was calculated as the ratio of tensile stress to tensile strain, and there was a fluctuating trend. By adding Nb, E decreased, and the values of E for the Ti–xNb alloys (x = 5, 10, 15, 20 and 25 wt%) were in the range of 69–88 GPa, which are significantly lower than that of cp-Ti. In this study, the elastic modulus first dropped to 69.2 GPa for the Ti–10Nb alloy and then increased to 87.9 GPa for the Ti–15Nb alloy before decreasing to 77.1 GPa for the Ti–25Nb alloy.
Water contact angle (WCA)
The wetting performance was measured by evaluating the liquid–solid contact angle (CA) (Fig. 3). Compared with the cp-Ti group (52.87 ± 4.34°), the Ti–5Nb group showed a significantly lower hydrophilicity (66.67 ± 3.62°), while no statistically significant difference was observed in the other groups, which indicated a similar surface wettability to the control group. Interestingly, with an increasing mass content of Nb in Ti-Nb alloys, the average WCA showed a downward trend and the hydrophilicity was enhanced (P > 0.05).
Figure 3.

Sessile water drop measurement of (a) Ti–5Nb; (b) Ti–10Nb; (c) Ti–15Nb; (d) Ti–20Nb; (e) Ti–25Nb; (f) cp-Ti
Corrosion resistance
The SEM topography of the Ti–xNb and cp-Ti treated or untreated with lactic acid is presented in Fig. 4, and Table 2 shows the semi-quantitative chemical composition analysis by EDX None Ti and Nb elements were detected, i.e. below the detection limit (0.06 ppm), in the ICP-OES analysis on immersed solution collected at 1, 7 and 28 days. In the untreated groups, the chemical composition of Ti–xNb (x = 5, 10, 15, 20 and 25 wt%) was roughly equivalent to that of the required mass content, with an ∼5% gradient difference between the two sequential groups. There was no difference observed in the Ti–xNb alloys and cp-Ti for the Nb, Ti, O elements when comparing the lactic acid solution treatment.
Figure 4.

SEM topography of Ti-alloys and cp-Ti before (a–c, g–i) and after (d–f, j–l) treatment in the acid corrosive solution
Table 2.
EDX analysis of the chemical composition of Ti–Nb alloys and cp-Ti before and after treatments with lactic acid and the subsequent corrosion
| Group | Before lactic acid treatment |
After lactic acid treatment |
||||||||||
|---|---|---|---|---|---|---|---|---|---|---|---|---|
| C | O | Na | Cl | Ti | Nb | C | O | Na | Cl | Ti | Nb | |
| Ti–5Nb | 0.36±0.01 | 4.78±0.18 | 1±0.11 | 1.11±0.01 | 85.87±0.41 | 6.88±0.21 | 0.39±0.02 | 4.6±0.1 | 1±0.03 | 1.17±0.06 | 85.99±0.12 | 6.84±0.11 |
| Ti–10Nb | 0.45±0.09 | 4.74±0.19 | 0.98±0.04 | 1.52±0.04 | 81.21±0.51 | 11.09±0.27 | 0.34±0.04 | 4.96±0.46 | 1.13±0.13 | 1.52±0.04 | 80.99±0.5 | 11.06±0.3 |
| Ti–15Nb | 0.47±0.09 | 4.17±0.44 | 1.04±0.01 | 1.6±0.04 | 77.97±0.27 | 14.75±0.07 | 0.56±0.07 | 3.79±0.12 | 1.13±0.12 | 1.55±0.02 | 78.42±0.25 | 14.54±0.12 |
| Ti–20Nb | 0.55±0.16 | 4.24±0.38 | 1.14±0.09 | 1.58±0.05 | 72.58±0.82 | 19.9±0.48 | 0.55±0.04 | 4.17±0.07 | 1±0.02 | 1.61±0.04 | 72.55±0.33 | 20.13±0.28 |
| Ti–25Nb | 0.75±0.05 | 4.75±0.24 | 1.04±0.01 | 1.66±0.04 | 67.72±0.7 | 24.09±0.6 | 0.74±0.06 | 4.35±0.19 | 1.14±0.16 | 1.68±0.04 | 67.87±0.21 | 24.23±0.39 |
| cp-Ti | 0.22±0.17 | 5.04±1.01 | 0.77±0.55 | 0.83±0.59 | 90.42±1.89 | / | 0.22±0.08 | 5.04±0.34 | 0.77±0.19 | 0.83±0.03 | 90.42±0.24 | / |
Biological evaluation
Cytotoxicity evaluation of MC3T3-E1 pre-osteoblasts
LDH, which is released during cell damage, is a common biomarker for cytotoxicity. Figure 5A shows the results of the LDH assay and that the Ti–xNb alloys (x = 5, 10, 15, 20 and 25 wt%) demonstrated favourable biocompatibility at 24 h. The Ti–25Nb alloy exhibited a similar performance to cp-Ti (P > 0.05), while the remaining Ti–xNb alloys displayed a significantly lower concentration than the cp-Ti (P < 0.05). The proliferation of MC3T3-E1 cells was assessed by Prestoblue® Cell Viability Reagent (Fig. 5B). At 24 h, similar to the results of LDH assay, the MC3T3-E1 pre-osteoblast cells that were in contact with the Ti–5Nb, Ti–10Nb, Ti–15Nb and Ti–25Nb alloys exhibited significantly lower metabolic activity (respectively, 81.88 ± 5.08%, 7.51 ± 6.79%, 66.98 ± 3.67% and 65.88 ± 3.79%), while there was no significant difference observed for the Ti–20Nb alloy (88.55 ± 12.84%). At 96 h, there was a slight increase in the cell viability ratios of the Ti–xNb alloys, except for Ti–5Nb, which showed the least proliferation (77.00 ± 3.51%). The cell viability of the Ti–10Nb and Ti–25Nb alloys exceeded 98% with values of 98.67 ± 3.51% and 98.33 ± 7.77%, respectively. At 168 h, the mean proliferation ratios of the Ti–10Nb, Ti–15Nb and Ti–25Nb alloys were similar to that of cp-Ti (P > 0.05). Among the samples tested, the Ti–20Nb alloy exhibited the highest cell viability and was significantly better than that of the control group (P < 0.05), while the Ti–5Nb group exhibited the lowest cell proliferation rate (P < 0.05).
Figure 5.

(a) Concentration of LDH at 24 h and (b) proliferation assay of MC3T3-E1 at 24, 96 and 128 h. The result was expressed as the ratio versus cp-Ti (%)
ALP activity
As one of the most recognized indicators of osteoblastic differentiation, the ALP was measured by pNPP at 7, 14 and 21 days, and the results are shown in Fig. 6. At 7 days, the overall ALP activity was low, and no significant difference was found between the groups. At 14 days, the ALP activity was remarkably increased, and comparable or higher ALP activity was observed in all Ti–xNb alloys, among which Ti–25Nb showed the maximum ALP activity (2.89 ± 0.16), which was significantly higher than that of the cp-Ti (2.57 ± 0.06). At 21 days, the ALP activity showed a downward trend, and the performance of the Ti–xNb alloys was similar (P > 0.05). It is worth noting that the minimum reduction in the ALP activity occurred for the cp-Ti group (P < 0.05).
Figure 6.
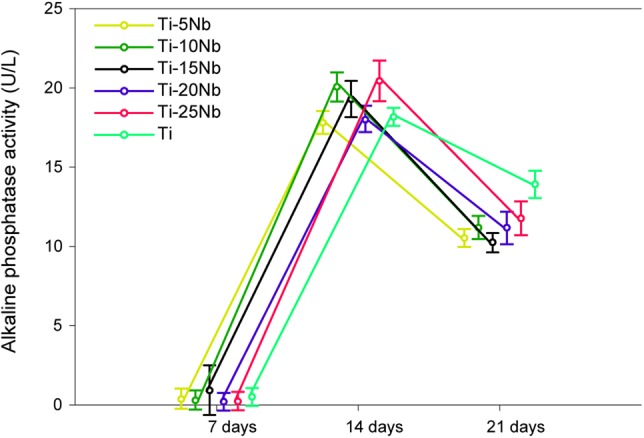
The ALP activity of MC3T3-E1 at 7, 14 and 21 days.
Discussion
Ti–xNb (x = 5, 10, 15, 20 and 25 wt%) alloys were prepared, and the concentration of Nb was indirectly confirmed by using XRD. The β/α phase peak intensity ratio gradually increased with increasing Nb content. In this study, we explored the influence of Nb in Ti–xNb alloys compared with cp grade 2 Ti, which are widely used [34, 35] and studied [1, 4, 36–41] in biomedical implants studies, from the following perspectives: strength, elastic modulus, corrosion resistance and biological response.
By adding Nb, even in a small amount, the tensile performance of Ti can be improved. The ultimate tensile strength and the yield strength of the Ti–5Nb alloy (536.5 and 407.0 MPa, respectively) were higher than those of cp-Ti (520 and 389.5 MPa, respectively). Hsu et al. also reported a higher bending strength in the Ti–5Nb group (1466 MPa) than in cp-Ti (844 MPa) [19]. Ti–6Al–4V was introduced as an implant biomaterial due to cp-Ti was suspected of inadequate strength for load-bearing devices. The ultimate tensile strength and the yield strength of Ti–25Nb alloy (1014 and 872.5 MPa, respectively) were higher than those of annealed Ti–6Al–4V (895–930 and 825–869 MPa, respectively) and could avoid the cytotoxicity effect induced by aluminium and vanadium [42]. With regards to roughness measurement, Ti–xNb showed significantly higher roughness than cp-Ti group, which also indirectly reflected limited wear resistance of cp-Ti. This might prone a concern about the inflammatory response caused by wear debris and shortened longevity of implant due to component excessive wear [43–45].
In addition to the enhanced strength, the Young’s moduli decreased due to the Nb functioning as a β stabilizer in the Ti–xNb alloys and was in the range of 69–87 GPa, which is remarkably lower than that of cp-Ti (E = 107.4 GPa) and pure β phase Ti alloys. The study by Sumitomo et al. confirmed that the elastic modulus of an implant would affect bone remodelling due to Wolff’s law and that the diameter of a tibia bone in rabbits was increased for bone plates with a low rigidly [46]. Hon et al. separated the ‘w-shaped’ curve of Ti (14–40 mass%)–Nb alloys into three intervals, while the elastic modulus of the Ti–15Nb, Ti–20Nb and Ti–25Nb alloys was ∼92, 83 and 80 GPa, respectively [13]. Mantanni and Kudou reported that among Ti–10Nb, Ti–15Nb and Ti–20Nb alloys, the lowest E was found for the Ti–15Nb alloy and was reduced to 47 GPa after appropriate cooling and quenching [17]. Bonisch et al. studied the elastic modulus of Ti–zNb (16 ≤ z ≤ 31 wt%) and observed a minimum E value for Ti–16Nb (E = 60–65 GPa) [47]. Although there was a similar amount of crystalline α/β phases, the discrepancy could be attributed to a metastable phase in the Ti–Nb alloys, including close-packed α′ martensite, orthorhombic α″ and hexagonal ω, and the pattern could be generalized as Eβ < Eα′<Eα″<Eω [6, 48]. The overall E represents a complex interaction of those equilibrium and non-equilibrium phases during the manufacturing process [49]. Although all of the Ti–xNb (x = 5, 10, 15, 20 and 25 wt%) alloys in this study comprised α + β type phases, their elastic moduli were comparable to or lower than those of some β-type Ti alloys, such as Ti–15Zr (E = 112 GPa) [50], Ti–16Nb–13Ta–4Mo (E = 91 GPa) [51] and Ti–15Sn–4Nb–2Ta–0.2Pd (E = 89 GPa) [52]. Therefore, binary Ti–Nb alloys are still appealing for orthopaedic implants.
In terms of hydrophilicity, the WCA of the Ti–5Nb alloy was the largest among the tested alloys and significantly higher than that of cp-Ti, while the remaining alloys exhibited a WCA comparable to cp-Ti. Wetting behaviour is strongly correlated with biological responses, including adhesion of proteins, cell attachment, spreading and proliferation. In addition, hydrophilic surfaces promote higher osseointegration and bone mineralization at the early stage than hydrophobic surfaces. Ponsonnet et al. also reported a similar CA of cp-Ti using distilled water (53.9 ± 5.1) [4]. Luz et al. measured the wettability of a Ti–10Nb alloy with a PBS drop, and the CA was ∼57° [10]. A few studies have reported the relationship between wettability and the type of Ti alloy. Yu et al. compared the wettability of a near-α alloy (Ti–6Al–2Zr–1Mo–1V, TA15), a near-β alloy (Ti–15Mo–3Al–2.7Nb–0.2Si, TB8) and an α-β alloy (Ti–6Al–4V, TC4) [53]. The study showed that among these alloys, TC4 had the lowest CA, followed by TB8 and TA15 at different anodizing voltages. However, this result should be interpreted carefully for Ti alloys because the composition varied substantially, which may also affect the surface energy and the hydrophobicity further. Although no significant difference was observed, it was noteworthy that the WCA of Ti–xNb alloys (x = 5, 10, 15, 20 and 25 wt%) was inversely proportional to the Nb content and positively correlated with the presence of the β phase.
In this study, a promising anti-corrosion capacity was demonstrated in Ti–xNb alloys from the measurement of the concentration of released metals, morphology and chemical composition. The concentration of metal released in the Ti–xNb alloys and cp-Ti in artificial saliva for 28 days was lower than the detection limit (<0.06 μg/ml), and very few corrosion pits were found on the surface of the studied and control groups after treatment with an acid solution (pH 2.21). Furthermore, no significant difference was observed in the semi-quantitative analysis of Ti, Nb and O, and it could be concluded that the Ti–xNb alloys remained stable, even in an acidic environment. The debris and metal released from implanted metallic materials are inevitable and sustainable. Upon implantation, the oral cavity, an aggressive and hostile environment to metallic alloys, stimulates an electrochemical reaction and the occurrence of corrosion [54]. The biological response of metallic implants is strongly related to their anti-corrosion properties. When Kim et al. immersed Ti–10Nb and Ti–20Nb alloys in Hank’s solution (pH 3.4) for 10–50 days, no metal ion release was detected (<0.01 μg/ml) and very few metal ions (0.06–0.07 μg/ml) were released after the immersion test in 0.1% lactic acid for 50 days [55]. The reason for this corrosion resistance was that Nb spontaneously formed a passive layer on the surface of the Ti–Nb-based alloys. It was different from Ti–6Al–4V, which released Al and V elements into the solution [44]. Wang et al. observed a stable oxide film composed of TiO2 and Nb2O5 and a lower passivation current density in a Ti–16Nb alloy (at%) than that in cp-Ti [56]. In addition, a recent study noted that Nb had better corrosion resistance under high levels of fluoride ions than cp-Ti, which could be ascribed to the stronger metal–metal bond strength and lower dissolution of Nb [38].
The biocompatibility between MC3T3-E1 cells and the Ti–xNb surface in a short-time period was favourable in the LDH assay and proliferation test. The concentration of LDH at 24 h in all studied groups was not significantly higher than that of cp-Ti, and this result was roughly in accordance with the study of Park et al., which showed that a Ti–(5, 10, 15, 20 wt%)Nb alloy demonstrated non-cytotoxicity in an agar overlay assay [57]. The proliferation curves of 24, 96 and 168 h showed an almost upward metabolic trend for the Ti–xNb alloys. However, a significantly lower proliferation rate was found in the Ti–5Nb alloy at 96 and 168 h, which indicated weak cell behaviour. Among the tests, the Ti–20Nb alloy showed the highest proliferation at 168 h. Although the mean cell proliferation of the Ti–10Nb, Ti–15Nb and Ti–20Nb alloy was lower at 96 h, the performance was comparable to that of cp-Ti at 168 h. Other studies also confirmed the satisfactory biological behaviour of Nb because Ti–6Al–7Nb was a lower osteolytic mediator and had greater osteopontin synthesis and higher vinculin signals than Ti–6Al–4V [58, 59]. In addition, the current study also verified that the Ti alloy component may affect the ultimate biocompatibility. Ti–5Nb displayed a lower proliferation rate than the other groups and this phenomenon may be associated with the relatively poor wettability of Ti–5Nb.
Upon incubation in a mineralization medium for 21 days, the activity of alkaline phosphate secreted by MC3T3-E1 pre-osteoblasts was not affected by the Ti–xNb alloy group and was roughly the same as that of the cp-Ti group. As an early biomarker for bone mineralization, alkaline phosphate becomes enriched when osteoblasts mature. The cellular response is extremely sensitive to the surface characteristics, and studies have discovered that variations in metallic species primarily induce alterations in matrix enzymes and ALP activity. When investigating the differentiation behaviour of human osteoblast-like cells (Saos-2) on Ti–6Al–4V or Ti–6Al–7Nb, Shapira et al. observed a higher expression of ALP, osteocalcin and transforming growth factor (TGFβ) for Ti–6Al–7Nb and concluded that Ti–6Al–7Nb may be more advantageous than Ti–6Al–4V for biomedical use [60]. In this study, no significant difference was observed at 7 days due to the very small amount of ALP generated. The activity of ALP dramatically increased at 14 days. There was either a similar or better performance for the Ti–xNb (x = 5, 10, 15, 20 and 25 wt%) alloys than for cp-Ti, which demonstrated the good bone-building capacity for Nb. The activity of ALP in the cp-Ti showed a minimum reduction at 21 days and exceeded that of all the Ti–xNb alloys. However, some researchers reported a similar or higher osteogenic expression in Ti–Nb alloys than that in cp-Ti after 21 days in human osteo-like MG-63 cells and mice bone marrow stromal cells (ST-2) [61].
Within the limitations of this study, in general, Ti–xNb (x = 5, 10, 15, 20 and 25 wt%) alloys are a promising candidate for biomedical implants in terms of their mechanical properties, anti-corrosion properties, biocompatibility performance and biological behaviour. However, it should be noticed that this study only assessed the biological activities in terms of cytotoxicity of MC3T3-E1 and ALP activity. Additional experiments, such as Alizarin Red staining, PCR analysis, immune-chemistry staining and animal trials are necessary before putting Ti–Nb alloys into clinical practice. Nonetheless, Ti–5Nb should be applied with caution since the results of the WCA and proliferation rate tests were not as promising as those of other studied groups as well as cp-Ti. Further mechanical tests such as fatigue and machinability must be considered in the future.
Conclusion
The mechanical properties of Ti–xNb (x = 5, 10, 15, 20 and 25 wt%) depends on Nb content, due to the presence of β phase. Binary Ti–(10–25 wt%)Nb alloys are promising candidate for biomedical implants due to the improved mechanical properties and comparable biological performance, while Ti–5Nb should be used with caution.
Acknowledgements
This work was done in partial fulfilment of the requirements of the degree of Doctor of Philosophy for the first author (Y.Z.). The authors would like to acknowledge the assistance of Songquan Wu for technical consultation.
Funding
The study was partially supported by the National Natural Science Foundation of China (NSFC) (grant number 81771126).
Conflict of interest statement. None declared.
References
- 1. Eisenbarth E, Velten D, Müller M. et al. Biocompatibility of β-stabilizing elements of titanium alloys. Biomaterials 2004;25:5705–13. [DOI] [PubMed] [Google Scholar]
- 2. Cordeiro JM, Beline T, Ribeiro ALR. et al. Development of binary and ternary titanium alloys for dental implants. Dent Mater 2017;33:1244–57. [DOI] [PubMed] [Google Scholar]
- 3. Iijima D, Yoneyama T, Doi H. et al. Wear properties of Ti and Ti-6Al-7Nb castings for dental prostheses. Biomaterials 2003;24:1519–24. [DOI] [PubMed] [Google Scholar]
- 4. Ponsonnet L, Reybier K, Jaffrezic N. et al. Relationship between surface properties (roughness, wettability) of titanium and titanium alloys and cell behaviour. Mater Sci Eng C 2003;23:551–60. [Google Scholar]
- 5. Liu X, Chen S, Tsoi JKH. et al. Binary titanium alloys as dental implant materials—a review. Regen Biomater 2017;4:315–23. [DOI] [PMC free article] [PubMed] [Google Scholar]
- 6. Lai M, Tasan CC, Zhang J. et al. Origin of shear induced β to ω transition in Ti–Nb-based alloys. Acta Mater 2015;92:55–63. [Google Scholar]
- 7. Abdel-Hady M, Hinoshita K, Morinaga M.. General approach to phase stability and elastic properties of β-type Ti-alloys using electronic parameters. Scr Mater 2006;55:477–80. [Google Scholar]
- 8. Weinmann M, Schnitter C, Stenzel M. et al. Development of bio-compatible refractory Ti/Nb (/Ta) alloys for application in patient-specific orthopaedic implants. Int J Refract Metals Hard Mater 2018;75:126–36. [Google Scholar]
- 9. Niinomi M. Recent research and development in titanium alloys for biomedical applications and healthcare goods. Sci Technol Adv Mater 2003;4:445. [Google Scholar]
- 10. Luz AR, Santos LS, Lepienski CM. et al. Characterization of the morphology, structure and wettability of phase dependent lamellar and nanotube oxides on anodized Ti-10Nb alloy. Appl Surf Sci 2018;448:30–40. [Google Scholar]
- 11. Bania PJ. Beta titanium alloys and their role in the titanium industry. JOM 1994;46:16–9. [Google Scholar]
- 12. Chang L, Wang Y, Ren Y.. In-situ investigation of stress-induced martensitic transformation in Ti–Nb binary alloys with low Young's modulus. Mater Sci Eng A 2016;651:442–8. [Google Scholar]
- 13. Hon YH, Wang JY, Pan YN.. Composition/phase structure and properties of titanium-niobium alloys. Mater Trans 2003;44:2384–90. [Google Scholar]
- 14. Karre R, Niranjan MK, Dey SR.. First principles theoretical investigations of low Young's modulus beta Ti–Nb and Ti–Nb–Zr alloys compositions for biomedical applications. Mater Sci Eng C 2015;50:52–8. [DOI] [PubMed] [Google Scholar]
- 15. Bönisch M, Calin M, Van Humbeeck J. et al. Factors influencing the elastic moduli, reversible strains and hysteresis loops in martensitic Ti–Nb alloys. Mater Sci Eng C 2015;48:511–20. [DOI] [PubMed] [Google Scholar]
- 16. Mantani Y, Tajima M.. Effect of ageing on internal friction and elastic modulus of Ti–Nb alloys. Mater Sci Eng A 2006;442:409–13. [Google Scholar]
- 17. Mantani Y, Kudou K.. Effect of plastic deformation on material properties and martensite structures in Ti–Nb alloys. J Alloys Compounds 2013;577:S448–S452. [Google Scholar]
- 18. Guo Y, Georgarakis K, Yokoyama Y. et al. On the mechanical properties of TiNb based alloys. J Alloys Compounds 2013;571:25–30. [Google Scholar]
- 19. Hsu HC, Hsu SK, Wu SC. et al. Structure and mechanical properties of As-Cast Ti–5Nb–xFe alloys. Mater Characterization 2010;61:851–8. [Google Scholar]
- 20. Lee CM, Ju C-P, Chern Lin JH.. Structure–property relationship of cast Ti–Nb alloys. J Oral Rehabil 2002;29:314–22. [DOI] [PubMed] [Google Scholar]
- 21. Han MK, Kim JY, Hwang MJ. et al. Effect of Nb on the microstructure, mechanical properties, corrosion behavior, and cytotoxicity of Ti-Nb alloys. Materials 2015;8:5986–6003. [DOI] [PMC free article] [PubMed] [Google Scholar]
- 22. Xu LJ, Xiao SL, Jing T. et al. Microstructure and dry wear properties of Ti-Nb alloys for dental prostheses. Trans Nonferrous Metals Soc China 2009;19:s639–s644. [Google Scholar]
- 23. Jang SH, Choe HC, Ko YM. et al. Electrochemical characteristics of nanotubes formed on Ti–Nb alloys. Thin Solid Films 2009;517:5038–43. [Google Scholar]
- 24. Zhao D, Chang K, Ebel T. et al. Microstructure and mechanical behavior of metal injection molded Ti–Nb binary alloys as biomedical material. J Mech Behav Biomed Mater 2013;28:171–82. [DOI] [PubMed] [Google Scholar]
- 25. Bönisch M, Calin M, Waitz T. et al. Thermal stability and phase transformations of martensitic Ti-Nb alloys. Sci Technol Adv Mater 2013;14:5004. [DOI] [PMC free article] [PubMed] [Google Scholar]
- 26. Qian W, Han C, Choma T. et al. Effect of Nb content on microstructure, property and in vitro apatite-forming capability of Ti-Nb alloys fabricated via selective laser melting. Mater Des 2017;126:268–77. [Google Scholar]
- 27. Banumathy S, Prasad KS, Mandal RK. et al. Effect of thermomechanical processing on evolution of various phases in Ti-Nb alloys. Bull Mater Sci 2011;34:1421–34. [Google Scholar]
- 28. Banumathy S, Mandal RK, Singh AK.. Texture and anisotropy of a hot rolled Ti–16Nb alloy. J Alloys Compounds 2010;500:L26–L30. [Google Scholar]
- 29. Bidaux J-E, Pasquier R, Rodriguez-Arbaizar M. et al. Low elastic modulus Ti–17Nb processed by powder injection moulding and post-sintering heat treatments. Powder Metall 2014;57:320–3. [Google Scholar]
- 30. Tao Z, Yang H, Li H. et al. Quasi-static tensile behavior of large-diameter thin-walled Ti–6Al–4V tubes at elevated temperature. Chin J Aeronaut 2016;29:542–53. [Google Scholar]
- 31. AlOtaibi A, Sherif EM, Zinelis S. et al. Corrosion behavior of two cp titanium dental implants connected by cobalt chromium metal superstructure in artificial saliva and the influence of immersion time. Int J Electrochem Sci 2016;11:5877–90. [Google Scholar]
- 32. Nanci A. Ten Cate's Oral Histology, 8th edn Missouri: Elsevier Mosby, 2013. [Google Scholar]
- 33. Villard N, Seneviratne C, Tsoi JK. et al. Candida albicans aspects of novel silane system-coated titanium and zirconia implant surfaces. Clin Oral Impl Res 2015;26:332–41. [DOI] [PubMed] [Google Scholar]
- 34. Elias C, Lima J, Valiev R. et al. Biomedical applications of titanium and its alloys. JOM 2008;60:46–9. [Google Scholar]
- 35. Sidambe A. Biocompatibility of advanced manufactured titanium implants—a review. Materials 2014;7:8168–88. [DOI] [PMC free article] [PubMed] [Google Scholar]
- 36. Gittens RA, Olivares-Navarrete R, Cheng A. et al. The roles of titanium surface micro/nanotopography and wettability on the differential response of human osteoblast lineage cells. Acta Biomater 2013;9:6268–77. [DOI] [PMC free article] [PubMed] [Google Scholar]
- 37. Luz AR, de Lima GG, Santos E Jr. et al. Tribo-mechanical properties and cellular viability of electrochemically treated Ti-10Nb and Ti-20Nb alloys. J Alloys Compounds 2019;779:129–39. [Google Scholar]
- 38. Li Y, Xu J.. Is niobium more corrosion-resistant than commercially pure titanium in fluoride-containing artificial saliva? Electrochim Acta 2017;233:151–66. [Google Scholar]
- 39. Han AF, Li XL, Huang BX. et al. The effect of titanium implant surface modification on the dynamic process of initial microbial adhesion and biofilm formation. Int J Adhes 2016;69:125–32. [Google Scholar]
- 40. Ho BJ, Tsoi JKH, Liu D. et al. Effects of sandblasting distance and angles on resin cement bonding to zirconia and titanium. Int J Adhes 2015;62:25–31. [Google Scholar]
- 41. Matinlinna JP, Tsoi JKH, de Vries J. et al. Characterization of novel silane coatings on titanium implant surfaces. Clin Oral Impl Res 2013;24:688–97. [DOI] [PubMed] [Google Scholar]
- 42. Niinomi M. Mechanical properties of biomedical titanium alloys. Mater Sci Eng A 1998;243:231–6. [Google Scholar]
- 43. Jasty M. Clinical reviews: particulate debris and failure of total hip replacements. J App Biomater 1993;4:273–6. [DOI] [PubMed] [Google Scholar]
- 44. Long M, Rack HJ.. Titanium alloys in total joint replacement—a materials science perspective. Biomaterials 1998;19:1621–39. [DOI] [PubMed] [Google Scholar]
- 45. Jie F, Akiko Y, Hee Young K. et al. Novel Ti-base superelastic alloys with large recovery strain and excellent biocompatibility. Acta Biomater 2015;17:56–67. [DOI] [PubMed] [Google Scholar]
- 46. Sumitomo N, Noritake K, Hattori T. et al. Experiment study on fracture fixation with low rigidity titanium alloy. J Mater Sci Mater Med 2008;19:1581–6. [DOI] [PubMed] [Google Scholar]
- 47. Okulov I, Volegov A, Attar H. et al. Composition optimization of low modulus and high-strength TiNb-based alloys for biomedical applications. J Mech Behav Biomed Mater 2017;65:866–71. [DOI] [PubMed] [Google Scholar]
- 48. Ehtemam-Haghighi S, Liu Y, Cao G. et al. Influence of Nb on the β→ α″martensitic phase transformation and properties of the newly designed Ti–Fe–Nb alloys. Mater Sci Eng C 2016;60:503–10. [DOI] [PubMed] [Google Scholar]
- 49. Mantani Y, Tajima M.. Phase transformation of quenched α″martensite by aging in Ti–Nb alloys. Mater Sci Eng A 2006;438:315–9. [Google Scholar]
- 50. Correa D, Vicente F, Donato T. et al. The effect of the solute on the structure, selected mechanical properties, and biocompatibility of Ti–Zr system alloys for dental applications. Mater Sci Eng C 2014;34:354–9. [DOI] [PubMed] [Google Scholar]
- 51. Niinomi M, Kuroda D, Fukunaga K-i. et al. Corrosion wear fracture of new β type biomedical titanium alloys. Mater Sci Eng A 1999;263:193–9. [Google Scholar]
- 52. Okazaki Y, Rao S, Ito Y. et al. Corrosion resistance, mechanical properties, corrosion fatigue strength and cytocompatibility of new Ti alloys without Al and V. Biomaterials 1998;19:1197–215. [DOI] [PubMed] [Google Scholar]
- 53. Yu YS, Xie LS, Chen MH. et al. Surface characteristics and adhesive strength to epoxy of three different types of titanium alloys anodized in NaTESi electrolyte. Surf Coat Technol 2015;280:122–8. [Google Scholar]
- 54. Khorasani AM, Goldberg M, Doeven EH. et al. Titanium in biomedical applications—properties and fabrication: a review. J Biomater Tissue Eng 2015;5:593–619. [Google Scholar]
- 55. Kim SE, Jeong HW, Yong TH. et al. Elastic modulus and in vitro biocompatibility of Ti−xNb and Ti−xTa alloys. Met Mater Int 2007;13:145. [Google Scholar]
- 56. Wang YB, Zheng YF.. Corrosion behaviour and biocompatibility evaluation of low modulus Ti–16Nb shape memory alloy as potential biomaterial. Mater Lett 2009;63:1293–5. [Google Scholar]
- 57. Park YJ, Song YH, An JH. et al. Cytocompatibility of pure metals and experimental binary titanium alloys for implant materials. J Dent 2013;41:1251–8. [DOI] [PubMed] [Google Scholar]
- 58. Rogers SD, Howie DW, Graves SE. et al. In vitro human monocyte response to wear particles of titanium alloy containing vanadium or niobium. J Bone Joint Surg 1997;79-B:311–5. [DOI] [PubMed] [Google Scholar]
- 59. Challa VSA, Mali S, Misra R.. Reduced toxicity and superior cellular response of preosteoblasts to Ti-6Al-7Nb alloy and comparison with Ti-6Al-4V. J Biomed Mater Res 2013;101A:2083–9. [DOI] [PubMed] [Google Scholar]
- 60. Shapira L, Klinger A, Tadir A. et al. Effect of a niobium-containing titanium alloy on osteoblast behavior in culture. Clin Oral Implants Res 2010;20:578–82. [PubMed] [Google Scholar]
- 61. Bai Y, Deng Y, Zheng Y. et al. Characterization, corrosion behavior, cellular response and in vivo bone tissue compatibility of titanium–niobium alloy with low Young's modulus. Mater Sci Eng C 2016;59:565–76. [DOI] [PubMed] [Google Scholar]