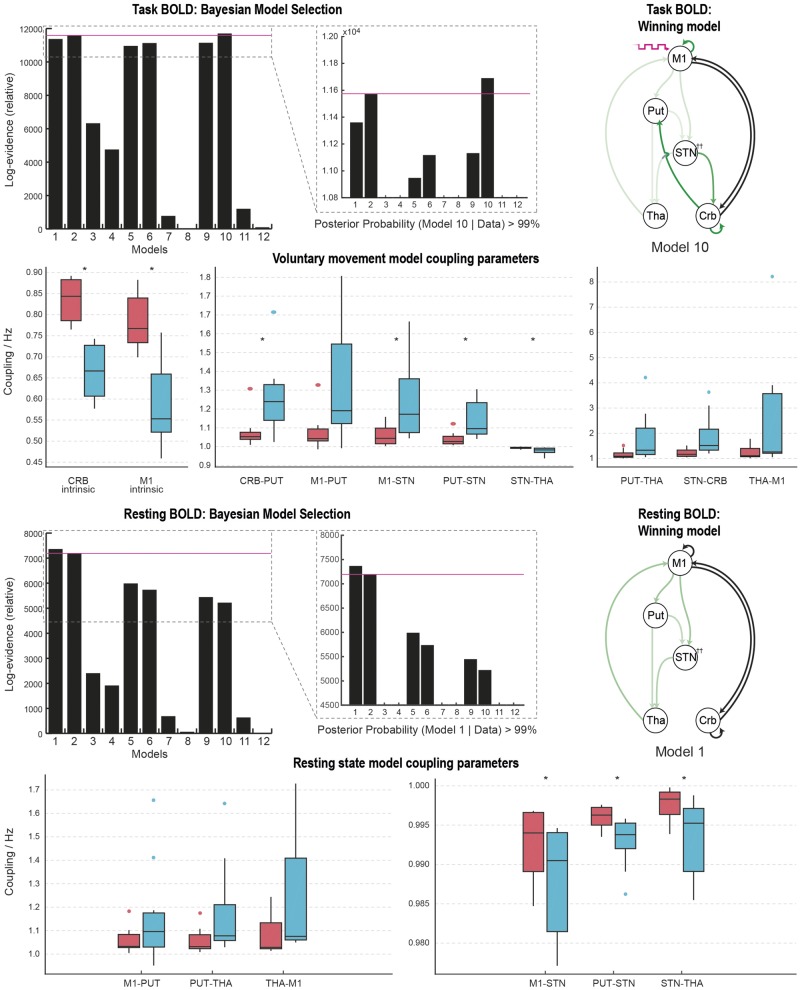
Figure 5.
Model comparisons and coupling parameters: model comparison revealed that model 10 was the most likely generator of the movement data. Green arrows represent the pathways modulated by DBS. Black arrows represent non-modulated pathways engaged during voluntary movement. Box plots represent the distribution (median, interquartile range) of coupling strength values on (blue) and off (red) DBS across 11 subjects. Paired t-tests of these values revealed statistically significant changes in coupling strengths in 7 of 10 pathways founds to be modulated by DBS. Coloured circles represent data points considered to be outliers. Model comparison revealed that model 1 was the most likely generator of the resting state data. Green arrows represent the pathways modulated by DBS. Black arrows represent non-modulated pathways engaged during rest. *P < 0.05 (Bonferroni corrected). Crb/CRB = cerebellum; Put/PUT = putamen; Tha/THA = thalamus.

