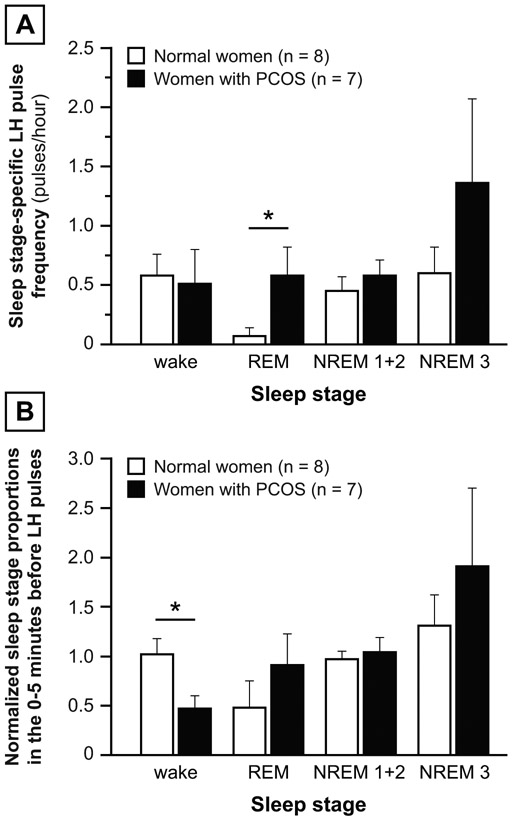
Figure 7: Normal vs. PCOS.
Panel A: LH pulse frequency for a given sleep stage was calculated as the number of LH pulses instantaneously associated with the sleep stage divided by the percentage of total sleep period (in hours) occupied by that sleep stage. For women studied during two overnight admissions, sleep stage-associated LH pulse frequencies were calculated for both admissions and results averaged. Panel B: “Normalized” sleep stage proportions in the 0-5 minutes before LH pulses, defined as the average sleep stage proportion 0-5 minutes before all sleep-related LH pulses in an admission divided by the corresponding sleep stage proportion for the sleep period. Both panels: For subjects with two overnight admissions, results were calculated for each admission and averaged. Data are presented as mean ± standard error of the mean. * p < 0.05.

