

Abstract
Our previous study demonstrated that intranasal administration of histone deacetylase inhibitor sodium butyrate (NaB) exhibits therapeutic effects on a mouse model of allergic rhinitis (AR). However, whether NaB is effective on AR when administered orally and prophylactically, as well as its potential effects on gene expression, remained unknown. The present study aimed to investigate the preventive effect of NaB on AR when added to the diet of newly weaned mice and to evaluate the changes in long non-coding (lnc)RNA and mRNA expression profiles in the nasal mucosa. Mice were randomly divided into three groups as follows: i) Control (C) group, (no treatment); ii) AR group [treated with ovalbumin (OVA)]; and iii) NaB + AR group (treated with OVA and NaB). The NaB + AR group was administered NaB in their feed (30 g/kg chow), whereas the other two groups were fed normal feed between 3 and 6 weeks of age. At 7 weeks of age, OVA administration was initiated to induce AR in the AR and NaB + AR groups. Following model establishment, behavioral assessments, western blotting and gene expression analysis were performed. NaB exhibited a preventive effect in the murine AR model, diminished the increases in histone deacetylase 1 (HDAC1) and HDAC8 expression and increased OVA-induced acetylation of histone H3 at lysine 9. In addition, NaB increased the AR-associated low expression of interleukin 2 (IL-2), interferon γ and IL-17 and decreased the expression of IL-4, IL-5 and transforming growth factor β1. Gene Ontology and pathway analyses revealed the top 10 pathways among the groups. Octamer-binding transcription factor 1, ecotropic viral integration site 1 and paired box 4 were predicted to be target genes of lncRNA (NONMMUT057309). Thus, NaB may exhibit a preventive effect on AR. Additionally, the lncRNA and mRNA expression profiles in the nasal mucosa of mice with AR differed significantly following NaB treatment. These results may provide insights into the pathogenesis of AR and suggest new treatment targets.
Keywords: histone deacetylase, lncRNA, mouse model, sodium butyrate, allergic rhinitis
Introduction
Allergic rhinitis (AR), a non-infectious disease of the nasal mucosa, is primarily mediated by immunoglobulin E (IgE) following contact with allergens (1). The self-reported prevalence of AR in 11 cities across Mainland China had wide variations in 2005, ranging between <10 and >20% (2); in 2011, the standardized prevalence of adult AR in the 18 major cities was 17.6%, with the highest prevalence of 23% in Shanghai and the lowest prevalence of 9.8% in Chengdu (3). The number of patients with AR in China has increased by 100 million between 2005 and 2011 (4). AR has traditionally been considered to originate from a T helper (Th)1/Th2 immune response imbalance, leading to allergic inflammation dominated by the Th2 immune response within the nasal mucosa (5). Following further study, the pathogenesis of AR has been extended from the Thl/Th2 model to a Thl/Th2/Thl7 and T regulatory cell (Treg) model (6). However, as AR is a multi-factor disease induced by gene-environment interactions, its exact pathogenesis has not been elucidated.
Lysine acetylation is a reversible post-transcriptional modification that regulates changes in gene expression profiles (7). Two opposing enzymes function intracellularly to determine protein acetylation levels; specifically, histone acetyltransferase (HAT) catalyzes the addition of an acetyl group to lysine residues, whereas histone deacetylase (HDAC) catalyzes the removal of an acetyl group from lysine residues (7). The HAT/HDAC balance maintains histone acetylation levels and regulates gene transcription (8). Redox signaling, which is mediated by HAT-induced inactivation of histone acetylation, decisively contributes to the activation phase of the inflammatory cascade (9). Targeting HAT Tip60 inhibits intestinal allergies in a mouse model (10). The expression of HDAC1, HDAC5, HDAC6 and HDAC8 increases in asthmatic mice (11); HDAC11 (12) and HDAC1 (13) expression levels are increased in patients with AR, and HDAC1 also participates in the pathogenesis of childhood asthma (14).
Sodium butyrate (NaB) is an aliphatic acid and a nonspecific HDAC inhibitor (15). The results of our previous study indicated that NaB nasal drops decreased the expression of HDAC1 and HDAC3 and increased histone H3 acetylation at lysine 9 (H3-AcK9) (16). Butyrate is the final product of the anaerobic fermentation of dietary fiber by intestinal microorganisms (17), and butyrate levels in stool samples from patients with atopic dermatitis have been demonstrated to be decreased (18). Oral NaB may modulate brain metabolism (19) and attenuate experimental murine colitis in an IL-10 independent manner (20).
The objective of the present study was to investigate the preventive effect of NaB on AR by adding it to the diet of newly weaned mice at 3 weeks of age and to determine the changes in lncRNA and mRNA expression profiles in the nasal mucosa following NaB treatment.
Materials and methods
Animals and trials
BALB/C mice (3 weeks old; 6-8 g) were purchased from the Air Force Military Medical University (Xi'an, China). Mice were maintained in a pathogen-free environment under a 12/12-h light/dark cycle at 22°C with free access to food and water. All animal experiments were conducted in accordance with the National Institutes of Health guidelines and approved by the Committee on Animal Research of the Air Force Military Medical University (approval no. KJ-2016-XJB5436).
Mice were randomly divided into three groups (n=30 mice/group) as follows: i) Control (C) group (no treatment); ii) AR group [treated with ovalbumin (OVA)]; and iii) NaB + AR group (treated with OVA and NaB). Mice began to feed after weaning at 3 weeks of age. The mouse feed was premixed, 30 g/kg NaB (Sigma-Aldrich; Merck KGaA) was added, and granules were produced. Normal feed and NaB feed were provided by the Animal Center of the Air Force Medical University. Each mouse in the NaB + AR group consumed an average of 5 g feed/day, which contained 0.15 g NaB. The other 2 groups were provided with normal feed throughout the study period. At 7 weeks of age, mice in the AR and NaB + AR groups received intraperitoneal injections of mixed OVA solution (20 mg) and aluminum (2 mg) in 0.5 ml PBS on days 1, 3, 6 and 8, whereas the control mice received injections of aluminum (2 mg) in 0.5 ml PBS under the same schedule. Mice in the AR and NaB + AR groups were also treated with 10% OVA (20 µl) via intranasal instillation once daily between days 15 and 24. Mice in the control group were treated with 20 µl PBS via intranasal instillation once daily during the same period. Fig. 1 demonstrates the experimental design. One hour after the last challenge, mice were anesthetized (4% chloral hydrate, 400 mg/kg) and venous blood was obtained for use in ELISA [mouse ELISA kits: IL-2 (cat. no. 223588), IL-4 (cat. no. 221833), IL-5 (cat. no. 204523), IL-17 (cat. no. 100702), interferon γ (IFN-γ; cat. no. 46107) and transforming growth factor-β1 (TGF-β1; cat. no. 119557); all from Abcam]. Following blood sample collection, the mice were sacrificed by cervical dislocation, and the nasal mucosa was preserved in liquid nitrogen for further analysis.
Figure 1.
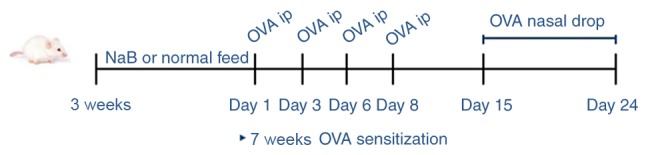
Experimental design. NaB, sodium butyrate; OVA, ovalbumin; ip, intraperitoneal injection; w, week.
Behavioral assessment
Allergy symptoms were assessed using the following scoring criteria: 1 point for sneezing 1-3 times during a 30-min observation, clear nasal flow to the anterior nostril and occasional scratching of the nose with a single front limb; 2 points for sneezing 4-10 times, clear nasal flow beyond the nostril and scratching of the nose with both front limbs; and 3 points for sneezing >10 times, clear nasal flow to the face and continuous scratching. After the last stimulation, each animal was observed for 30 min, and the three parameters were recorded and quantified. A total score >5 points indicated that the model was successfully established (21).
Histological observation
The muscle tissue of the nose was removed, and the nasal cavity was fixed in 4% formaldehyde for 24 h at 37°C. Following 10% EDTA decalcification for 24 h at 37°C, the nose was embedded in paraffin, and 4-µm sections were cut. The sections (4-µm) were dewaxed, stained with hematoxylin (cat. no. 245880; Abcam) for 10 min, differentiated with 1% hydrochloric acid ethanol for 1 min, stained with eosin for 1 min, dehydrated with a series of ethanol concentrations (70, 80, 90 and 100%) ethanol for 10 sec, incubated with xylene for 1 min and sealed. In addition, other sections were dewaxed, soaked with 3% acetic acid for 3 min, stained with 1% Alcian blue (cat. no. 150680; Abcam) for 30 min, soaked with 3% acetic acid for 3 min, washed with water, oxidized with 0.5% periodate for 10 min, soaked in Schiff's solution for 20 min and sealed.
Western blotting
Proteins were obtained from the nasal mucosa tissues of each mouse 1 h after the final intranasal administration of OVA or PBS. Proteins were extracted using a Protein Extraction kit (Applygen Technologies, Inc.), and total protein concentrations were measured using the Bio-Rad protein assay kit (Bio-Rad Laboratories, Inc.). A total of 20 µg protein/lane was isolated by 12.5% sodium dodecyl sulfate-polyacrylamide gel electrophoresis and transferred to a nitrocellulose membrane (Bio-Rad Laboratories, Inc.). The membranes were blocked with 2.5% nonfat milk at 37°C for 1 h and incubated with anti-HDAC1 (mouse; 1:1,000; cat. no. 5356), anti-H3 (rabbit; 1:1,000; cat. no. 4499), anti-H3-AcK9 (rabbit; 1:1,000; cat. no. 9649S; all from Cell Signaling Technology, Inc.), anti-HDAC8 (rabbit; 1:1,000; cat. no. 187139; Abcam) and anti-GAPDH (mouse; 1:1,000; cat. no. 686613; R&D Systems, Inc.) antibodies overnight at 4°C. Following exposure to horseradish peroxidase-conjugated anti-mouse and anti-rabbit IgG secondary antibodies (1:200; Sigma-Aldrich; Merck KGaA) for 1 h at 37°C, immunoreactive bands were detected using an enhanced chemiluminescence western blotting system (Thermo Fisher Scientific, Inc.).
RNA microarray
The CapitalBio Technology Mouse LncRNA Array v1 was designed with four identical arrays per slide (4X180K format), with each array containing probes for 58,809 mouse lncRNAs and 39,027 mouse mRNAs. The lncRNA and mRNA target sequences were obtained by merging the results from multiple databases, including NCBI RefSeq (https://www.ncbi.nlm.nih.gov/), Ensembl (http://asia.ensembl.org/index.html), UCSC (http://www.genome.ucsc.edu/), FANTOM (https://fantom.org/), LncRNAdb (http://live.dbpedia.org/page/LncRNAdb/), NO NCODE V4.0 (http://www.noncode.org/), UCR (https://www.ucr.edu/), LncRNA Disease (http://www.cuilab.cn/lncrnadisease) and LncRNA.org (https://lncipedia.org/). Each RNA was detected by probes based on ≥2 replicates. The array also contained 4,974 Agilent control probes.
RNA extraction, amplification, labeling and hybridization
The microarray assay was performed by Capital Biotech Corporation (Beijing, China) with the Agilent mouse lncRNA + mRNA Array V4.0 (4X180K) (Agilent Technologies, Inc.) according to the manufacturer's instructions. Total RNA was extracted using TRIzol® reagent (Invitrogen; Thermo Fisher Scientific, Inc.) according to the manufacturer's instructions. Briefly, 200 ng purified RNA from each sample was amplified and reverse-transcribed into cDNA. The cDNAs were transcribed into cRNAs at 70°C for 5 min, 25°C for 5 min and 4°C for 2 min, and the cRNAs were transcribed into cDNAs using the WT Expression Kit (cat. no. 4411973; Thermo Fisher Scientific, Inc.) at 70°C for 5 min, 25°C for 5 min and 4°C for 2 min, labeled with a fluorescent dye (Cy3-dCTP, Agilent Technologies, Inc.), denatured at 95°C for 3 min and incubated in an ice bath for 5 min. Labeled cDNAs were hybridized onto a Crystal core human lncRNA chip V4.0. The microarray data analyzed in the present study have been deposited in the NCBI GEO database under the accession number GSE140454.
Microarray imaging and data analysis
The lncRNA and mRNA array data were analyzed for data summarization, normalization and quality control using Gene Spring software V12.0 (Agilent Technologies, Inc.). To identify the differentially expressed genes, the threshold values of fold-change ≥2 and ≤−2 and a Benjamini-Hochberg corrected P-value <0.05 were used. The data were log2-transformed and median-centered on genes using the 'Adjust Data' function of CLUSTER 3.0 software (Michiel de Hoon, University of Tokyo, Human Genome Center) prior to further analysis via hierarchical clustering with average linkage. Tree visualization was performed using Java Treeview 3.0 (Stanford University School of Medicine).
RNA isolation and reverse transcription-quantitative PCR (RT-qPCR)
Total RNA was extracted using TRIzol® reagent (Invitrogen; Thermo Fisher Scientific, Inc.) according to the manufacturer's instructions. The concentration, quality and purity of RNA were assessed using the RNA 6000 Nano assay on the Agilent 2100 Bioanalyzer (Agilent Technologies, Inc.). No samples exhibited RNA degradation (ratio of 28S:18S ribosomal RNA ≥2) or contamination with DNA. For reverse transcription, samples were incubated in an Eppendorf PCR system at 42°C for 30 min, 90°C for 5 min and 5°C for 5 min. The samples were subjected to qPCR with specific primers (Table SI). qPCR was performed in a 10 µl total volume containing 1 µl cDNA, 5 µl SYBR® Green Real-time PCR Master Mix (Toyobo Life Science) and 1 µl of each primer under the following conditions: 95°C for 10 sec at; 40 cycles of 60°C for 5 sec and 72°C for 10 sec; and 65°C for 30 sec. Melting analysis of PCR products was conducted to validate the amplification of a specific product, and the relative fold-change was calculated using the 2−∆∆Cq method normalized to GAPDH (22).
LncRNA-mRNA co-expression and construction of the coding-non-coding gene co-expression network
Differentially expressed mRNAs were used to construct a co-expression network to explore specific lncRNAs involved in the pathogenesis of AR. Pearson correlation coefficients (PCCs) were calculated between selected mRNAs and all differentially expressed lncRNAs. A PCC ≥0.99 indicated that the selected lncRNA and mRNA formed a significantly correlated pair.
The coding-non-coding gene co-expression network was constructed based on the correlation analysis between differentially expressed lncRNAs and mRNAs. Significantly correlated pairs (based on PCC) were selected to construct the network. LncRNAs and mRNAs with PCCs ≥0.99 were selected to draw the network using the open-source bioinformatics software Cytoscape 3.7.2 (https://cytoscape.org/). For network analysis, a degree of centrality was defined as the number of links that one node had to others.
Prediction of cis-acting and trans-acting lncRNA
The prediction of cis-acting lncRNA was performed based on a strong correlation between the lncRNA and a group of expressed protein-coding genes (PCC ≥0.99). The lncRNAs were only selected if they resided at the genomic loci where a protein-coding gene and an lncRNA gene were within 10 kb of each other along the genome; 'cis' therefore refers to the same locus (not necessarily the same allele) regulatory mechanism, which included the antisense-mediated regulation of protein-coding genes by lncRNAs that in the same locus.
The trans-prediction was conducted using a Standalone BLAT v. 35 × 1 fast sequence search command line tool (http://hgdownload.cse.ucsc.edu/admin/exe/) to compare the full sequence of the lncRNA to the 3′-untranslated region of its co-expressed mRNAs using default parameter settings.
Analysis of Gene Ontology (GO) and PANTHER pathways
The functions of biological processes differentially expressed geneswere identified by GO analysis (http://geneontology.org/). The differentially expressed mRNAs were analyzed using PANTHER analysis (http://pantherdb.org/).
Statistical analysis
Data are presented as the means ± SD. Analyses were performed using SPSS version 13.0 (SPSS, Inc.). Unpaired Student's t-test was used to identify differences between two groups. One-way ANOVA followed by the least significant difference test was used to compare multiple groups. Analysis of mRNA, lncRNA and RT-qPCR fold-change data were performed by Student's t-test using Microsoft Excel 15.17 (Microsoft Corporation). P<0.05 was considered to indicate a statistically significant difference.
Results
Oral NaB decreases the AR-related behavioral score and improves nasal mucosal morphology
NaB treatment decreased the behavioral scores of mice with AR (Fig. 2A). In addition, mice fed NaB for 7 weeks did not experience diarrhea or other adverse effects and gained weight normally (Fig. 2B). Epithelial cells of the nasal mucosa in the AR group exhibited loss of cilia, edema of the sub-mucosal tissue, small vessel proliferation, infiltration of eosinophils (Fig. 2C) and exuberant secretion of goblet cells (Fig. 2D). NaB treatment reduced nasal mucosal inflammation in AR mice (Fig. 2C and D). These results indicated that NaB could prevent AR, and that 7 weeks of NaB feeding did not affect mouse growth.
Figure 2.

NaB improves symptoms of allergic rhinitis in a mouse model. (A) In the AR group, the behavioral scores were higher compared with the C group. NaB treatment decreased the behavioral scores in the NaB + AR group compared with those in the AR group, although significant differences in behavioral scores were present between the C and NaB + AR groups. (B) The average bodyweight in the AR group was significantly lower compared with the C and NaB + AR groups. No significant differences were observed between the bodyweights in the C and NaB + AR groups. (C) Hematoxylin and eosin staining of epithelial cells of the nasal mucosa in the AR group revealed loss of cilia, edema of sub-mucosal tissue, proliferation of small vessels and infiltration of eosinophils. (D) Alcian blue staining demonstrated exuberant secretion by goblet cells. The NaB + AR group exhibited less cilia loss, edema of sub-mucosal tissue, proliferation of small vessels, infiltration of eosinophils and secretion of goblet cells compared with the AR group. Data are presented as the mean ± SD. *P<0.05. NaB, sodium butyrate; C, control group; AR, rats treated with ovalbumin; NaB + AR, rats treated with NaB and ovalbumin.
NaB rebalances Th1/Th2/Thl7 and Treg ratios in AR mouse mucosa
Following treatment of AR mice with NaB, serum ELISA demonstrated that the expression of IL-2 (a marker of Th1), IFN-γ (a marker of Th1) and TGF-β1 (a marker of Treg) was higher, whereas the levels of IL-4 (a marker of Th2), IL-5 (a marker of Th2) and IL-17 (a marker of Th17) were lower in the NaB + AR group compared with that in the AR group. These results indicated that NaB could restore Thl/Th2/Thl7 and Treg balance in AR mice (Fig. 3).
Figure 3.

Serum ELISA results of IL-2, IFN-γ, TGF-β1, IL-4, IL-5 and IL-17. The expression levels of IL-2, IFN-γ and TGF-β1 were lower, whereas those of IL-4, IL-5 and IL-17 were higher in the AR group compared with the C group. NaB treatment increased the expression of IL-2, IFN-γ and TGF-β1 and decreased the expression of IL-4, IL-5 and IL-17 compared with the AR group, although significant differences in ELISA results were present between the C and NaB + AR groups. Data are presented as the mean ± SD. *P<0.05. IL, interleukin; INF-γ, interferon γ; TGF-β1, transforming growth factor β1; NaB, sodium butyrate; C, control group; AR, rats treated with ovalbumin; NaB + AR, rats treated with NaB and ovalbumin.
NaB normalizes the AR-induced downregulation of H3-AcK9 and upregulation of HDAC1 and HDAC8 expression in mouse mucosa
NaB partially reversed the downregulation of H3-AcK9 and upregulation of HDAC1 and HDAC8 expression induced by AR in the nasal mucosa of mice (Fig. 4). These results suggested that NaB could restore the HDAC/HAT balance.
Figure 4.

The protein levels of HDAC1, HDAC8 and H3-AcK9 in mouse nasal mucosa detected by western blot analysis. The expression of HDAC1 and HDAC8 increased, whereas that of H3-AcK9 decreased in the AR group compared with the C group. NaB treatment decreased the expression of HDAC1 and HDAC8 and increased the expression of H3-ACK9, although significant differences were still present in the western blot analysis results between the C and NaB + AR groups. Data are presented as the mean ± SD. *P<0.05. HDAC, histone deacetylase; H3-AcK9, histone H3 acetylated at lysine 9; NaB, sodium butyrate; C, control group; AR, rats treated with ovalbumin; NaB + AR, rats treated with NaB and ovalbumin.
Differences in lncRNA and mRNA expression profiles in the nasal mucosa among the three groups
A scatter function was used to identify the differences in lncRNA and mRNA expression (log2 expression value) among the three groups. LncRNA analysis demonstrated that compared with the expression levels in the C group, 254 genes were upregulated and 109 were downregulated in the AR group, and 18 genes were upregulated and 47 were downregulated in the NaB + AR group. Compared with the AR group, 32 genes were upregulated and 230 were downregulated in the NaB + AR group (Fig. 5A). mRNA analysis revealed that compared with the expression levels in the C group, 319 genes were upregulated and 524 were downregulated in the AR group, and 159 genes were upregulated and 218 were downregulated in the NaB + AR group. Compared with the AR group, 114 genes were upregulated and 45 were downregulated in the NaB + AR group (Fig. 5B).
Figure 5.

Transcriptomic analysis of expression differences among the treatment groups. (A) Long non-coding RNA analysis. (B) mRNA analysis. Red indicates upregulated genes; green indicates downregulated genes. C, control group; AR, rats treated with ovalbumin; NaB + AR, rats treated with sodium butyrate and ovalbumin.
LncRNA (NONMMUT057309), lncRNA (NONMMUT016103) (Table I) and 33 mRNAs (Table II) were identified to be co-expressed, and expression trends for these markers were consistent among the C, AR and NaB + AR groups. The 33 mRNAs encoded immunoglobulins, suggesting that lncRNA may regulate the expression of immunoglobulins during AR inflammation.
Table I.
LncRNA (NONMMUT057309) and lncRNA (NONMMUT016103) expression trends among the C, AR, and NaB + AR groups.
| LncRNA | Chr | Gene ID | NaB + AR vs. C
|
NaB + AR vs. AR
|
C vs. AR
|
||||||
|---|---|---|---|---|---|---|---|---|---|---|---|
| P-value | |FC| | Regulation | P-value | |FC| | Regulation | P-value | |FC| | Regulation | |||
| NONMMUT016103 | 12 | NONMMUG0 10108.2 | 0.04 | 3.8545 | Up | 0.04 | 11.5375 | Down | 0.01 | 44.4719 | Up |
| NONMMUT057309 | 6 | NONMMUG0 35579.2 | 0.03 | 2.4944 | Up | 0.04 | 4.9847 | Down | 0.01 | 12.4342 | Up |
LncRNA, long non-coding RNA; chr, chromosome; |FC|, absolute fold-change; C, control group; AR, rats treated with ovalbumin; NaB + AR, rats treated with ovalbumin and sodium butyrate.
Table II.
Co-expressed mRNAs encoding immunoglobulins (n=33) among the C, AR, and NaB + AR groups.
| mRNA | Description | ID |
|---|---|---|
| A_52_P382676 | Immunoglobulin heavy variable 6-6 [Source:MGI Symbol;Acc:MGI:4439619] | ENSMUST00000103489 |
| A_55_P2001269 | Immunoglobulin heavy variable 1-52 [Source:MGI Symbol;Acc:MGI:4439752] | ENSMUST00000103522 |
| A_55_P2046653 | Immunoglobulin heavy variable 2-9 [Source:MGI Symbol;Acc:MGI:4439624] | ENSMUST00000103451 |
| A_55_P2060897 | Immunoglobulin kappa constant [Source:MGI Symbol;Acc:MGI:96495] | ENSMUST00000103410 |
| A_66_P114582 | Immunoglobulin heavy variable V1-54 [Source:MGI Symbol;Acc:MGI:3647133] | ENSMUST00000103525 |
| A_55_P2001274 | Immunoglobulin heavy variable 1-62-3 [Source:MGI Symbol;Acc:MGI:3648544] | ENSMUST00000103532 |
| A_55_P2130497 | Immunoglobulin heavy variable V1-67 [Source:MGI Symbol;Acc:MGI:3645228] | ENSMUST00000103538 |
| A_55_P2030299 | Immunoglobulin heavy variable V14-3 [Source:MGI Symbol;Acc:MGI:4439764] | ENSMUST00000103469 |
| A_55_P1993001 | Immunoglobulin heavy variable 1-55 [Source:MGI Symbol;Acc:MGI:4439716] | ENSMUST00000103526 |
| A_55_P2058621 | Mus musculus clone J558.2 immunoglobulin heavy chain variable region mRNA, partial cds | AF303833 |
| A_52_P15966 | Immunoglobulin heavy variable 1-84 [Source:MGI Symbol;Acc:MGI:3644235] | ENSMUST00000103551 |
| A_65_P07626 | Immunoglobulin kappa variable 3-2 [Source:MGI Symbol;Acc:MGI:1330850] | ENSMUST00000103403 |
| A_55_P2187234 | Immunoglobulin heavy variable 2-2 [Source:MGI Symbol;Acc:MGI:4439894] | ENSMUST00000103443 |
| A_55_P2052913 | Immunoglobulin heavy variable 5-9 [Source:MGI Symbol;Acc:MGI:4439873] | ENSMUST00000103448 |
| A_55_P1979364 | Immunoglobulin heavy variable 1-83 [Source:MGI Symbol;Acc:MGI:3648939] | ENSMUST00000103550 |
| A_55_P2159911 | Immunoglobulin heavy variable 2-3 [Source:MGI Symbol;Acc:MGI:4439872] | ENSMUST00000178229 |
| A_52_P320761 | Immunoglobulin heavy variable 1-31 [Source:MGI Symbol;Acc:MGI:4439889] | ENSMUST00000103511 |
| A_55_P2026268 | Immunoglobulin kappa chain variable 5-43 [Source:MGI Symbol;Acc: MGI:4943320] | ENSMUST00000103368 |
| A_52_P213483 | Immunoglobulin heavy variable 1-77 [Source:MGI Symbol;Acc:MGI:4439670] | ENSMUST00000170551 |
| A_55_P1969901 | Immunoglobulin heavy variable 1-80 [Source:MGI Symbol;Acc:MGI:4439738] | ENSMUST00000103547 |
| A_52_P502849 | Immunoglobulin kappa variable 3-4 [Source:MGI Symbol;Acc:MGI:1330855] | ENSMUST00000103401 |
| A_51_P461067 | Immunoglobulin heavy constant gamma 1 [Source:MGI Symbol;Acc: MGI:96446] | ENSMUST00000103420 |
| A_55_P1970464 | Immunoglobulin heavy variable 1-22 [Source:MGI Symbol;Acc:MGI:4439784] | ENSMUST00000103507 |
| A_55_P2155560 | Immunoglobulin heavy variable V1-5 [Source:MGI Symbol;Acc:MGI:3704121] | ENSMUST00000103494 |
| A_55_P2134277 | Immunoglobulin heavy variable V1-18 [Source:MGI Symbol;Acc:MGI:4439780] | ENSMUST00000103504 |
| A_66_P103232 | Immunoglobulin kappa chain variable 5-45 [Source:MGI Symbol;Acc: MGI:4439774] | ENSMUST00000103366 |
| A_55_P2065506 | Immunoglobulin heavy variable 1-36 [Source:MGI Symbol;Acc:MGI:4439639] | ENSMUST00000103513 |
| A_55_P2129334 | Mus musculus clone L2MZB-13.3 immunoglobulin heavy chain variable region mRNA, partial cds | AY171990 |
| A_55_P2138627 | Immunoglobulin heavy variable 6-3 [Source:MGI Symbol;Acc:MGI:4439854] | ENSMUST00000103486 |
| A_55_P2164784 | Immunoglobulin heavy variable 2-5 [Source:MGI Symbol;-Acc:MGI:4439517] | ENSMUST00000103449 |
| A_66_P104923 | Immunoglobulin heavy variable 1-81 [Source:MGI Symbol;Acc:MGI:4439635] | ENSMUST00000103548 |
| A_51_P390937 | Immunoglobulin kappa variable 14-111 [Source:MGI Symbol;Acc:MGI:4439863] | ENSMUST00000103320 |
| A_55_P2187235 | Immunoglobulin heavy variable 2-2 [Source:MGI Symbol;Acc:MGI:4439894] | ENSMUST00000103443 |
MGI is the international database resource for the laboratory mouse, providing integrated genetic, genomic, and biological data to facilitate the study of human health and disease. C, control group; AR, rats treated with ovalbumin; NaB + AR, rats treated with both ovalbumin and sodium butyrate.
RT-qPCR validation of microarray data
Statistically significant differences were identified at four mRNA (A-65-P07626, A-52-P50284, A-66-P10323 and A-55-P21872) and two lncRNA (NONMMUT016103 and NONMMUT057309) loci between C vs. AR, NaB + AR vs. AR and NaB + AR vs. C groups in the microarray results. RT-qPCR validation results in the three groups were consistent with the micro-array analysis results, with the exception of the lncRNA (NUNMMUT016103) locus (Fig. 6).
Figure 6.

Comparison of lncRNA and mRNA fold-change measured by microarray and RT-qPCR. RT-qPCR validation results among the three groups were consistent with the microarray analysis results, with the exception of the lncRNA (NUNMMUT016103) locus. Microarray results are represented by blue bars; RT-qPCR results are represented by red bars. *P<0.05, **P<0.01. LncRNA, long non-coding RNA; RT-qPCR, reverse transcription-quantitative PCR; C, control group; AR, rats treated with ovalbumin; NaB + AR, rats treated with sodium butyrate and ovalbumin.
LncRNA (NONMMUT057309)-mRNA co-expression analysis
LncRNA (NONMMUT057309) co-expression analysis of mRNA (data not shown) and target gene prediction (Fig. 7) revealed that only three target genes of lncRNA (NONMMUT057309) [octamer-binding transcription factor 1 (Oct-1), ecotropic viral integration site 1 (Evi-1) and paired box 4 (Pax-4)] were predicted between NaB + AR vs. AR, NaB + AR vs. C and AR vs. C groups.
Figure 7.
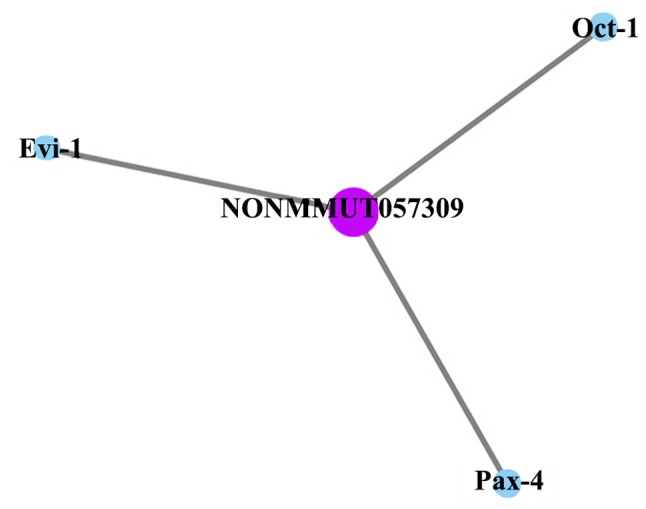
LncRNA (NONMMUT057309) target gene prediction. Oct-1, Evi-1, and Pax-4 were predicted between NaB+AR vs. AR, NaB + AR vs. C and AR vs. C groups of lncRNA (NONMMUT057309). LncRNA, long non-coding RNA; Oct-1, octamer-binding transcription factor 1; Evi-1, ecotropic viral integration site 1; Pax-4, paired box 4.
GO and PANTHER pathway analyses
GO analysis was conducted to determine the enrichment of the differentially expressed mRNAs between the different groups in the categories of biological processes. The top 10 significantly enriched GO terms between each pair of groups are presented in Fig. 8.
Figure 8.

Top 10 significantly enriched GO terms in each of the compared groups. GO, Gene Ontology; C, control group; AR, rats treated with ovalbumin; NaB + AR, rats treated with sodium butyrate and ovalbumin.
Pathway analysis was conducted to determine the biological pathways represented by the significantly differentially expressed mRNAs between the groups. The top 10 significantly enriched PANTHER pathway terms among the three groups are presented in Fig. 9. Based on these results, inflammation mediated by chemokine and cytokine signaling pathways and T-cell activation were suggested to be involved in AR pathogenesis.
Figure 9.

Top 10 significantly enriched PANTHER pathways in each of the compared groups. C, control group; AR, rats treated with ovalbumin; NaB + AR, rats treated with sodium butyrate and ovalbumin.
Discussion
HDAC inhibitors can be divided into four categories, including hydroxamates, cyclic peptides, aliphatic acids and benzamides. Suberoylanilide hydroxamic acid (SAHA) has been approved by the US Food and Drug Administration for the treatment of cutaneous T-cell lymphoma (7). HDAC inhibitors have also been demonstrated to exhibit therapeutic effects in cancer, arthritis, hearing loss and asthma (23-27). Since epigenetic modifications, which contribute to disease development, are neither permanent nor transient, identifying disease-specific epigenetic alterations may help identify novel therapeutic interventions (28,29). NaB can be dissolved without dimethyl sulfoxide, which is a solvent that also inhibits HDAC, thus enabling the sole evaluation of NaB and its effects (30,31). The results of our previous study demonstrated that NaB exhibited a therapeutic effect in an OVA-induced murine AR model when administered intranasally (16). The present study demonstrated that oral NaB for 7 weeks did not result in any adverse effects, and animals gained weight normally. In addition, a previous study revealed that NaB enhanced intestinal integrity in weaned pigs (32). Adding NaB increased the food intake of lactating sows and improved the growth of piglets (33). In the present study, NaB prophylactically reduced AR-related behavioral scores, improved nasal mucosal morphology and restored Th1/Th2/Thl7 and Treg cell balance. Thus, NaB may exhibit a preventive effect on AR. The present study demonstrated that NaB increased H3-AcK9 expression and decreased of HDAC1 and HDAC8 expression in mice with AR. Accordingly, high HDAC1 and HDAC8 expression levels have been observed in OVA-sensitized asthmatic mice (11). In addition, an HDAC8-specific inhibitor was demonstrated to reduce the eosinophil-mediated inflammatory response and reduce the sensitivity of the airway in an asthma model (34). Therefore, blocking HDAC activity may be a novel therapeutic target in patients with AR (7).
LncRNA regulates gene expression at the transcriptional, RNA processing and translational levels (35). In addition, lncRNA dysregulation underlies certain human diseases caused by chromosome deletion and translocation (36). LncRNAs are also involved in the development, plasticity, disease and evolution of the mammalian nervous system (37). LncRNAs can promote the differentiation and activation of dendritic cells, B lymphocytes and T lymphocytes (38). Accordingly, a number of specific lncRNAs have been identified in Th1 and Th2 cells (39-42) and in the nasal mucosa of mice with AR (3). The results of the present study confirmed the differential expression of lncRNAs and mRNAs in the nasal mucosa of AR mice treated with NaB. A degree is the simplest and most important measure of gene centrality within a network that determines the relative importance of that gene (43). LncRNA (NONMMUT057309), which is 306 nt long and located on chromosome 6, is mainly expressed in the hippo-campus, liver, and lung (44); however, to the best of our knowledge, no published studies on the mechanism associated with its function are currently available.
NaB, a pan-HDAC inhibitor, not only decreased the expression of HDAC1 and HDAC8, but also downregulated the expression of lncRNA (NONMMUT057309) and altered the expression of immunoglobulins in the present study. Previous studies have demonstrated that HDAC and lnc-H19 could be bidirectionally regulated (45), and the pan-HDAC inhibitors panobinostat and SAHA upregulated lnc-GAS5 expression in non-small cell lung cancer (46). Thus, it may be speculated that NaB could influence the nasal mucosa allergic response through lncRNA (NONMMUT057309) expression. LncRNA (NONMMUT057309) may act on its target genes to regulate the expression of immunoglobulin in the nasal mucosa to prevent AR.
Three target genes (Oct-1, Evi-1 and Pax-4) were predicted for lncRNA (NONMMUT057309). Oct-1 can co-regulate Th2 cytokine gene expression through Rhs-related transmembrane protein (47) and regulate the expression of IL-17 (48). Evi-1 participates in the pathogenesis of colorectal cancer through TGF-β signaling (49). The duodenum of functional dyspepsia rats displayed increased expressions of PAX4 (50).
Among the top 10 significantly enriched GO terms in C vs. AR groups, 'extracellular matrix organization' has been determined to exert effects on airway epithelial cells and fibroblast structure (51). The regulation of the immune system in early life by the microbiota may be associated with allergy development (52). The pathology of bronchial asthma demonstrates a multicellular process (53). AR rats exhibit microvascular remodeling of the nasal mucosa (54). In the top 10 significantly enriched GO terms in NaB + AR vs. AR groups, salmon cartilage proteoglycan attenuates allergic responses in mice (55). Inhibiting platelet activating factor can treat AR (56). Among top 10 significantly enriched GO terms in NaB+AR vs. C groups, immunoglobulin E (lgε) receptor on lymphocyte γ chain can mediate the receptor activator for NF-κB ligand, which is the primary cytokine required for osteoclastogenesis (57). ROS likely originates from inflammatory cells (eosinophils, neutrophils and macrophages), and their deleterious activity can result in oxidative DNA damage (58). Maternal exposure to any type of stressor is associated with an increased risk of an atopic offspring (59). There are important connections between hemopoiesis and allergy/asthma (60). Immunotherapy decreases antigen-induced eosinophil cell migration into the nasal cavity (61). In patients with asthma, serum endotoxin concentrations significantly correlate with sputum chemokine motif ligand 2 concentrations (62).
The present study also determined the top 10 PANTHER pathways represented by the differentially expressed genes. 'T-cell activation', 'B cell activation', 'Interleukin signaling pathway', 'Inflammation mediated by chemokine and cytokine signaling pathway' and 'Histamine H2 receptor mediated signaling pathway' participate in allergic inflammation (4,63-64). 'Apoptosis signaling pathway' (65) and 'Toll receptor signaling pathway' (66) are also involved in the pathology of AR. The expression of endotherin 2 is increased in cigarette-exposed asthmatic mice (67). Heme oxygenase-1 protects airway epithelium against apoptosis by targeting the proinflammatory NLRP3-RXR axis in asthma (68). Fibroblast-specific integrin-α V differentially regulates type 17 and type 2 driven inflammation and fibrosis (69). The p38 MAP-kinase pathway is involved in the production of chloride voltage-gated channel 3 in nasal epithelial AR cells induced by IL-4 (70). The Wnt signaling pathway has also been demonstrated to be differentially regulated in patients with AR (71). TGF-β/Smad signaling is involved in allergic diseases (72-74). At present, to the best of our knowledge, no reports are available on the gonadotropin-releasing hormone receptor, succinate to proportionate conversion or angiotensin H-stimulated signaling through G proteins and β-arrestin involvement in allergic inflammation pathogenesis, which is worth further study.
Together, previous findings along with the results of the present study may provide new options for the treatment of AR. However, in the present study, the gene sample was small, and further in vitro experiments are needed to further verify the role of lncRNA (NONMMUT057309), as well as the target genes (Oct-1, Evi-1, Pax-4) and signaling pathways, in the prevention of AR in the nasal mucosa of NaB-treated mice.
Supplementary Data
Acknowledgments
Not applicable.
Funding
This study was supported by the National Natural Science Foundation of China (grant nos. 81670925 and 81271069), Shaanxi Health Research Fund (grant no. 2018D006), Xi'an Health and Family Planning Commission Fund (grant no. J201902034) and Shaanxi Natural Science Foundation (grant no. 2019JQ-434).
Availability of data and materials
The datasets used and/or analyzed during the present study are available from the corresponding author on reasonable request.
Authors' contributions
JW produced the animal model and was a major contributor in writing the manuscript. CM analyzed the gene data. SF performed the histological examination and western blotting. FC and JQ helped with the design, implementation, and revision of important contents of the experiments. The corresponding authors contributed equally to this work. All authors read and approved the final manuscript.
Ethics approval and consent to participate
All animal experiments were conducted in accordance with the National Institutes of Health guidelines and approved by the Committee on Animal Research of the Air Force Military Medical University.
Patient consent for publication
Not applicable.
Competing interests
The authors declare that they have no competing interests.
References
- 1.Seidman MD, Gurgel RK, Lin SY, Schwartz SR, Baroody FM, Bonner JR, Dawson DE, Dykewicz MS, Hackell JM, Han JK, et al. Clinical practice guideline: Allergic rhinitis executive summary. Otolarygol Head Neck Surg. 2015;152:197–206. doi: 10.1177/0194599814562166. [DOI] [PubMed] [Google Scholar]
- 2.Zhang L, Han D, Huang D, Wu Y, Dong Z, Xu G, Kong W, Bachert C. Prevalence of self-reported allergic rhinitis in eleven major cities in china. Int Arch Allergy Immunol. 2009;149:47–57. doi: 10.1159/000176306. [DOI] [PubMed] [Google Scholar]
- 3.Wang XD, Zheng M, Lou HF, Wang CS, Zhang Y, Bo MY, Ge SQ, Zhang N, Zhang L, Bachert C. An increased prevalence of self-reported allergic rhinitis in major Chinese cities from 2005 to 2011. Allergy. 2016;71:1170–1180. doi: 10.1111/all.12874. [DOI] [PMC free article] [PubMed] [Google Scholar]
- 4.Cheng L, Chen J, Fu Q, He S, Li H, Liu Z, Tan G, Tao Z, Wang D, Wen W, et al. Chinese Society of Allergy guidelines for diagnosis and treatment of allergic rhinitis. Allergy Asthma Immunol Res. 2018;10:300–353. doi: 10.4168/aair.2018.10.4.300. [DOI] [PMC free article] [PubMed] [Google Scholar]
- 5.Eifan AO, Durham SR. Pathogenesis of rhinitis. Clin Exp Allergy. 2016;46:1139–1151. doi: 10.1111/cea.12780. [DOI] [PubMed] [Google Scholar]
- 6.Milner JD. IL-17 producing cells in host defense and atopy. Curr Opin Immunol. 2011;23:784–788. doi: 10.1016/j.coi.2011.09.006. [DOI] [PubMed] [Google Scholar]
- 7.Steelant B, Wawrzyniak P, Martens K, Jonckheere AC, Pugin B, Schrijvers R, Bullens DM, Vanoirbeek JA, Krawczyk K, Dreher A, et al. Blocking histone deacetylase activity as a novel target for epithelial barrier defects in patients with allergic rhinitis. J Allergy Clin Immunol. 2019;144:1242.e7–1253.e7. doi: 10.1016/j.jaci.2019.04.027. [DOI] [PubMed] [Google Scholar]
- 8.Liu J, Livingston MJ, Dong G, Tang C, Su Y, Wu G, Yin XM, Dong Z. Histone deacetylase inhibitors protect against cisplatin-induced acute kidney injury by activating autophagy in proximal tubular cells. Cell Death Dis. 2018;9:322. doi: 10.1038/s41419-018-0374-7. [DOI] [PMC free article] [PubMed] [Google Scholar]
- 9.Escobar J, Pereda J, Arduini A, Sandoval J, Sabater L, Aparisi L, Vento M, López-Rodas G, Sastre J. Role of redox signaling, protein phosphatases and histone acetylation in the inflammatory cascade in acute pancreatitis. Therapeutic implications Inflamm Allergy Drug Targets. 2010;9:97–108. doi: 10.2174/187152810791292773. [DOI] [PubMed] [Google Scholar]
- 10.Yang G, Cheng BH, Yang SB, Liu ZQ, Qiu SQ, Yang LT, Xie RD, Geng XR, Li MG, Gao L, et al. Targeting histone-acetyltransferase Tat-interactive protein 60 inhibits intestinal allergy. Allergy. 2018;73:387–394. doi: 10.1111/all.13304. [DOI] [PubMed] [Google Scholar]
- 11.Su XM, Ren Y, Li ML, Zhao X, Kong LF, Kang J. Performance evaluation of histone deacetylases in lungs of mice exposed to ovalbumin aerosols. J Physiol Pharmacol. 2018;69 doi: 10.26402/jpp.2018.2.12. [DOI] [PubMed] [Google Scholar]
- 12.Shao JB, Luo XQ, Wu YJ, Li MG, Hong JY, Mo LH, Liu ZG, Li HB, Liu DB, Yang PC. Histone deacetylase 11 inhibits interleukin 10 in B cells of subjects with allergic rhinitis. Int Forum Allergy Rhinol. 2018;8:1274–1283. doi: 10.1002/alr.22171. [DOI] [PubMed] [Google Scholar]
- 13.Jiang J, Liu JQ, Li J, Li M, Chen HB, Yan H, Mo LH, Qiu SQ, Liu ZG, Yang PC. Trek1 contributes to maintaining nasal epithelial barrier integrity. Sci Rep. 2015;5:9191. doi: 10.1038/srep09191. [DOI] [PMC free article] [PubMed] [Google Scholar]
- 14.Wang C, Li H, Cao L, Wang G. Identification of differentially expressed genes associated with asthma in children based on the bioanalysis of the regulatory network. Mol Med Rep. 2018;18:2153–2163. doi: 10.3892/mmr.2018.9205. [DOI] [PMC free article] [PubMed] [Google Scholar]
- 15.Wang J, Wang Y, Chen X, Zhang PZ, Shi ZT, Wen LT, Qiu JH, Chen FQ. Histone deacetylase inhibitor sodium butyrate attenuates gentamicin-induced hearing loss in vivo. Am J Otolaryngol. 2015;36:242–248. doi: 10.1016/j.amjoto.2014.11.003. [DOI] [PubMed] [Google Scholar]
- 16.Wang J, Wen L, Wang Y, Chen F. Therapeutic effect of histone deacetylase inhibitor, sodium butyrate, on allergic rhinitis in vivo. DNA Cell Biol. 2016;35:203–208. doi: 10.1089/dna.2015.3037. [DOI] [PubMed] [Google Scholar]
- 17.Cerf-Bensussan N, Gaboriau-Routhiau V. The immune system and the gut microbiota: Friends or foes? Nat Rev Immunol. 2010;10:735–744. doi: 10.1038/nri2850. [DOI] [PubMed] [Google Scholar]
- 18.Song H, Yoo Y, Hwang J, Na YC, Kim HS. Faecalibacterium prausnitzii subspecies-level dysbiosis in the human gut micro-biome underlying atopic dermatitis. J Allergy Clin Immunol. 2016;137:852–860. doi: 10.1016/j.jaci.2015.08.021. [DOI] [PubMed] [Google Scholar]
- 19.Val-Laillet D, Guérin S, Coquery N, Nogret I, Formal M, Romé V, Le Normand L, Meurice P, Randuineau G, Guilloteau P, et al. Oral sodium butyrate impacts brain metabolism and hippocampal neurogenesis, with limited effects on gut anatomy and function in pigs. FASEB J. 2018;32:2160–2171. doi: 10.1096/fj.201700547RR. [DOI] [PubMed] [Google Scholar]
- 20.Lee C, Kim BG, Kim JH, Chun J, Im JP, Kim JS. Sodium butyrate inhibits the NF-kappa B signaling pathway and histone deacetylation, and attenuates experimental colitis in an IL-10 independent manner. Int Immunopharmacol. 2017;51:47–56. doi: 10.1016/j.intimp.2017.07.023. [DOI] [PubMed] [Google Scholar]
- 21.Wang W, Zhu Z, Zhu B, Ma Z. Peroxisome proliferator-activated receptor-gamma agonist induces regulatory T cells in a murine model of allergic rhinitis. Otolaryngol Head Neck Surg. 2011;144:506–513. doi: 10.1177/0194599810396133. [DOI] [PubMed] [Google Scholar]
- 22.Li L, Wang L, Li H, Han X, Chen S, Yang B, Hu Z, Zhu H, Cai C, Chen J, et al. Characterization of LncRNA expression profile and identification of novel LncRNA biomarkers to diagnose coronary artery disease. Atherosclerosis. 2018;275:359–367. doi: 10.1016/j.atherosclerosis.2018.06.866. [DOI] [PubMed] [Google Scholar]
- 23.Bian X, Liang Z, Feng A, Salgado E, Shim H. HDAC inhibitor suppresses proliferation and invasion of breast cancer cells through regulation of miR-200c targeting CRKL. Biochem Pharmacol. 2018;147:30–37. doi: 10.1016/j.bcp.2017.11.008. [DOI] [PMC free article] [PubMed] [Google Scholar]
- 24.Licciardi PV, Ververis K, Tang ML, El-Osta A, Karagiannis TC. Immunomodulatory effects of histone deacetylase inhibitors. Curr Mol Med. 2013;13:640–647. doi: 10.2174/1566524011313040013. [DOI] [PubMed] [Google Scholar]
- 25.Yang DH, Xie J, Liu K, Peng Z, Guo JY, Yu SK, Wang GP, Gong SS. The histone deacetylase inhibitor sodium butyrate protects against noise-induced hearing loss in Guinea pigs. Neurosci Lett. 2017;660:140–146. doi: 10.1016/j.neulet.2017.09.036. [DOI] [PubMed] [Google Scholar]
- 26.Toki S, Goleniewska K, Reiss S, Zhou W, Newcomb DC, Bloodworth MH, Stier MT, Boyd KL, Polosukhin VV, Subramaniam S, Peebles RS., Jr The histone deacetylase inhibitor trichostatin A suppresses murine innate allergic inflammation by blocking group 2 innate lymphoid cell (ILC2) activation. Thorax. 2016;71:633–645. doi: 10.1136/thoraxjnl-2015-207728. [DOI] [PMC free article] [PubMed] [Google Scholar]
- 27.Wawrzyniak P, Wawrzyniak M, Wanke K, Sokolowska M, Bendelja K, Rückert B, Globinska A, Jakiela B, Kast JI, Idzko M, et al. Regulation of bronchial epithelial barrier integrity by type 2 cytokines and histone deacetylases in asthmatic patients. J Allergy Clin Immunol. 2017;139:93–103. doi: 10.1016/j.jaci.2016.03.050. [DOI] [PubMed] [Google Scholar]
- 28.Comer BS, Ba M, Singer CA, Gerthoffer WT. Epigenetic targets for novel therapies of lung diseases. Pharmacol Ther. 2015;147:91–110. doi: 10.1016/j.pharmthera.2014.11.006. [DOI] [PMC free article] [PubMed] [Google Scholar]
- 29.Wouters BJ, Delwel R. Epigenetics and approaches to targeted epigenetic therapy in acute myeloid leukemia. Blood. 2016;127:42–52. doi: 10.1182/blood-2015-07-604512. [DOI] [PubMed] [Google Scholar]
- 30.Marks PA, Breslow R. Dimethyl sulfoxide to vorinostat: Development of this histone deacetylase inhibitor as an anticancer drug. Nat Biotechnol. 2007;25:84–90. doi: 10.1038/nbt1272. [DOI] [PubMed] [Google Scholar]
- 31.Thaler R, Spitzer S, Karlic H, Klaushofer K, Varga F. DMSO is a strong inducer of DNA hydroxymethylation in preosteo-blastic MC3T3-E1 cells. Epigenetics. 2012;7:635–651. doi: 10.4161/epi.20163. [DOI] [PMC free article] [PubMed] [Google Scholar]
- 32.Wang CC, Wu H, Lin FH, Gong R, Xie F, Peng Y, Feng J, Hu CH. Sodium butyrate enhances intestinal integrity, inhibits mast cell activation, inflammatory mediator production and JNK signaling pathway in weaned pigs. Innate Immun. 2018;24:40–46. doi: 10.1177/1753425917741970. [DOI] [PMC free article] [PubMed] [Google Scholar]
- 33.Wang J, Yang M, Xu S, Lin Y, Che L, Fang Z, Wu D. Comparative effects of sodium butyrate and flavors on feed intake of lactating sows and growth performance of piglets. Anim Sci J. 2014;85:683–689. doi: 10.1111/asj.12193. [DOI] [PubMed] [Google Scholar]
- 34.Ren Y, Su X, Kong L, Li M, Zhao X, Yu N, Kang J. Therapeutic effects of histone deacetylase inhibitors in a murine asthma model. Inflamm Res. 2016;65:995–1008. doi: 10.1007/s00011-016-0984-4. [DOI] [PMC free article] [PubMed] [Google Scholar]
- 35.Cech TR, Steitz JA. The noncoding RNA revolution-trashing old rules to forge new ones. Cell. 2014;157:77–94. doi: 10.1016/j.cell.2014.03.008. [DOI] [PubMed] [Google Scholar]
- 36.Batista PJ, Chang HY. Long noncoding RNAs: Cellular address codes in development and disease. Cell. 2013;152:1298–1307. doi: 10.1016/j.cell.2013.02.012. [DOI] [PMC free article] [PubMed] [Google Scholar]
- 37.Briggs JA, Wolvetang EJ, Mattick JS, Rinn JL, Barry G. Mechanisms of long non-coding RNAs in mammalian nervous system development, plasticity, disease, and evolution. Neuron. 2015;88:861–877. doi: 10.1016/j.neuron.2015.09.045. [DOI] [PubMed] [Google Scholar]
- 38.Aune TM, Spurlock CF., III Long non-coding RNAs in innate and adaptive immunity. Virus Res. 2016;212:146–160. doi: 10.1016/j.virusres.2015.07.003. [DOI] [PMC free article] [PubMed] [Google Scholar]
- 39.Collier SP, Collins PL, Williams CL, Boothby MR, Aune TM. Cutting edge: Influence of Tmevpg1, a long intergenic noncoding RNA, on the expression of Ifng by Th1 cells. J Immunol. 2012;189:2084–2088. doi: 10.4049/jimmunol.1200774. [DOI] [PMC free article] [PubMed] [Google Scholar]
- 40.Gomez JA, Wapinski OL, Yang YW, Bureau JF, Gopinath S, Monack DM, Chang HY, Brahic M, Kirkegaard K. The NeST long ncRNA controls microbial susceptibility and epigenetic activation of the interferon-γ locus. Cell. 2013;152:743–754. doi: 10.1016/j.cell.2013.01.015. [DOI] [PMC free article] [PubMed] [Google Scholar]
- 41.Spurlock CF, III, Tossberg JT, Guo Y, Collier SP, Crooke PS, III, Aune TM. Expression and functions of long noncoding RNAs during human T helper cell differentiation. Nat Commun. 2015;6:6932. doi: 10.1038/ncomms7932. [DOI] [PMC free article] [PubMed] [Google Scholar]
- 42.Zhang H, Nestor CE, Zhao S, Lentini A, Bohle B, Benson M, Wang H. Profiling of human CD4+ T-cell subsets identifies the TH2-specific noncoding RNA GATA3-AS1. J Allergy Clin Immunol. 2013;132:1005–1008. doi: 10.1016/j.jaci.2013.05.033. [DOI] [PubMed] [Google Scholar]
- 43.Hohmann S. UNICELLSYS-Understanding the cell's functional organization. J Biotechnol. 2010;150:S545. doi: 10.1016/j.jbiotec.2010.09.902. [DOI] [Google Scholar]
- 44.Bu D, Luo H, Jiao F, Fang S, Tan C, Liu Z, Zhao Y. Evolutionary annotation of conserved long non-coding RNAs in major mammalian species. Sci China Life Sci. 2015;58:787–798. doi: 10.1007/s11427-015-4881-9. [DOI] [PubMed] [Google Scholar]
- 45.Huang Y, Zhang Y, Jin C, Li X, Jia L, Li W. Long non-coding RNA H19 inhibits adipocyte differentiation of bone marrow mesenchymal stem cells through epigenetic modulation of histone deacetylases. Sci Rep. 2016;6:28897. doi: 10.1038/srep28897. [DOI] [PMC free article] [PubMed] [Google Scholar]
- 46.Keenan CR, Schuliga MJ, Stewart AG. Pro-inflammatory mediators increase levels of the noncoding RNA GAS5 in airway smooth muscle and epithelial cells. Can J Physiol Pharmacol. 2015;93:203–207. doi: 10.1139/cjpp-2014-0391. [DOI] [PubMed] [Google Scholar]
- 47.Kim K, Kim N, Lee GR. Transcription factors Oct-1 and GATA-3 cooperatively regulate Th2 cytokine gene expression via the RHS5 within the Th2 locus control region. PLoS One. 2016;11:e0148576. doi: 10.1371/journal.pone.0148576. [DOI] [PMC free article] [PubMed] [Google Scholar]
- 48.Kim LK, Esplugues E, Zorca CE, Parisi F, Kluger Y, Kim TH, Galjart NJ, Flavell RA. Oct-1 regulates IL-17 expression by directing interchromosomal associations in conjunction with CTCF in T cells. Mol Cell. 2014;54:56–66. doi: 10.1016/j.molcel.2014.02.004. [DOI] [PMC free article] [PubMed] [Google Scholar]
- 49.Deng X, Cao Y, Liu Y, Li F, Sambandam K, Rajaraman S, Perkins AS, Fields AP, Hellmich MR, Townsend CM, Jr, et al. Overexpression of Evi-1 oncoprotein represses TGF-β signaling in colorectal cancer. Mol Carcinog. 2013;52:255–264. doi: 10.1002/mc.21852. [DOI] [PMC free article] [PubMed] [Google Scholar]
- 50.Zhao J, Zhao L, Zhang S, Zhu C. Modified Liu-Jun-Zi decoction alleviates visceral hypersensitivity in functional dyspepsia by regulating EC cell-5HT3r signaling in duodenum. J Ethnopharmacol. 2020;250:112468. doi: 10.1016/j.jep.2019.112468. [DOI] [PubMed] [Google Scholar]
- 51.Royce SG, Tan L, Koek AA, Tang ML. Effect of extracellular matrix composition on airway epithelial cell and fibroblast structure: Implications for airway remodeling in asthma. Ann Allergy Asthma Immunol. 2009;102:238–246. doi: 10.1016/S1081-1206(10)60087-7. [DOI] [PubMed] [Google Scholar]
- 52.Gensollen T, Blumberg RS. Correlation between early-life regulation of the immune system by microbiota and allergy development. J Allergy Clin Immunol. 2017;139:1084–1091. doi: 10.1016/j.jaci.2017.02.011. [DOI] [PMC free article] [PubMed] [Google Scholar]
- 53.Sharma N, Akkoyunlu M, Rabin RL. Macrophages-common culprit in obesity and asthma. Allergy. 2018;73:1196–1205. doi: 10.1111/all.13369. [DOI] [PubMed] [Google Scholar]
- 54.Liu JG, Wang MQ, Zhu XH, Liu YH, Cai JY. Microvascular remodeling of nasal mucosa in allergic rhinitis induced by an allergen in Sprague-Dawley rats. Genet Mol Res. 2015;14:11624–11630. doi: 10.4238/2015.September.28.14. [DOI] [PubMed] [Google Scholar]
- 55.Ono HK, Yoshimura S, Hirose S, Narita K, Tsuboi M, Asano K, Nakane A. Salmon cartilage proteoglycan attenuates allergic responses in mouse model of papain-induced respiratory inflammation. Mol Med Rep. 2018;18:4058–4064. doi: 10.3892/mmr.2018.9364. [DOI] [PubMed] [Google Scholar]
- 56.Muñoz-Cano RM, Casas-Saucedo R, Valero Santiago A, Bobolea I, Ribó P, Mullol J. Platelet-activating factor (PAF) in allergic rhinitis: Clinical and therapeutic implications. J Clin Med. 2019;8 doi: 10.3390/jcm8091338. [DOI] [PMC free article] [PubMed] [Google Scholar]
- 57.Humphrey MB, Nakamura MC. A comprehensive review of immunoreceptor regulation of osteoclasts. Clin Rev Allergy Immunol. 2016;51:48–58. doi: 10.1007/s12016-015-8521-8. [DOI] [PMC free article] [PubMed] [Google Scholar]
- 58.de Groot LES, Sabogal Piñeros YS, Bal SM, van de Pol MA, Hamann J, Sterk PJ, Kulik W, Lutter R. Do eosinophils contribute to oxidative stress in mild asthma? Clin Exp Allergy. 2019;49:929–931. doi: 10.1111/cea.13389. [DOI] [PMC free article] [PubMed] [Google Scholar]
- 59.Flanigan C, Sheikh A, DunnGalvin A, Brew BK, Almqvist C, Nwaru BI. Prenatal maternal psychosocial stress and offspring's asthma and allergic disease: A systematic review and meta-analysis. Clin Exp Allergy. 2018;48:403–414. doi: 10.1111/cea.13091. [DOI] [PubMed] [Google Scholar]
- 60.Elsas P. Hemopoiesis and allergy, an introduction to the special issue. Curr Drug Targets Inflamm Allergy. 2003;2:267–270. doi: 10.2174/1568010033484070. [DOI] [Google Scholar]
- 61.Furin MJ, Norman PS, Creticos PS, Proud D, Kagey-Sobotka A, Lichtenstein LM, Naclerio RM. Immunotherapy decreases antigen-induced eosinophil cell migration into the nasal cavity. J Allergy Clin Immunol. 1991;88:27–32. doi: 10.1016/0091-6749(91)90297-2. [DOI] [PubMed] [Google Scholar]
- 62.McSharry C, Spears M, Chaudhuri R, Cameron EJ, Husi H, Thomson NC. Increased sputum endotoxin levels are associated with an impaired lung function response to oral steroids in asthmatic patients. J Allergy Clin Immunol. 2014;134:1068–1075. doi: 10.1016/j.jaci.2014.08.022. [DOI] [PubMed] [Google Scholar]
- 63.Bui TT, Piao CH, Hyeon E, Fan Y, Choi DW, Jung SY, Jang BH, Shin HS, Song CH, Chai OH. Preventive effect of Bupleurum chinense on nasal inflammation via suppressing T helper type 2, Eosinophil and mast cell activation. Am J Chin Med. 2019;47:405–421. doi: 10.1142/S0192415X19500204. [DOI] [PubMed] [Google Scholar]
- 64.Chen Q, Ba YP, Zhou MH, Li SD, Zhang PW. CD23 on B cells determines Breg-facilitated IL-10 secretion as well as activation of T cells. Lin Chung Er Bi Yan Hou Tou Jing Wai Ke Za Zhi. 2018;32:931–937. doi: 10.13201/j.issn.1001-1781.2018.12.012. In Chinese. [DOI] [PubMed] [Google Scholar]
- 65.Ciebiada M, Kasztalska K, Gorska-Ciebiada M, Górski P. Histamine type 2 receptor expression on peripheral blood regulatory lymphocytes in patients with allergic rhinitis treated with specific immunotherapy. Am J Rhinol Allergy. 2014;28:e130-e135. doi: 10.2500/ajra.2014.28.4048. [DOI] [PubMed] [Google Scholar]
- 66.Wang Z, Tan F. The blockade of PD-1/PD-L1 pathway promotes the apoptosis of CD19+ CD25+ Bregs and suppresses the secretion of IL-10 in patients with allergic rhinitis. Scand J Immunol. 2020;91:e12836. doi: 10.1111/sji.12836. [DOI] [PubMed] [Google Scholar]
- 67.Golshiri-Isfahani A, Amizadeh M, Arababadi MK. The roles of toll like receptor 3, 7 and 8 in allergic rhinitis pathogenesis. Allergol Immunopathol (Madr) 2018;46:503–507. doi: 10.1016/j.aller.2017.09.026. [DOI] [PubMed] [Google Scholar]
- 68.Han F, Zhu S, Chen B, Li J. Elevated expression of endothelin 2 in lung tissues of asthmatic rats after exposed to cigarette smoke and its mechanism. Xi Bao Yu Fen Zi Mian Yi Xue Za Zhi. 2017;33:1030–1034. In Chinese. [PubMed] [Google Scholar]
- 69.Lv J, Su W, Yu Q, Zhang M, Di C, Lin X, Wu M, Xia Z. Heme oxygenase-1 protects airway epithelium against apoptosis by targeting the proinflammatory NLRP3-RXR axis in asthma. J Biol Chem. 2018;293:18454–18465. doi: 10.1074/jbc.RA118.004950. [DOI] [PMC free article] [PubMed] [Google Scholar]
- 70.Sciurba JC, Gieseck RL, Jiwrajka N, White SD, Karmele EP, Redes J, Vannella KM, Henderson NC, Wynn TA, Hart KM. Fibroblast-specific integrin-alpha V differentially regulates type 17 and type 2 driven inflammation and fibrosis. J Pathol. 2019;248:16–29. doi: 10.1002/path.5215. [DOI] [PubMed] [Google Scholar]
- 71.Han D, Zhou B, Cheng L, Oh Y, Li H. P38 MAP-kinase pathway is involved in the production of CLC-3 in nasal epithelial cells with allergic rhinitis induced by interleukin-4. Laryngoscope. 2006;116:1973–1977. doi: 10.1097/01.mlg.0000236078.81313.c8. [DOI] [PubMed] [Google Scholar]
- 72.Tirado-Rodriguez B, Ortega E, Segura-Medina P, Huerta-Yepez S. TGF-β: An important mediator of allergic disease and a molecule with dual activity in cancer development. J Immunol Res. 2014;2014:318481. doi: 10.1155/2014/318481. [DOI] [PMC free article] [PubMed] [Google Scholar]
- 73.Gregory LG, Mathie SA, Walker SA, Pegorier S, Jones CP, Lloyd CM. Overexpression of Smad2 drives house dust mite-mediated airway remodeling and airway hyperresponsiveness via activin and IL-25. Am J Respir Crit Care Med. 2010;182:143–154. doi: 10.1164/rccm.200905-0725OC. [DOI] [PMC free article] [PubMed] [Google Scholar]
- 74.Luo X, Ding Q, Wang M, Li Z, Mao K, Sun B, Pan Y, Wang Z, Zang YQ, Chen Y. In vivo disruption of TGF-beta signaling by Smad7 in airway epithelium alleviates allergic asthma but aggravates lung carcinogenesis in mouse. PLoS One. 2010;5:e10149. doi: 10.1371/journal.pone.0010149. [DOI] [PMC free article] [PubMed] [Google Scholar]
Associated Data
This section collects any data citations, data availability statements, or supplementary materials included in this article.
Supplementary Materials
Data Availability Statement
The datasets used and/or analyzed during the present study are available from the corresponding author on reasonable request.