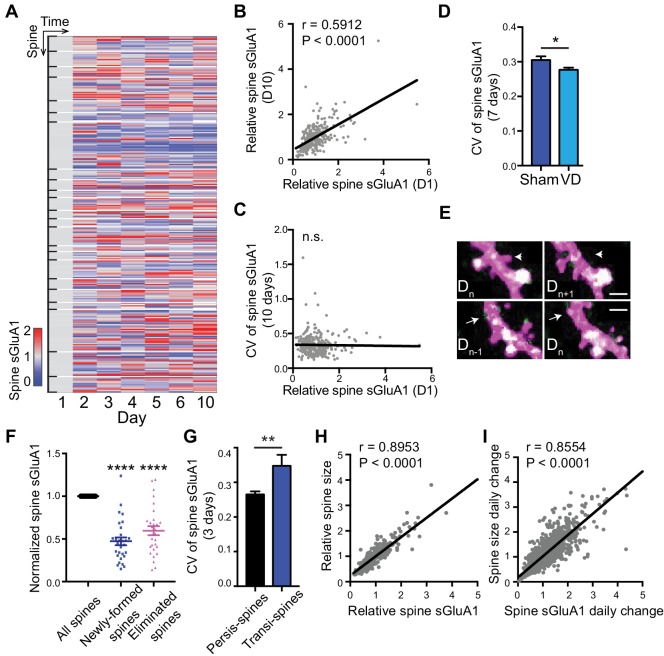
Figure 2. Dynamic baseline expression of sGluA1 within individual spines.
(A) Heat map of sGluA1 expression within individual spines. Spines on the same dendrites were grouped together. (B) Correlation of spine sGluA1 level between day 1 and day 10 in V1 L2/3 neurons (n = 279 spines; Pearson). (C) Correlation between spine sGluA1 level at day 1 and its CV in V1 L2/3 neurons (n = 280 spines; Pearson). (D) The CV of spine sGluA1 signal in V1 L2/3 neurons before and after visual deprivation (VD) (n = 280/520 (Sham/VD) spines in V1 L2/3 neurons; Student’s t-test). (E) Representative images of newly-formed spines (bottom) and eliminated spines (upper). Scale bars: 2 μm. (F) sGluA1 levels in newly-formed spines and eliminated spines (n = 29 spines; Student’s t-test). (G) The CV of spine sGluA1 expression in persistent and transient spines in V1 L2/3 neurons (n = 327 persistent spines; n = 34 transient spines). (H) Correlation between spine size and spine sGluA1 intensity on imaging day 1 (n = 280 spines; Pearson). (I) Correlation between daily change in spine size and daily change in spine sGluA1 level (n = 1384 spines; Pearson). Data are presented as mean ± SEM. n.s., not significant; *p<0.05; **p<0.01; ****p<0.0001.


