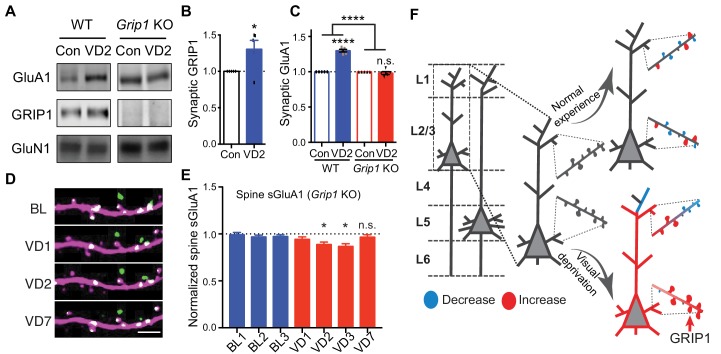
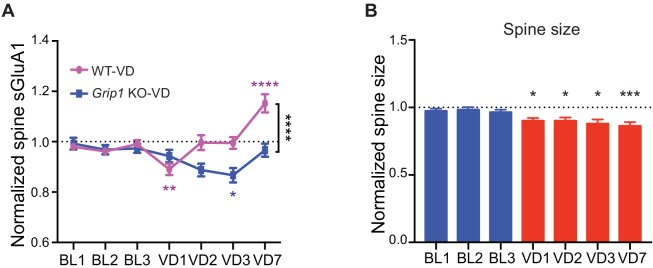
Figure 7. GRIP1-dependent increases of sGluA1 following deprivation.
(A–C) Synaptic GluA1 and GRIP1 levels in V1 from WT and Grip1 knockout (KO) mice with 2 days of sham-surgery or VD (n = 5; Student’s t-test and two-way ANOVA). (D–E) Changes in spine sGluA1 expression on apical dendrites of V1 L2/3 neurons from Grip1 KO mice following VD (n = 32 dendrites from five mice; one-way ANOVA). Scale bar: 5 μm. (F) Model of spine GluA1 dynamics in mice with normal experience or visual deprivation. Data are presented as mean ± SEM. n.s., not significant; *p<0.05; ****p<0.0001.


