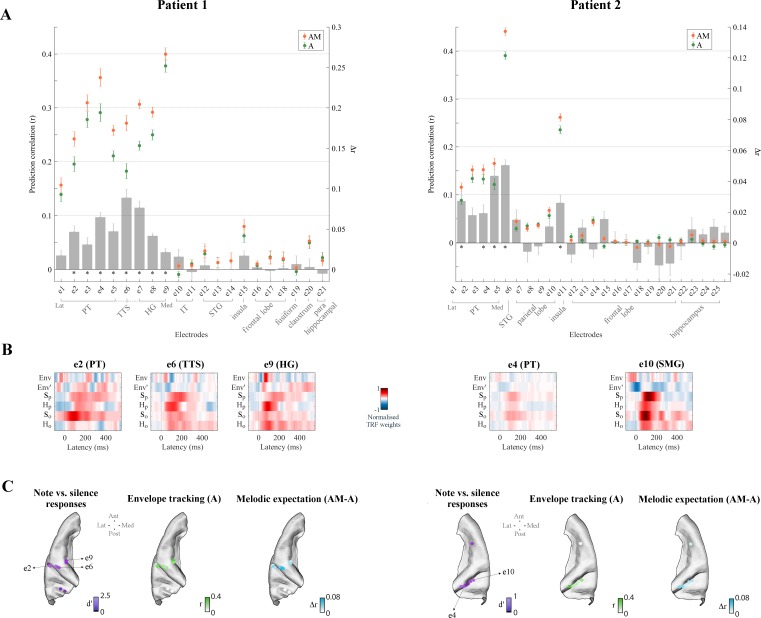
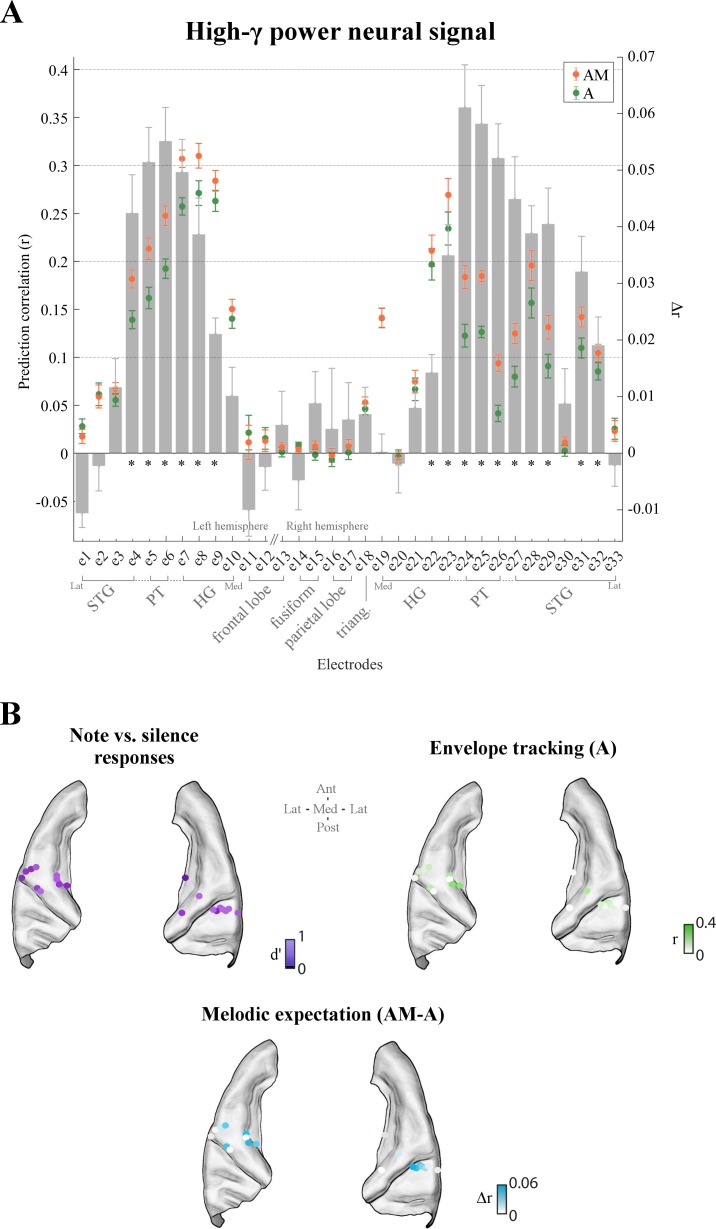
Figure 4. High-γ neural signals in bilateral temporal cortex reflect melodic expectations.
Electrodes with stronger low-rate (1–8 Hz) or high-γ (70–150 Hz) responses to monophonic music than to silence were selected (Cohen’s d > 0.5). (A) ECoG prediction correlations for individual electrodes for A and AM. Electrodes within each group, as indicated by the gray square brackets, were sorted from lateral to medial cortical sites. The gray bars indicate the predictive enhancement due to melodic expectation (rAM-rA). Error bars indicate the SEM over trials (*p<0.01, FDR-corrected permutation test). (B) Normalised TRF weights for selected electrodes (same electrodes as for Figure 3). For Patient 1, the HG electrode e9 showed the strongest envelope tracking and small effect of melodic expectations, while e6 in TTS exhibited the largest effect of expectations (Δr6 > Δr9, p=1.8e−4, d = 2.38). For Patient 2, both e4 (PT) and e10 (SMG) electrodes showed strong envelope tracking and a significant effect of melodic expectations. (C) High-γ (70–150 Hz) ECoG segments time-locked to note onsets were selected and compared with segments corresponding to silence. Colors in the first brain plot of each patient indicate the effect-size of the note vs. silence comparison (Cohen’s d > 0.5). The second brain plot shows the EEG prediction correlations when using acoustic features only (A). The third brain plot depicts the increase in EEG predictions when including melodic expectation features (AM-A).


