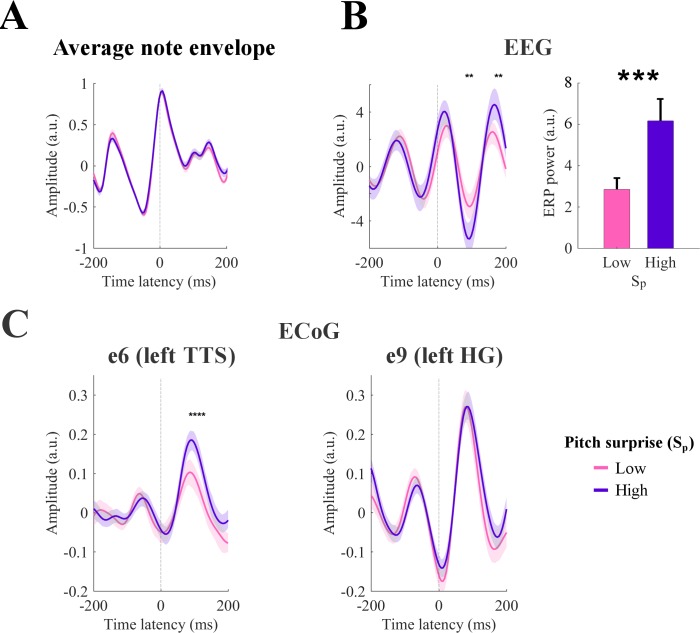
Figure 5. Event-related potentials (ERP) analysis.
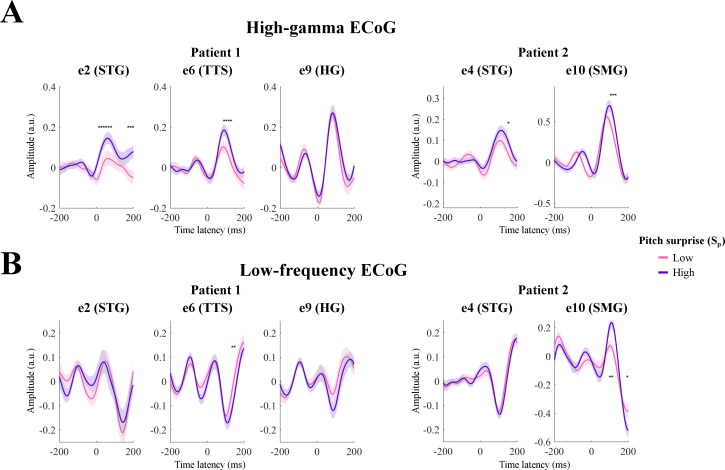
(A) Notes with equal peak envelope were selected (median envelope amplitude across all notes with a tolerance of ±5%). Together, the selected elements were 25% of all notes. Notes were grouped according to the corresponding pitch surprise values (Sp). The figure shows the average sound envelope for the 20% notes with lowest and highest surprise values. Shaded areas indicate the 95% confidence interval. (B) Low-rate EEG signals time-locked to note-onset were selected for high and low Sp values. ERPs for channel Cz are shown on the left. Shaded areas indicate the 95% confidence interval (across subjects). Stars indicate significant differences between ERPs for high and low surprise for a given note onset-EEG latency (permutation test, p<0.05, FDR-corrected). The right panel shows the total ERP power for the latencies from 0 to 200 ms (*p<0.001, permutation test). Error-bars indicate the SEM across subjects. (C) ERPs for high-γ ECoG data from left TTS and HG (Patient 1). Stars indicate significant differences between ERPs for high and low surprise for a given note onset-EEG latency (permutation test, p<0.05, FDR-corrected). Shaded areas indicate the 95% confidence interval (across individual trials, that is responses to single notes).


