

Abstract
Lower- and higher-order visual cortices in the posterior brain, ranging from the medial- and lateral-occipital to fusiform regions, are suggested to support visual object recognition, whereas the frontal eye field (FEF) plays a role in saccadic eye movements which optimize visual processing. Previous studies using electrophysiology and functional MRI techniques have reported that tasks requiring visual object recognition elicited cortical activation sequentially in the aforementioned posterior visual regions and FEFs. The present study aims to provide unique evidence of direct effective connectivity outgoing from the posterior visual regions by measuring the early component (10 – 50 ms) of cortico-cortical spectral responses (CCSRs) elicited by weak single-pulse direct cortical electrical stimulation. We studied 22 patients who underwent extraoperative intracranial EEG recording for clinical localization of seizure foci and functionally-important brain regions. We used animations to visualize the spatiotemporal dynamics of gamma band CCSRs elicited by stimulation of three different posterior visual regions. We quantified the strength of CCSR-defined effective connectivity between the lower- and higher-order posterior visual regions as well as from the posterior visual regions to the FEFs. We found that effective connectivity within the posterior visual regions was larger in the feedforward (i.e., lower- to higher-order) direction compared to the opposite direction. Specifically, connectivity from the medial-occipital region was largest to the lateral-occipital region, whereas that from the lateral-occipital region was largest to the fusiform region. Among the posterior visual regions, connectivity to the FEF was largest from the lateral-occipital region and the mean peak latency of CCSR propagation from the lateral-occipital region to FEF was 26 ms. Our invasive study of the human brain using a stimulation-based intervention supports the model that the posterior visual regions have direct cortico-cortical connectivity pathways in which neural activity is transferred preferentially from the lower- to higher-order areas. The human brain has direct cortico-cortical connectivity allowing a rapid transfer of neural activity from the lateral-occipital region to the FEF.
Keywords: Cortico-cortical evoked potentials (CCEPs), Ventral visual pathways, Neuronal propagation, Intracranial electroencephalography (iEEG), Animation movie, Pediatric epilepsy surgery
1. Introduction
Visual object recognition involves a large-scale posterior brain network including the medial-occipital, lateral-occipital, and fusiform regions (DiCarlo et al., 2012; Grill-Spector et al., 2001; James et al., 2003; Logothetis and Sheinberg, 1996). A widely-accepted model hypothesizes that object recognition is supported by hierarchical cortical processing within the posterior visual pathways (Bastos et al., 2015) and that neuronal activity necessary for object recognition is transferred first from the medial- to the lateral-occipital region and then to the fusiform region (DiCarlo et al., 2012; Mignard and Malpeli, 1991; Pitcher et al., 2011; Riesenhuber and Poggio, 1999; Serences and Yantis, 2006). Studies of patients with focal epilepsy using intracranial EEG (iEEG) have provided a unique opportunity to clarify the temporal dynamics of neuronal activation supporting perception and cognition (Crone et al., 2006). Augmentation of broadband iEEG activity, including the gamma and high-gamma bands, has been suggested to reflect task-related cortical activation (Lachaux et al., 2012; Logothetis et al., 2010; Ray and Maunsell, 2011). During tasks requiring visual object recognition, for example, sustained cortical activation takes place initially in the medial-occipital cortex, followed by the lateral-occipital cortex within 30 – 80 ms after stimulus onset, and subsequently involves the fusiform regions maximally around 170 ms (Asano et al., 2009b; Engell and McCarthy, 2014; Nakai et al., 2018; 2019; Pourtois et al., 2010). Previous iEEG studies have also reported that tasks requiring visual object recognition co-activated the posterior visual regions and the frontal eye field (FEF) located within the precentral gyrus (Asano et al., 2009b; Bastin et al., 2012; Derrfuss et al., 2012; Lobel et al., 2001; Nagasawa et al., 2011; Nakai et al., 2017; Vernet et al., 2014). Automatic saccades to attended objects are driven by the FEF to optimize visual processing. Recent behavioral studies indicate that such saccades may occur as fast as within 100 ms after the onset of visual presentation rapidly following stimulus onset (Kirchner and Thorpe, 2006; Crouzet et al., 2010; Crouzet and Thorpe, 2011). The sequential timing of automatic saccades and sustained cortical activation in the posterior visual regions during object recognition (Figure 1) forms the basis of the two fundamental hypotheses that were tested in the present study. First, we hypothesized that cortico-cortical networks within posterior visual regions are organized in a predominantly feedforward direction (i.e., from the medial- to the lateral-occipital region, from the medial-occipital to fusiform region, and from the lateral-occipital to fusiform region). Second, we hypothesized that either the medial- or the lateral-occipital region, rather than the fusiform gyrus, should have direct cortico-cortical connectivity to the FEF.
Figure 1. Visual object recognition-related cortical activations which motivated the hypotheses tested in the present study.
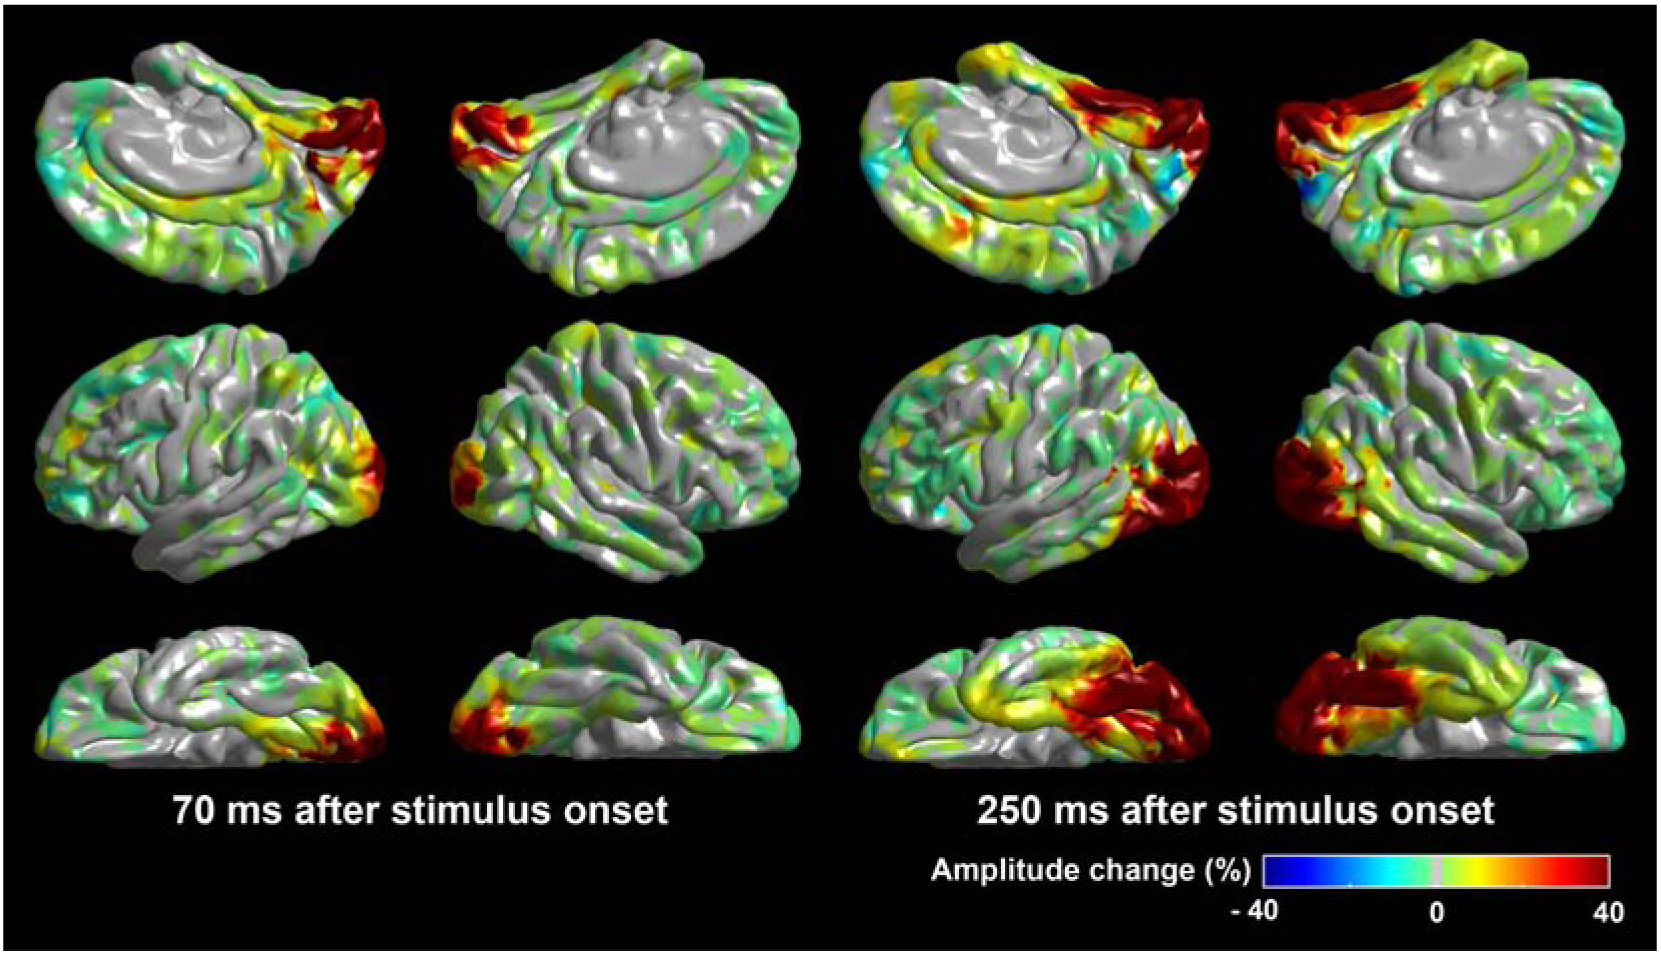
(A) Our previous iEEG study of 79 patients with focal epilepsy (Nakai et al., 2019) demonstrated that picture naming-related high-gamma augmentation involved the medial- and lateral-occipital regions bilaterally at 70 ms after the stimulus onset. (B) Sustained high-gamma augmentation subsequently involved the fusiform regions bilaterally in addition to the medial- and lateral-occipital regions. These findings motivated our hypothesis that the posterior visual regions would have established the cortico-cortical connectivity capable of directly transfer neuronal activity in a feedforward direction.
The unique aspect of the present study includes visualization of effective connectivity from the posterior visual regions of the human brain. The anatomical connectivity within the posterior visual areas has been studied using tracer techniques employed in nonhuman primates (Felleman and Van Essen, 1991; Schall et al., 2009; Tian and Lynch, 1996) as well as humans (Burkhalter and Bernardo, 1989; Clarke, 1994; Horton, 1990). Also, diffusion-weighted imaging (DWI) tractography has been used to noninvasively visualize anatomical connectivity in the visual system (Conturo et al., 1999; Hagmann et al., 2003). Functional connectivity is investigated based on hemodynamic changes on functional MRI (fMRI; Beckmann et al., 2005; Fox et al., 2005; Yeo et al., 2011) and coherence measures on EEG (Astolfi et al., 2005). Assessment of anatomical and functional connectivity does not sufficiently characterize the effective connectivity, which additionally incorporates the direction of a transfer of neural activity from a region to another (Friston, 1994). Effective connectivity has been studied non-interventionally using computational models (Bressler et al., 2008; Chen et al., 2008; Flinker et al., 2015; Friston et al., 2013), as well as interventionally with noninvasive stimulating methods such as transcranial magnetic stimulation (TMS; Reithler et al., 2011; Ruff et al., 2006) or with invasive electrical stimulation (Keller et al., 2014; van Kerkoerle et al., 2014).
In the present study, we quantified the strength of direct effective connectivity using early (10 – 50 ms) components of the cortico-cortical spectral responses (CCSRs) elicited by weak single-pulse stimulation at adjacent posterior visual sites (Usami et al., 2019). Both CCSRs and cortico-cortical evoked potentials (CCEPs; Koubeissi et al., 2012; Matsumoto et al., 2017; 2004; Trebaul et al., 2018) can quantify the strength of effective connectivity between two distant regions. CCEPs and CCSRs provide related and complementary information about the underlying connectivity. CCSRs consist of a summation of phase-locked and non-locked responses, whereas CCEPs consist of phase-locked responses. The amplitude of early broadband responses on CCSRs is suggested to roughly correspond to the area under the curve of the early CCEP component (also known as N1) and thus has been suggested to reflect cortical activation triggered by a single-axonal neural propagation from the stimulus site (Alarcón et al., 2012; Keller et al., 2014; Logothetis et al., 2010; Matsumoto et al., 2017; Usami et al., 2019). The CCEP N1 is known to have a variable polarity depending on the structural feature of the underlying cortex (Araki et al., 2015; Matsumoto et al., 2004), whereas CCSRs are agnostic to the polarity of stimulation-induced cortical responses. This property makes CCSRs an appealing choice for quantifying effective connectivity as it reduces interpretational ambiguity and is nonetheless relatable to existing CCEP literature.
2. Methods
2.1. Participants
The cohort in this study consists of 22 patients (age: 10 – 19; Table 1) with focal epilepsy who underwent measurement of CCSRs elicited by stimulation of medial-occipital, lateral-occipital, or fusiform sites during extraoperative iEEG recording at Children’s Hospital of Michigan. The exclusion criteria were (i) age younger than 10 years (to reduce the effect of development on task-related neural activation and connectivity measures; Nakai et al., 2017), (ii) presence of massive cortical malformations affecting the morphology of the calcarine, central, or lateral sulci (e.g., megalencephaly and polymicrogyria), (iii) seizure onset zone (SOZ), interictal spikes, or epileptogenic lesions involving the medial-occipital region (defined as the summation of lingual and cuneus gyri below and above the calcarine sulcus), and (iv) history of previous epilepsy surgery.
Table 1:
Patients Profile.
| Number of patients | 22 | |
| Mean age (years) | 13.4 | |
| Range of age (years) | 10 – 19 | |
| Proportion of male (%) | 13 | 59% |
| Proportion of right handedness (%) | 20 | 91% |
| Proportion of sampled hemisphere | ||
| Left | 9 | 41% |
| Right | 12 | 55% |
| Both | 1 | 5% |
| SOZ, n(%) | ||
| Frontal | 5 | 22.7% |
| Temporal | 9 | 40.9% |
| Parietal | 6 | 27.3% |
| Insula | 1 | 4.5% |
| N/A | 2 | 9.1% |
| Etiology, n (%) | ||
| Tumor | 2 | 9% |
| Dysplasia | 8 | 36% |
| Dysplasia + hippocampal sclerosis | 1 | 5% |
| Non-lesional or gliosis alone | 11 | 50% |
| Mean number of antiepileptic drugs | 2.04 |
SOZ = seizure onset zone. N/A = not available
Two patients, who did not develop a habitual seizure during iEEG recording, underwent resective surgery based on the interictal iEEG and imaging abnormalities.
2.2. Subdural electrode placement, iEEG recording, and coregistration of electrodes on a 3D surface image
All protocols have been previously reported (Nakai et al., 2019; 2017). In short, platinum disk electrodes (3 mm exposed diameter, 10 mm center-to-center distance) were placed in the subdural space over the affected hemisphere for subsequent localization of the boundaries between epileptogenic and eloquent areas using continuous iEEG recording and electrical stimulation mapping (ESM). Subdural electrodes locations were based on clinical need and no more electrodes were place than clinically indicated. iEEG data were continuously acquired at the bedside with a sampling rate of 1,000 Hz, using the Nihon Kohden Neurofax System (Nihon Kohden America Inc., Foothill Ranch, CA, USA). To maximize the generalizability of the observations from this study, electrode sites clinically classified as SOZ (Asano et al., 2009a) as well as those affected by structural lesions, interictal spike discharges, or artifacts were excluded from further analysis.
We created a 3D surface image with the location of implanted electrodes directly displayed on the pial surface using a pre-surgical T1 weighted spoiled gradient-recalled echo sequence MRI and a post-implant CT image, as previously described (Nakai et al., 2017; Stolk et al., 2018). We confirmed the spatial accuracy of the electrode coregistration using intraoperative pictures (Pieters et al., 2013). All electrodes from all patients were then spatially normalized to Talairach coordinates using FreeSurfer (http://surfer.nmr.mgh.harvard.edu) to facilitate group-level visualization and analysis. Automatic parcellation of cortical gyri was employed at both individual and standardized surfaces for the precise definition of regions of interest (ROIs) in the posterior brain regions (Desikan et al., 2006; Nakai et al., 2019).
2.3. Definition of regions of interest for single-pulse stimulation
2.3.1. Posterior visual network
Our previous iEEG study of 63 patients demonstrated that presentation of a simple flashing light elicited cortical activation initially in the medial- and subsequently in the lateral-occipital regions bilaterally without activating the fusiform region (Nakai et al., 2018). Conversely, another iEEG study of 79 patients reported that picture naming requiring object recognition elicited cortical activation sequentially in the medial-occipital, lateral-occipital, and fusiform regions bilaterally (Nakai et al., 2019). Thus, based on evidence from existing literature, including the timing and extent of visual stimulus-induced iEEG activations (DiCarlo et al., 2012; Mignard and Malpeli, 1991; Nakai et al., 2019; 2018; Pitcher et al., 2011; Riesenhuber and Poggio, 1999; Serences and Yantis, 2006), we defined a hierarchy of posterior visual processing regions, progressing from the medial-occipital area to the lateral-occipital area and then to the fusiform gyrus. Figures 2A–2C show the spatial extent of three ROIs in the posterior brain of each hemisphere, as well as the number of stimulus electrode pairs available at a given spatial point. Figures 2D–2F show the spatial extent of sites recording CCSRs elicited by stimulation of pairs within a given ROI.
Figure 2. Stimulus and recording electrode sites.

The extent of stimulus sites in the (A) medial-occipital (39 stimulus pairs from 14 patients), (B) lateral-occipital (46 pairs from 18 patients), and (C) fusiform regions (41 pairs from 20 patients). The extent of sites recording CCSRs propagated from the (D) medial-occipital (3944 sites), (E) lateral-occipital (4782 sites), and (F) fusiform regions (4163 sites). Note that electrode sites within 1 cm from the stimulus site were excluded from a given CCSR analysis to minimize the potential effects of stimulation artifacts on the iEEG signals (Swann et al., 2012). Areas marked in red color had iEEG data derived from at least six patients.
2.3.2. Frontal eye fields (FEFs)
The spatial extent of the FEF was defined in each hemisphere based on the results of ESM previously employed in a cohort of 84 patients of 10 years and older (Nakai et al., 2017). In a new analysis of the previously reported data, cortical areas were treated as part of the FEF if 50-Hz stimulation consistently elicited forced eye deviation to the contralateral side in ≥5% of patients (Figure 3). The bilateral locations of our ESM-defined FEFs are spatially consistent with those defined in functional imaging and iEEG studies previously reported by other investigators (Bastin et al., 2012; Christophel et al., 2018; Luna et al., 1998; Petit and Haxby, 1999).
Figure 3. Regions defined as the frontal eye fields in the present study.

Regions marked in red color were defined as the frontal eye fields (FEFs) based on the results of electrical stimulation mapping (ESM) as previously employed in 84 patients with focal epilepsy (Nakai et al., 2017).
2.4. Measurement of cortico-cortical spectral responses
Trains of 40 single-pulse electrical stimuli with biphasic polarity were delivered to adjacent electrode pairs with a frequency of 1 Hz, intensity of 5 mA, and a pulse width of 0.3 ms during a post-operative rest period (Nishida et al., 2017). Electrode sites within 1 cm of the stimulus site were excluded from further analysis to minimize the potential effects of stimulation artifacts on the CCSRs (Swann et al., 2012). iEEG signals were re-referenced to a common average which excluded electrodes containing artifacts or epileptogenic activity. Moving-window time-frequency analysis was employed to determine when and where gamma band amplitude was augmented following the single-pulse electrical stimulation. Complex demodulation was utilized to transform iEEG signals into 5 ms/10 Hz time-frequency bins with 1 ms steps (Hoechstetter et al., 2004; Papp and Ktonas, 1977). This complex demodulation method is effectively equivalent to a Gabor transform since a lowpass finite impulse response (FIR) filter of Gaussian shape was employed. The time-frequency resolution, defined as the 50% power drop of the FIR filter, was ±7.9 ms and ±14.2 Hz. At each 5 ms epoch at each electrode site, we measured the percent change in the 30–40 Hz range relative to the mean amplitude during the baseline period 150 to 100 ms before stimulus onset. We did not analyze CCSRs in the high gamma band, which were contaminated by stimulation artifacts in the peri-stimulus window, whereas gamma band CCSRs were substantially less affected by such noise (Figure 4). Significant gamma band augmentation was determined using studentized bootstrapped statistics followed by Simes correction for multiple comparisons across the time windows (Kojima et al., 2013). A given electrode site was defined as showing an early gamma band CCSR only if significant augmentation in the 30 and 40 Hz bins was detected and a local peak was observed between 10 and 50 ms following stimulus onset (Matsumoto et al., 2017). Below, we documented the peak latency of gamma band CCSR at a given recording site based on the timing of maximum augmentation of 30 Hz band amplitude.
Figure 4. Time-frequency analysis to measure early gamma band CCSRs.

(A) Cortico-cortical evoked potentials (CCEPs) elicited by stimulation of a fusiform pair and recorded at an inferior-temporal lobe site. The initial negative deflection (N1) denoted by an arrowhead is time-locked with gamma band augmentation on CCSRs. (B) The time-frequency plot shows the temporal dynamics of iEEG amplitude changes at the same site. Augmentation of gamma band activity at 30–40 Hz took place maximally around 40 ms after stimulus onset. Augmentation of high-gamma activity at >50 Hz took place maximally around the time zero and is attributed to the unwanted effect of a stimulus artifact. +100% indicates that the timing of maximum amplitude augmentation within a given spectral frequency band within a period between −10 and 50 ms relative to stimulus onset. Broken line: The amplitude changes at 30–40 Hz between 10–50 ms poststimulus were used for the measurement of CCSR-based effective connectivity in the present study.
2.5. Visualization of CCSR-based effective connectivity from posterior visual regions
CCSRs were spatially normalized to template space and averaged at the group-level for visualization, as reported previously (Figures 5–7; Nakai et al., 2017). Animations were used to illustrate the spatiotemporal dynamics of early gamma band CCSRs resulting from posterior visual network stimulations. Videos 1, 2, and3 animate the spatiotemporal changes of gamma band CCSRs elicited by medial-occipital, lateral-occipital, and fusiform stimulation, respectively.
Figure 5. The spatiotemporal dynamics of CCSRs elicited by stimulation of medial-occipital sites.

The video snapshots demonstrate the percent change of early gamma band activity relative to the baseline period (100–150 ms prior to the single-pulse stimulation). The extent of stimulus sites is presented in Figure 2A, whereas that of recording sites in Figure 2D. Note that the snapshots demonstrate the CCSRs on the hemisphere ipsilateral to the stimulus site.
Figure 7. The spatiotemporal dynamics of CCSRs elicited by stimulation of fusiform sites.

The video snapshots demonstrate the percent change of early gamma band activity relative to the baseline period (100–150 ms prior to the single-pulse stimulation). The extent of stimulus sites is presented in Figure 2C, whereas that of recording sites in Figure 2F. Note that the snapshots demonstrate the CCSRs on the hemisphere ipsilateral to the stimulus site.
2.6. Mixed model analyses
2.6.1. Connectivity within the posterior visual network
The mixed model analysis initially tested the hypothesis that CCSR-based effective connectivity within the posterior visual regions was higher in a feedforward direction compared to the opposite direction (Table 2). The percent change of gamma band CCSR amplitude relative to baseline was averaged across the 30 – 40 Hz band and within the 10 to 50 ms post-stimulus period. This magnitude was treated as a dependent variable reflecting the strength of CCSR-based effective connectivity. Fixed effect predictors included (a) the direction (coded as 1 if lower-order pairs were stimulated and CCSR was recorded at a higher-order area) and the following covariates: (b) patient age (years), (c) sex (male/female), (d) number of oral antiepileptic drugs (reflecting the severity of seizure burden and related cognitive impairment; Kwan and Brodie, 2001), (e) electrode implantation hemisphere, and (f) lobe identified as containing the SOZ (frontal, temporal, or parietal SOZ). Covariates (b)-(f) are included to capture the degree to which epileptic processes explain the variance observed in CCSRs across the posterior visual areas. The stimulated region was also incorporated as a set of covariates: (g) stimulus at lateral-occipital pairs (coded as 1 if both stimulus electrodes were in the lateral-occipital region), and (h) stimulus at fusiform pairs. Furthermore, (i) the Euclidean distance between stimulus and recording sites (mm) was incorporated as a covariate (Entz et al., 2014). Intercept and patient were treated as random factors.
Table 2:
Mixed model analysis to characterize the effective connectivity within the posterior visual areas.
| 95% CI | |||||||
|---|---|---|---|---|---|---|---|
| Parameters | Estimate | SE | df | t | Pr(>|t|) | LL | UL |
| (Intercept) | 0.572 | 0.300 | 10.702 | 1.937 | 0.080 | −0.080 | 1.224 |
| Sex | −0.059 | 0.056 | 10.862 | −1.047 | 0.318 | −0.183 | 0.065 |
| Age | 0.003 | 0.012 | 10.679 | 0.273 | 0.790 | −0.023 | 0.029 |
| Seizure onset zone | |||||||
| Frontal | −0.053 | 0.118 | 8.732 | −0.452 | 0.662 | −0.321 | 0.215 |
| Temporal | −0.170 | 0.105 | 8.776 | −1.623 | 0.140 | −0.409 | 0.068 |
| Parietal | −0.153 | 0.099 | 7.667 | −1.549 | 0.161 | −0.382 | 0.076 |
| Sampled hemisphere | 0.082 | 0.059 | 9.833 | 1.393 | 0.194 | −0.050 | 0.215 |
| Number of AED | 0.042 | 0.044 | 9.267 | 0.947 | 0.367 | −0.142 | 0.058 |
| Euclidian distance | −0.009 | 0.001 | 1427.178 | −14.437 | 0.000 | −0.011 | −0.008 |
| Lower to higher order | 0.197 | 0.041 | 1495.724 | 4.810 | 0.000 | 0.117 | 0.278 |
| Stimulus region | |||||||
| Lateral occipital | 0.116 | 0.032 | 1291.949 | 3.595 | 0.000 | 0.053 | 0.180 |
| Fusiform | 0.239 | 0.051 | 1459.899 | 4.656 | 0.000 | 0.138 | 0.339 |
SE = Standard error, AED = Antiepileptic drugs, CI = Confidence interval, LL = Lower limit, UL = Upper limit
Each increase in the Euclidian distance (mm) decreased the early gamma band CCSR by 0.9%. The early gamma band CCSR was larger by 19.7% when CCSR was elicited by stimulation of lower-order visual pairs and recorded at higher-order visual areas compared to vice versa. In other words, the CCSR-based direct effective connectivity was larger by 19.7% in a feedforward direction compared to in the opposite direction.
2.6.2. Connectivity to the frontal eye fields
Visual assessment of Videos 1 and2 allowed us to determine whether single-pulse stimulation of the medial- or lateral-occipital region can elicit an early gamma band CCSR within the FEF. A second mixed model analysis, similar to the first model, was used to determine which of the three posterior visual ROIs had the largest CCSR-based direct effective connectivity to the FEF (Table 3). In this case, the dependent variable was the early gamma band CCSR amplitude recorded at the FEF. The fixed effect predictors included (a) stimulus at lateral-occipital pairs and (b) stimulus at fusiform pairs. Again, the covariates included (c) patient age, (d) sex, (e) number of oral antiepileptic drugs, (f) hemisphere, (g) SOZ location, and (h) Euclidean distance between stimulus and recording sites.
Table 3:
Mixed model analysis to characterize the effective connectivity to the frontal eye field.
| 95% CI | |||||||
|---|---|---|---|---|---|---|---|
| Parameters | Estimate | SE | df | t | Pr(>|t|) | LL | UL |
| (Intercept) | 0.358 | 0.159 | 16.700 | 2.240 | 0.039 | 0.020 | 0.696 |
| Sex | 0.027 | 0.027 | 13.876 | 0.967 | 0.350 | −0.032 | 0.086 |
| Age | −0.003 | 0.006 | 13.327 | −0.491 | 0.631 | −0.005 | −0.002 |
| Seizure onset zone | |||||||
| Frontal | −0.043 | 0.060 | 11.631 | −0.714 | 0.489 | −0.172 | 0.088 |
| Temporal | −0.032 | 0.054 | 11.288 | −0.592 | 0.565 | −0.149 | 0.086 |
| Parietal | 0.004 | 0.053 | 11.288 | 0.091 | 0.929 | −0.111 | 0.121 |
| Sampled hemisphere | 0.028 | 0.032 | 12.983 | 0.877 | 0.396 | −0.042 | 0.098 |
| Number of AED | −0.003 | 0.023 | 14.787 | −0.126 | 0.901 | −0.052 | 0.047 |
| Euclidian distance | −0.003 | 0.001 | 722.508 | −5.467 | 0.000 | −0.005 | −0.002 |
| Stimulus region | |||||||
| Lateral occipital | 0.062 | 0.018 | 652.465 | 3.423 | 0.001 | 0.027 | 0.098 |
| Fusiform | −0.021 | 0.019 | 708.502 | −1.090 | 0.276 | −0.058 | 0.017 |
SE = Standard error, AED = Antiepileptic drugs, CI = Confidence interval, LL = Lower limit, UL = Upper limit
Each increase in the Euclidian distance (mm) decreased the early gamma band CCSR by 0.3%. The early gamma band CCSR was larger by 6.2% when CCSR was elicited by stimulation of lateral-occipital pairs compared to that of medial-occipital ones. Conversely, there was no difference in the early gamma band CCSR between stimulation of fusiform and medial-occipital sites.
3. Results
3.1. CCSR-based effective connectivity from posterior visual areas
Videos 1–3 animate the spatiotemporal dynamics of early gamma band CCSRs elicited by stimulation of ipsilateral medial-occipital, lateral-occipital, and fusiform pairs, whereas Figures 5–7 present the snapshots of given CCSRs. Single-pulse stimulation of medial-occipital pairs elicited significant early gamma band CCSRs in the lateral-occipital region at a mean peak latency of 32.71 ± 10.34 ms and in the fusiform region at 24.1 ± 14.41 ms. Likewise, stimulation of lateral-occipital pairs elicited CCSRs in the fusiform region at 23.30 ± 11.47 ms, in the medial-occipital region at 24.33 ± 7.55 ms, and in the FEF region at 26.17 ± 12.86 ms (Online Supplementary Figure S1). Stimulation of fusiform pairs elicited CCSRs in the medial-occipital region at 31.29 ± 6.55 ms and in the lateral occipital region at 33.44 ± 7.44 ms.
3.2. The strength of effective connectivity within the posterior visual network
The mixed model analysis suggested that the strength of CCSR-based effective connectivity was significantly larger in a feedforward direction (estimate=0.197; t=4.810; p<0.001) compared to in the opposite direction (Table 2; Online Supplementary Figure S2). From the estimate, it can be inferred that the magnitude of early gamma band CCSRs was 19.7% larger when stimulation was delivered to lower-order areas and responses were recorded at higher-order areas, compared to vice versa. It should be noted that the effect of direction (lower→higher vs. higher→lower) on the strength of CCSRs was independent of Euclidian distance and stimulated region. For example, longer distance between stimulus and recording sites was independently associated with smaller CCSRs (estimate=−0.009; t=−14.437; p<0.001; Table 2). This finding indicates that each 1 mm increase in distance reduced the amplitude of early gamma band CCSRs by 0.9%. Stimulation of lateral-occipital and fusiform pairs elicited larger CCSRs compared to that of medial-occipital pairs (Table 2).
3.3. The strength of effective connectivity to the frontal eye field (FEF)
Video 2 and Figure 6 demonstrate the presence of direct effective cortico-cortical connectivity from the lateral-occipital region to the FEF. The mixed model analysis indicated that, among the three posterior visual regions, the strength of CCSR-based effective connectivity to the FEF was largest from the lateral-occipital region (estimate=0.062; t=3.423; p=0.001; Table 3). Conversely, the strength of effective connectivity from the fusiform region was approximately similar to that from the medial-occipital region (estimate=−0.021; t=−1.090; p=0.276). The mixed model analysis also suggested an independent effect of Euclidean distance on the strength of CCSR-based effective connectivity to the FEF (estimate=−0.003; t=−5.467; p<0.001; Table 3).
Figure 6. The spatiotemporal dynamics of CCSRs elicited by stimulation of adjacent lateral-occipital sites.

The video snapshots demonstrate the percent change of early gamma band activity relative to the baseline period (100–150 ms prior to the single-pulse stimulation). The extent of stimulus sites is presented in Figure 2B, whereas that of recording sites in Figure 2E. Note that the snapshots demonstrate the CCSRs on the hemisphere ipsilateral to the stimulus site.
4. Discussion
4.1. Summary
The present study used the quantification of early gamma band CCSRs elicited by direct cortical stimulation to demonstrate that posterior visual regions have direct cortico-cortical pathways which are structured to propagate information preferentially from lower- to higher-order areas. The observation of CCSRs elicited by stimulation of lateral-occipital sites and recorded at the FEFs at a mean peak latency of 26 ms supports the hypothesis that the lateral-occipital region has effective, feedforward connectivity allowing rapid cortico-cortical transfer of neural activity to the FEF. These findings were elaborated by animations showing CCSR-based effective connectivity from the posterior visual regions on a standardized 3D surface image, at the whole-brain level (Videos 1-3).
4.2. Methodological considerations
The present study includes the quantification and statistical testing of gamma band CCSRs taking place within 10 to 50 ms following single-pulse stimulation. We chose this analysis time window based on i) the purpose of this study, ii) the observations reported in previous iEEG studies, and iii) the properties of our own iEEG data. The purpose of this study was to measure the early excitatory responses presumably elicited via a single-axonal propagation. Such early responses have been reported to take place generally at a latency of ≤50 ms in the human cerebral cortex (Matsumoto et al., 2017). Measurement of late low frequency-band responses at ≤10 Hz corresponding to the CCEP N2, suggested to, at least in part, reflect secondary, post-excitatory neural inhibition (Alarcón et al., 2012; Logothetis et al., 2010; Matsumoto et al., 2017; Usami et al., 2019), is beyond the scope of the present study. By limiting the analysis time window at ≤50 ms, we wanted to minimize the risk of miscategorization of secondary responses as the early CCSRs. Visual assessment of the CCEP traces acquired in the present study failed to find the presence of an N1 peak taking place after 50 ms. Thus, the risk of failing to capture the initial excitatory response via intrahemispheric direct cortico-cortical propagation occurring after a 50 ms latency may be small in our patient cohort. In the present study of iEEG data acquired with a sampling rate of 1,000 Hz, we did not treat very early gamma band augmentation at <10 ms as significant, because we were unable to distinguish true neuronal responses at <10 ms from stimulation-related artifacts across all patients with confidence. Recent studies have indicated that higher sampling rates would help increasing the signal fidelity of very early CCSRs (Crowther et al., 2019; Tóth et al., 2020).
We took several steps to minimize the effects of potential confounding factors on our CCSR measures. First, we excluded sites classified as SOZ, affected by interictal spiking, or involving structural lesions from the quantitative CCSR analysis. Previous iEEG studies have suggested that single-pulse stimulation of SOZ sites specifically elicited delayed sharply-contoured, broadband waveforms at ≥100 ms following stimulus which were proposed to be generated via cortico-thalamo-cortical propagation (Valentin et al., 2002; van ‘t Klooster et al., 2011). Second, in our mixed model analyses, we included covariates that capture the variance due to SOZ locations and the number of antiepileptic drugs. We applied such statistical approaches partly SOZs have been previously reported to be dysfunctional and less capable of generating event-related high-gamma augmentation (Kojima et al., 2013), whereas our objective was to characterize effective connectivity across nonepileptic sites. Antiepileptic drugs may also have an impact on CCSRs. Phenytoin, a sodium-channel blocker, was previously reported to elevate motor thresholds to transcranial magnetic stimulation but to have no effect on motor-evoked potential amplitudes (Chen et al., 1997). Nevertheless, the mixed-model analyses indicated that none of the epilepsy-related covariates had a significant effect on CCSR measures in our patient cohort (Tables 2 and 3).
In our mixed model analysis, we found that a shorter Euclidean distance was associated with a greater magnitude of CCSR-based effective connectivity; this observation is in line with the findings of previous CCEP studies (Conner et al., 2011; Entz et al., 2014; Shimada et al., 2017). These findings are also consistent with an earlier imaging study demonstrating that a greater number of cortico-cortical fibers are projected to areas more proximal to a given seed region on DWI tractography (Ajilore et al., 2013). However, the association between short distance and greater effective connectivity cannot be attributed to the volume conduction of stimulation-related artifacts since all of the significant CCSRs in the present study had local gamma augmentation peaks between 10 and 50 ms after a stimulus, whereas the peak of stimulation artifacts took place exclusively near the zero millisecond timepoint. Rapid transfer of neural activity between distant regions, such as from the lateral-occipital cortex to the FEF, is expected to occur via the underlying white matter (Yamao et al., 2014). In the future, therefore, we will conduct further studies to determine the DWI-based white matter tracts which most likely support observed CCSR propagations. Such studies might augment the utility of probabilistic functional tractography maps based on the CCEPs and open-source DWI tractography datasets (Trebaul et al., 2018).
Although we did not observe CCSRs in the FEF following stimulation of the medial-occipital or fusiform regions, we cannot rule out the possibility that small fractions of neurons in these areas are also effectively connected to the FEF. Each of the clinical macro-electrodes has a diameter of 3 mm and is estimated to record signals from tens to hundreds of thousands of cortical neurons (Flint et al., 2017) and may therefore not detect smaller signals. Dense iEEG electrode arrays with a smaller center-to-center distance and a smaller electrode diameter may be able to better delineate effective connectivity between the posterior visual regions and FEF without increasing the risk of surgical complications.
A limitation of the present study using cortical surface electrodes includes the lack of iEEG signal sampling from deep subcortical structures. Thus, we were unable to quantify or visualize CCSRs generated by thalamic neurons or cortico-thalamic-cortical pathways. Our epilepsy surgery team determined electrode placement locations based purely on clinical needs, and the thalamus was not a potential therapy target in our patient cohort. Though clinicians routinely employ stereotactic EEG in many tertiary epilepsy centers, simultaneous iEEG recording from the posterior visual areas and thalamus has never been reported to the best of our knowledge. Furthermore, although thalamic brain stimulation reduces the severity of disease symptoms in select patients with drug-resistant movement disorders and focal epilepsy (Fisher and Velasco, 2014), the typical therapy targets, at this moment, remain outside the lateral geniculate nucleus, which is suggested to have direct effective connectivity to the lower-order visual cortex (Logothetis et al., 2010; Zhang and Raichle, 2010). Further studies, perhaps using animal models, may be warranted to measure the effective connectivity between the thalamus and posterior visual regions to determine the nature of late CCSR components.
4.3. Significance of direct effective connectivity from the lateral-occipital to the FEF
The present study demonstrated direct cortico-cortical connectivity from the lateral-occipital region to the FEF with a mean latency of 26 ms. Such direct transfer of neural activity to the FEF may consist of a biologically-plausible mechanism that enables automatic and rapid saccades to optimize the recognition of given visual objects. Stimulation of the FEF has been reported to promptly induce eye deviation (Nakai et al., 2017). Taking into account that the lower-order visual processing in the medial- and lateral-occipital regions is initiated at 30–80 ms (Asano et al., 2009b; Inui et al., 2006; Nakai et al., 2019; Yoshor et al., 2007), effective connectivity from the lateral-occipital region to FEF can, at least in part, account for the previously-reported observation that healthy humans detect and saccade to a visual object within 100–140 ms following its presentation (Crouzet et al., 2010; Kirchner and Thorpe, 2006). Our CCSR findings are consistent with the notion that activation in the lateral-occipital region is a driving force of rapid saccadic eye movements (Corbetta et al., 1998; Grill-Spector et al., 2001; McPeek et al., 1999; Tallon-Baudry et al., 2005). Conversely, higher-order visual processing in the fusiform gyrus is reported to take place maximally around 170 ms following stimulus onset (Bentin et al., 1996; Rossion and Jacques, 2008; Xu et al., 2005). Thus, higher-order visual processing in the fusiform cortex may not contribute to rapid automatic saccades.
The effective connectivity from the lateral-occipital region to the FEF observed here provides interventional evidence consistent with existing literature describing the dorsal attention network. The dorsal attention network is thought to include aspects of the lateral-occipital region and the FEF, as described by hemodynamic responses (Corbetta et al., 2000; Corbetta and Shulman, 2002; Shulman et al., 1999) and fMRI functional connectivity (Corbetta and Shulman, 2011; Fox et al., 2005; Yeo et al., 2011), during a spatial attention task. The human lateral-occipital region includes the MT+ field suggested being connected to the ipsilateral FEF based on the fMRI-based connectivity (Yeo et al., 2011; Yin et al., 2017). The human MT+ is equivalent to the macaque MT and MST (Huk et al., 2002; Tootell and Taylor, 1995), which likewise thought to have connectivity to the FEF based on studies using tracer techniques (Felleman and Van Essen, 1991; Maunsell and Van Essen, 1983; Schall et al., 1995; Stanton et al., 2005; Ungerleider and Desimone, 1986). The candidate white matter pathways underlying the effective connectivity from the lateral-occipital region to the FEF include the superior longitudinal fasciculus II/III (Thiebaut de Schotten et al., 2011; Umarova et al., 2010) and the fronto-occipital fasciculus (Petrides and Pandya, 2006).
4.4. Significance of direct effective connectivity within the posterior visual regions
Our findings are consistent with prior primate work demonstrating that vision-related feedforward activity in posterior cortical regions involves broadband activity, including the gamma band (Bastos et al., 2015), and that microsimulation of the posterior visual cortex elicited gamma band augmentation in downstream regions (van Kerkoerle et al., 2014). The present study also replicates and extends the findings reported in our previous iEEG study of an independent cohort of 10 patients, in which only 10 trials of 3 mA stimuli were delivered to elicit CCEPs (Matsuzaki et al., 2013). In that study, only late components of CCEPs (70 – 130 ms post-stimulus) were found to be larger in a feedforward direction compared to in the opposite direction. Such late CCEP components may not reflect cortical activation but rather indicate subsequent neuronal suppression or possibly indirect neuronal propagation (Alarcón et al., 2012; Logothetis et al., 2010; Matsumoto et al., 2017; 2004; Usami et al., 2019; Valentin et al., 2002; van ‘t Klooster et al., 2011). In the present study, we provided novel and more definitive evidence of CCSR-based cortico-cortical pathways enabling direct transfer of neural activity preferentially from lower- to higher-order visual regions.
We still do not know the exact mechanism which has made the CCSRs within the posterior visual regions preferentially transferred from the lower-order to higher-order visual regions. The candidate mechanisms include experience-based plasticity (Kourtzi and DiCarlo, 2006). The healthy human brain has repeatedly exerted the visual recognition process from infancy, and repeated natural neuronal propagation in a feedforward direction may have contributed to the establishment of CCSR-based effective connectivity in the same direction. Yet, the present study of patients of 10 years and older failed to find a significant effect of age on the magnitude of CCSR-based effective connectivity. Further CCSR studies of a large cohort of patients, including young children, may determine the role of experience-based plasticity in the effective connectivity across large-scale cortical networks in the human brain.
Supplementary Material
Highlights.
CCSRs measure effective connectivity reflecting direct transfer of neural activity.
CCSRs preferentially propagate from lower- to higher-order posterior visual areas.
The lateral-occipital area transfers neural activity to the FEF in 26 ms on average.
Funding
This study was supported by NIH Grants (NS064033 to E.A. and NS089659 to J.W.J.).
Footnotes
Publisher's Disclaimer: This is a PDF file of an unedited manuscript that has been accepted for publication. As a service to our customers we are providing this early version of the manuscript. The manuscript will undergo copyediting, typesetting, and review of the resulting proof before it is published in its final form. Please note that during the production process errors may be discovered which could affect the content, and all legal disclaimers that apply to the journal pertain.
Data and code availability
All clinical, imaging, and iEEG data, as well as the code used to generate the results reported in this study, are available upon request to the corresponding author.
Ethics statement
The Institutional Review Board at Wayne State University has approved this study. We obtained informed consent from the guardians of patients and assent from children older than 13 years.
Declaration of competing interest
None of the authors have disclosures or conflicts of interest regarding this study.
REFERENCE
- Ajilore O, Zhan L, GadElkarim J, Zhang A, Feusner JD, Yang S, Thompson PM, Kumar A, Leow A, 2013. Constructing the resting state structural connectome. Front Neuroinform 7, 1–8. doi: 10.3389/fninf.2013.00030 [DOI] [PMC free article] [PubMed] [Google Scholar]
- Alarcón G, Martinez J, Kerai SV, Lacruz ME, Quiroga RQ, Selway RP, Richardson MP, García Seoane JJ, Valentín A, 2012. In vivo neuronal firing patterns during human epileptiform discharges replicated by electrical stimulation. Clin. Neurophysiol 123, 1736– 1744. doi: 10.1016/j.clinph.2012.02.062 [DOI] [PMC free article] [PubMed] [Google Scholar]
- Araki K, Terada K, Usui K, Usui N, Araki Y, Baba K, Matsuda K, Tottori T, Inoue Y, 2015. Bidirectional neural connectivity between basal temporal and posterior language areas in humans. Clin. Neurophysiol 126, 682–688. doi: 10.1016/j.clinph.2014.07.020 [DOI] [PubMed] [Google Scholar]
- Asano E, Juhász C, Shah A, Sood S, Chugani HT, 2009a. Role of subdural electrocorticography in prediction of long-term seizure outcome in epilepsy surgery. Brain 132, 1038–1047. doi: 10.1093/brain/awp025 [DOI] [PMC free article] [PubMed] [Google Scholar]
- Asano E, Nishida M, Fukuda M, Rothermel R, Juhász C, Sood S, 2009b. Differential visually-induced gamma-oscillations in human cerebral cortex. NeuroImage 45, 477–489. doi: 10.1016/j.neuroimage.2008.12.003 [DOI] [PMC free article] [PubMed] [Google Scholar]
- Astolfi L, Cincotti F, Mattia D, Babiloni C, Carducci F, Basilisco A, Rossini PM, Salinari S, Ding L, Ni Y, He B, Babiloni F, 2005. Assessing cortical functional connectivity by linear inverse estimation and directed transfer function: simulations and application to real data. Clin. Neurophysiol 116, 920–932. doi: 10.1016/j.clinph.2004.10.012 [DOI] [PubMed] [Google Scholar]
- Bastin J, Lebranchu P, Jerbi K, Kahane P, Orban G, Lachaux J-P, Berthoz A, 2012. Direct recordings in human cortex reveal the dynamics of gamma-band [50–150 Hz] activity during pursuit eye movement control. NeuroImage 63, 339–347. doi: 10.1016/j.neuroimage.2012.07.011 [DOI] [PubMed] [Google Scholar]
- Bastos AM, Vezoli J, Bosman CA, Schoffelen J-M, Oostenveld R, Dowdall JR, De Weerd P, Kennedy H, Fries P, 2015. Visual Areas Exert Feedforward and Feedback Influences through Distinct Frequency Channels. Neuron 85, 390–401. doi: 10.1016/j.neuron.2014.12.018 [DOI] [PubMed] [Google Scholar]
- Beckmann CF, DeLuca M, Devlin JT, Smith SM, 2005. Investigations into resting-state connectivity using independent component analysis. Phil. Trans. R. Soc. B 360, 1001–1013. doi: 10.1098/rstb.2005.1634 [DOI] [PMC free article] [PubMed] [Google Scholar]
- Bentin S, Allison T, Puce A, Perez E, McCarthy G, 1996. Electrophysiological Studies of Face Perception in Humans. J. Cogn. Neurosci 8, 551–565. doi: 10.1162/jocn.1996.8.6.551 [DOI] [PMC free article] [PubMed] [Google Scholar]
- Bressler SL, Tang W, Sylvester CM, Shulman GL, Corbetta M, 2008. Top-down control of human visual cortex by frontal and parietal cortex in anticipatory visual spatial attention. J. Neurosci 28, 10056–10061. doi: 10.1523/JNEUROSCI.1776-08.2008 [DOI] [PMC free article] [PubMed] [Google Scholar]
- Burkhalter A, Bernardo KL, 1989. Organization of corticocortical connections in human visual cortex. Proc. Natl. Acad. Sci. U. S. A 86, 1071–1075. doi: 10.1073/pnas.86.3.1071 [DOI] [PMC free article] [PubMed] [Google Scholar]
- Chen CC, Kiebel SJ, Friston KJ, 2008. Dynamic causal modelling of induced responses. NeuroImage 41, 1293–1312. doi: 10.1016/j.neuroimage.2008.03.026 [DOI] [PubMed] [Google Scholar]
- Chen R, Samii A, Canos M, Wassermann EM, Hallett M, 1997. Effects of phenytoin on cortical excitability in humans. Neurology 49, 881–883. doi: 10.1212/wnl.49.3.881 [DOI] [PubMed] [Google Scholar]
- Christophel TB, Allefeld C, Endisch C, Haynes J-D, 2018. View-Independent Working Memory Representations of Artificial Shapes in Prefrontal and Posterior Regions of the Human Brain. Cereb. Cortex 28, 2146–2161. doi: 10.1093/cercor/bhx119 [DOI] [PubMed] [Google Scholar]
- Clarke S, 1994. Association and intrinsic connections of human extrastriate visual cortex. Proc. R. Soc. B 257, 87–92. doi: 10.1098/rspb.1994.0098 [DOI] [PubMed] [Google Scholar]
- Conner CR, Ellmore TM, DiSano MA, Pieters TA, Potter AW, Tandon N, 2011. Anatomic and electro-physiologic connectivity of the language system A combined DTI-CCEP study. Comput. Biol. Med 41, 1100–1109. doi: 10.1016/j.compbiomed.2011.07.008 [DOI] [PMC free article] [PubMed] [Google Scholar]
- Conturo TE, Lori NF, Cull TS, Akbudak E, Snyder AZ, Shimony JS, McKinstry RC, Burton H, Raichle ME, 1999. Tracking neuronal fiber pathways in the living human brain. Proc. Natl. Acad. Sci. U. S. A 96, 10422–10427. doi: 10.1073/pnas.96.18.10422 [DOI] [PMC free article] [PubMed] [Google Scholar]
- Corbetta M, Akbudak E, Conturo TE, Snyder AZ, Ollinger JM, Drury HA, Linenweber MR, Petersen SE, Raichle ME, Van Essen DC, Shulman GL, 1998. A Common Network of Functional Areas for Attention and Eye Movements. Neuron 21, 761–773. doi: 10.1016/S0896-6273(00)80593-0 [DOI] [PubMed] [Google Scholar]
- Corbetta M, Kincade JM, Ollinger JM, McAvoy MP, Shulman GL, 2000. Voluntary orienting is dissociated from target detection in human posterior parietal cortex. Nat. Neurosci 3, 292–297. doi: 10.1038/73009 [DOI] [PubMed] [Google Scholar]
- Corbetta M, Shulman GL, 2011. Spatial Neglect and Attention Networks. Annu. Rev. Neurosci 34, 569–599. doi: 10.1146/annurev-neuro-061010-113731 [DOI] [PMC free article] [PubMed] [Google Scholar]
- Corbetta M, Shulman GL, 2002. Control of goal-directed and stimulus-driven attention in the brain. Nat. Rev. Neurosci 3, 201–215. doi: 10.1038/nrn755 [DOI] [PubMed] [Google Scholar]
- Crone NE, Sinai A, Korzeniewska A, 2006. High-frequency gamma oscillations and human brain mapping with electrocorticography, in: Event-Related Dynamics of Brain Oscillations, Progress in Brain Research. Elsevier, pp. 275–295. doi: 10.1016/S0079-6123(06)59019-3 [DOI] [PubMed] [Google Scholar]
- Crouzet SM, Kirchner H, Thorpe SJ, 2010. Fast saccades toward faces: face detection in just 100 ms. J. Vis 10, 161–17. doi: 10.1167/10.4.16 [DOI] [PubMed] [Google Scholar]
- Crouzet SM, Thorpe SJ, 2011. Low-level cues and ultra-fast face detection. Front. Psychol 2, 342. doi: 10.3389/fpsyg.2011.00342 [DOI] [PMC free article] [PubMed] [Google Scholar]
- Crowther LJ, Brunner P, Kapeller C, Guger C, Kamada K, Bunch ME, Frawley BK, Lynch TM, Ritaccio AL, Schalk G, 2019. A quantitative method for evaluating cortical responses to electrical stimulation. J. Neurosci. Methods 311, 67–75. doi: 10.1016/j.jneumeth.2018.09.034 [DOI] [PMC free article] [PubMed] [Google Scholar]
- Derrfuss J, Vogt VL, Fiebach CJ, Cramon, von DY, Tittgemeyer M, 2012. Functional organization of the left inferior precentral sulcus: Dissociating the inferior frontal eye field and the inferior frontal junction. NeuroImage 59, 3829–3837. doi: 10.1016/j.neuroimage.2011.11.051 [DOI] [PubMed] [Google Scholar]
- Desikan RS, Ségonne F, Fischl B, Quinn BT, Dickerson BC, Blacker D, Buckner RL, Dale AM, Maguire RP, Hyman BT, Albert MS, Killiany RJ, 2006. An automated labeling system for subdividing the human cerebral cortex on MRI scans into gyral based regions of interest. NeuroImage 31, 968–980. doi: 10.1016/j.neuroimage.2006.01.021 [DOI] [PubMed] [Google Scholar]
- DiCarlo JJ, Zoccolan D, Rust NC, 2012. How Does the Brain Solve Visual Object Recognition? Neuron 73, 415–434. doi: 10.1016/j.neuron.2012.01.010 [DOI] [PMC free article] [PubMed] [Google Scholar]
- Engell AD, McCarthy G, 2014. Repetition suppression of face-selective evoked and induced EEG recorded from human cortex. Hum. Brain Mapp 35, 4155–4162. doi: 10.1002/hbm.22467 [DOI] [PMC free article] [PubMed] [Google Scholar]
- Entz L, Tóth E, Keller CJ, Bickel S, Groppe DM, Fabó D, Kozák LR, Erőss L, Ulbert I, Mehta AD, 2014. Evoked effective connectivity of the human neocortex. Hum. Brain Mapp 35, 5736–5753. doi: 10.1002/hbm.22581 [DOI] [PMC free article] [PubMed] [Google Scholar]
- Felleman DJ, Van Essen DC, 1991. Distributed Hierarchical Processing in the Primate Cerebral Cortex. Cereb. Cortex 1, 1–47. doi: 10.1093/cercor/1.1.1 [DOI] [PubMed] [Google Scholar]
- Fisher RS, Velasco AL, 2014. Electrical brain stimulation for epilepsy. Nat. Rev. Neurol 10, 261–270. doi: 10.1038/nrneurol.2014.59 [DOI] [PubMed] [Google Scholar]
- Flinker A, Korzeniewska A, Shestyuk AY, Franaszczuk PJ, Dronkers NF, Knight RT, Crone NE, 2015. Redefining the role of Broca’s area in speech. Proc. Natl. Acad. Sci. U. S. A 112, 2871–2875. doi: 10.1073/pnas.1414491112 [DOI] [PMC free article] [PubMed] [Google Scholar]
- Flint RD, Rosenow JM, Tate MC, Slutzky MW, 2017. Continuous decoding of human grasp kinematics using epidural and subdural signals. J. Neural Eng 14, 016005. doi: 10.1088/1741-2560/14/1/016005 [DOI] [PMC free article] [PubMed] [Google Scholar]
- Fox MD, Snyder AZ, Vincent JL, Corbetta M, Van Essen DC, Raichle ME, 2005. From The Cover: The human brain is intrinsically organized into dynamic, anticorrelated functional networks. Proc. Natl. Acad. Sci. U. S. A 102, 9673–9678. doi: 10.1073/pnas.0504136102 [DOI] [PMC free article] [PubMed] [Google Scholar]
- Friston KJ, 1994. Functional and effective connectivity in neuroimaging: A synthesis. Hum. Brain Mapp 2, 56–78. doi: 10.1002/hbm.460020107 [DOI] [Google Scholar]
- Friston KJ, Moran R, Seth AK, 2013. Analysing connectivity with Granger causality and dynamic causal modelling. Curr. Opin. Neurobiol 23, 172–178. doi: 10.1016/j.conb.2012.11.010 [DOI] [PMC free article] [PubMed] [Google Scholar]
- Grill-Spector K, Kourtzi Z, Kanwisher N, 2001. The lateral occipital complex and its role in object recognition. Vision Res. 41, 1409–1422. doi: 10.1016/S0042-6989(01)00073-6 [DOI] [PubMed] [Google Scholar]
- Hagmann P, Thiran JP, Jonasson L, Vandergheynst P, Clarke S, Maeder P, Meuli R, 2003. DTI mapping of human brain connectivity: statistical fibre tracking and virtual dissection. NeuroImage 19, 545–554. doi: 10.1016/S1053-8119(03)00142-3 [DOI] [PubMed] [Google Scholar]
- Hoechstetter K, Bornfleth H, Weckesser D, Ille N, Berg P, Scherg M, 2004. BESA Source Coherence: A New Method to Study Cortical Oscillatory Coupling. Brain Topogr. 16, 233–238. doi: 10.1023/B:BRAT.0000032857.55223.5d [DOI] [PubMed] [Google Scholar]
- Horton JC, 1990. Arrangement of Ocular Dominance Columns in Human Visual Cortex. Arch Ophthalmol 108, 1025–7. doi: 10.1001/archopht.1990.01070090127054 [DOI] [PubMed] [Google Scholar]
- Huk AC, Dougherty RF, Heeger DJ, 2002. Retinotopy and Functional Subdivision of Human Areas MT and MST. J. Neurosci 22, 7195–7205. doi: 10.1523/JNEUROSCI.22-16-07195.2002 [DOI] [PMC free article] [PubMed] [Google Scholar]
- Inui K, Sannan H, Miki K, Kaneoke Y, Kakigi R, 2006. Timing of early activity in the visual cortex as revealed by simultaneous MEG and ERG recordings. NeuroImage 30, 239–244. doi: 10.1016/j.neuroimage.2005.09.003 [DOI] [PubMed] [Google Scholar]
- James TW, Culham J, Humphrey GK, Milner AD, Goodale MA, 2003. Ventral occipital lesions impair object recognition but not object directed grasping: an fMRI study. Brain 126, 2463–2475. doi: 10.1093/brain/awg248 [DOI] [PubMed] [Google Scholar]
- Keller CJ, Honey CJ, Mégevand P, Entz L, Ulbert I, Mehta AD, 2014. Mapping human brain networks with cortico-cortical evoked potentials. Phil. Trans. R. Soc B 369. doi: 10.1098/rstb.2013.0528 [DOI] [PMC free article] [PubMed] [Google Scholar]
- Kirchner H, Thorpe SJ, 2006. Ultra-rapid object detection with saccadic eye movements: Visual processing speed revisited. Vision Res. 46, 1762–1776. doi: 10.1016/j.visres.2005.10.002 [DOI] [PubMed] [Google Scholar]
- Kojima K, Brown EC, Rothermel R, Carlson A, Fuerst D, Matsuzaki N, Shah A, Atkinson M, Basha M, Mittal S, Sood S, Asano E, 2013. Clinical significance and developmental changes of auditory-language-related gamma activity. Clin. Neurophysiol 124, 857–869. doi: 10.1016/j.clinph.2012.09.031 [DOI] [PMC free article] [PubMed] [Google Scholar]
- Koubeissi MZ, Lesser RP, Sinai A, Gaillard WD, Franaszczuk PJ, Crone NE, 2012. Connectivity between Perisylvian and Bilateral Basal Temporal Cortices. Cereb. Cortex 22, 918–925. doi: 10.1093/cercor/bhr163 [DOI] [PMC free article] [PubMed] [Google Scholar]
- Kourtzi Z, DiCarlo JJ, 2006. Learning and neural plasticity in visual object recognition. Curr. Opin. Neurobiol 16, 152–158. doi: 10.1016/j.conb.2006.03.012 [DOI] [PubMed] [Google Scholar]
- Kwan P, Brodie MJ, 2001. Neuropsychological effects of epilepsy and antiepileptic drugs. Lancet 357, 216–222. doi: 10.1016/S0140-6736(00)03600-X [DOI] [PubMed] [Google Scholar]
- Lachaux J-P, Axmacher N, Mormann F, Halgren E, Crone NE, 2012. High-frequency neural activity and human cognition: Past, present and possible future of intracranial EEG research. Prog. Neurobiol 98, 279–301. doi: 10.1016/j.pneurobio.2012.06.008 [DOI] [PMC free article] [PubMed] [Google Scholar]
- Lobel E, Kahane P, Leonards U, Grosbras M-H, Lehéricy S, Bihan DL, Berthoz A, 2001. Localization of human frontal eye fields: anatomical and functional findings of functional magnetic resonance imaging and intracerebral electrical stimulation. J. Neurosurg 95, 804–815. doi: 10.3171/jns.2001.95.5.0804 [DOI] [PubMed] [Google Scholar]
- Logothetis NK, Augath M, Murayama Y, Rauch A, Sultan F, Goense J, Oeltermann A, Merkle H, 2010. The effects of electrical microstimulation on cortical signal propagation. Nat. Neurosci 13, 1283–1291. doi: 10.1038/nn.2631 [DOI] [PubMed] [Google Scholar]
- Logothetis NK, Sheinberg DL, 1996. Visual Object Recognition. Annu. Rev. Neurosci 19, 577–621. doi: 10.1146/annurev.ne.19.030196.003045 [DOI] [PubMed] [Google Scholar]
- Luna B, Thulborn KR, Strojwas MH, McCurtain BJ, Berman RA, Genovese CR, Sweeney JA, 1998. Dorsal cortical regions subserving visually guided saccades in humans: an fMRI study. Cereb. Cortex 8, 40–47. doi: 10.1093/cercor/8.1.40 [DOI] [PubMed] [Google Scholar]
- Matsumoto R, Kunieda T, Nair D, 2017. Single pulse electrical stimulation to probe functional and pathological connectivity in epilepsy. Seizure 44, 27–36. doi: 10.1016/j.seizure.2016.11.003 [DOI] [PMC free article] [PubMed] [Google Scholar]
- Matsumoto R, Nair DR, LaPresto E, Najm I, Bingaman W, Shibasaki H, Lüders HO, 2004. Functional connectivity in the human language system: a cortico-cortical evoked potential study. Brain 127, 2316–2330. doi: 10.1093/brain/awh246 [DOI] [PubMed] [Google Scholar]
- Matsuzaki N, Juhász C, Asano E, 2013. Cortico-cortical evoked potentials and stimulation-elicited gamma activity preferentially propagate from lower- to higher-order visual areas. Clin. Neurophysiol 124, 1290–1296. doi: 10.1016/j.clinph.2013.02.007 [DOI] [PMC free article] [PubMed] [Google Scholar]
- Maunsell JH, Van Essen DC, 1983. The connections of the middle temporal visual area (MT) and their relationship to a cortical hierarchy in the macaque monkey. J. Neurosci 3, 2563– 2586. doi: 10.1523/JNEUROSCI.03-12-02563.1983 [DOI] [PMC free article] [PubMed] [Google Scholar]
- McPeek RM, Maljkovic V, Nakayama K, 1999. Saccades require focal attention and are facilitated by a short-term memory system. Vision Res. 39, 1555–1566. doi: 10.1016/S0042-6989(98)00228-4 [DOI] [PubMed] [Google Scholar]
- Mignard M, Malpeli JG, 1991. Paths of information flow through visual cortex. Science 251, 1249–1251. doi: 10.1126/science.1848727 [DOI] [PubMed] [Google Scholar]
- Nagasawa T, Matsuzaki N, Juhász C, Hanazawa A, Shah A, Mittal S, Sood S, Asano E, 2011. Occipital gamma-oscillations modulated during eye movement tasks: simultaneous eye tracking and electrocorticography recording in epileptic patients. NeuroImage 58, 1101–1109. doi: 10.1016/j.neuroimage.2011.07.043 [DOI] [PMC free article] [PubMed] [Google Scholar]
- Nakai Y, Jeong J-W, Brown EC, Rothermel R, Kojima K, Kambara T, Shah A, Mittal S, Sood S, Asano E, 2017. Three- and four-dimensional mapping of speech and language in patients with epilepsy. Brain 140, 1351–1370. doi: 10.1093/brain/awx051 [DOI] [PMC free article] [PubMed] [Google Scholar]
- Nakai Y, Nagashima A, Hayakawa A, Osuki T, Jeong J-W, Sugiura A, Brown EC, Asano E, 2018. Four-dimensional map of the human early visual system. Clin. Neurophysiol 129, 188–197. doi: 10.1016/j.clinph.2017.10.019 [DOI] [PMC free article] [PubMed] [Google Scholar]
- Nakai Y, Sugiura A, Brown EC, Sonoda M, Jeong J-W, Rothermel R, Luat AF, Sood S, Asano E, 2019. Four dimensional functional cortical maps of visual and auditory language: Intracranial recording. Epilepsia 60, 255–267. doi: 10.1111/epi.14648 [DOI] [PMC free article] [PubMed] [Google Scholar]
- Nishida M, Korzeniewska A, Crone NE, Toyoda G, Nakai Y, Ofen N, Brown EC, Asano E, 2017. Brain network dynamics in the human articulatory loop. Clin. Neurophysiol 128, 1473–1487. doi: 10.1016/j.clinph.2017.05.002 [DOI] [PMC free article] [PubMed] [Google Scholar]
- Papp N, Ktonas P, 1977. Critical evaluation of complex demodulation techniques for the quantification of bioelectrical activity. Biomed. Sci. Instrum 13, 135–145. [PubMed] [Google Scholar]
- Petit L, Haxby JV, 1999. Functional anatomy of pursuit eye movements in humans as revealed by fMRI. J. Neurophysiol 82, 463–471. doi: 10.1152/jn.1999.82.1.463 [DOI] [PubMed] [Google Scholar]
- Petrides M, Pandya DN, 2006. Efferent association pathways originating in the caudal prefrontal cortex in the macaque monkey. J. Comp. Neurol 498, 227–251. doi: 10.1002/cne.21048 [DOI] [PubMed] [Google Scholar]
- Pieters TA, Conner CR, Tandon N, 2013. Recursive grid partitioning on a cortical surface model: an optimized technique for the localization of implanted subdural electrodes. J. Neurosurg 118, 1086–1097. doi: 10.3171/2013.2.JNS121450 [DOI] [PubMed] [Google Scholar]
- Pitcher D, Duchaine B, Walsh V, Yovel G, Kanwisher N, 2011. The role of lateral occipital face and object areas in the face inversion effect. Neuropsychologia 49, 3448–3453. doi: 10.1016/j.neuropsychologia.2011.08.020 [DOI] [PubMed] [Google Scholar]
- Pourtois G, Spinelli L, Seeck M, Vuilleumier P, 2010. Modulation of Face Processing by Emotional Expression and Gaze Direction during Intracranial Recordings in Right Fusiform Cortex. J. Cogn. Neurosci 22, 2086–2107. doi: 10.1162/jocn.2009.21404 [DOI] [PubMed] [Google Scholar]
- Ray S, Maunsell JHR, 2011. Different Origins of Gamma Rhythm and High-Gamma Activity in Macaque Visual Cortex. PLoS Biol 9, e1000610–15. doi: 10.1371/journal.pbio.1000610 [DOI] [PMC free article] [PubMed] [Google Scholar]
- Reithler J, Peters JC, Sack AT, 2011. Multimodal transcranial magnetic stimulation: Using concurrent neuroimaging to reveal the neural network dynamics of noninvasive brain stimulation. Prog. Neurobiol 94, 149–165. doi: 10.1016/j.pneurobio.2011.04.004 [DOI] [PubMed] [Google Scholar]
- Riesenhuber M, Poggio T, 1999. Hierarchical models of object recognition in cortex. Nat. Neurosci 2, 1019–1025. doi: 10.1038/14819 [DOI] [PubMed] [Google Scholar]
- Rossion B, Jacques C, 2008. Does physical interstimulus variance account for early electrophysiological face sensitive responses in the human brain? Ten lessons on the N170. NeuroImage 39, 1959–1979. doi: 10.1016/j.neuroimage.2007.10.011 [DOI] [PubMed] [Google Scholar]
- Ruff CC, Blankenburg F, Bjoertomt O, Bestmann S, Freeman E, Haynes J-D, Rees G, Josephs O, Deichmann R, Driver J, 2006. Concurrent TMS-fMRI and Psychophysics Reveal Frontal Influences on Human Retinotopic Visual Cortex. Curr. Biol 16, 1479–1488. doi: 10.1016/j.cub.2006.06.057 [DOI] [PubMed] [Google Scholar]
- Schall JD, Morel A, Kaas JH, 2009. Topography of supplementary eye field afferents to frontal eye field in macaque: Implications for mapping between saccade coordinate systems. Vis. Neurosci 10, 385–393. doi: 10.1017/S0952523800003771 [DOI] [PubMed] [Google Scholar]
- Schall JD, Morel A, King DJ, Bullier J, 1995. Topography of visual cortex connections with frontal eye field in macaque: convergence and segregation of processing streams. J. Neurosci 15, 4464–4487. doi: 10.1523/JNEUROSCI.15-06-04464.1995 [DOI] [PMC free article] [PubMed] [Google Scholar]
- Serences JT, Yantis S, 2006. Selective visual attention and perceptual coherence. Trends. Cogn. Sci 10, 38–45. doi: 10.1016/j.tics.2005.11.008 [DOI] [PubMed] [Google Scholar]
- Shimada S, Kunii N, Kawai K, Matsuo T, Ishishita Y, Ibayashi K, Saito N, 2017. Impact of volume-conducted potential in interpretation of cortico-cortical evoked potential: Detailed analysis of high-resolution electrocorticography using two mathematical approaches. Clin. Neurophysiol 128, 549–557. doi: 10.1016/j.clinph.2017.01.012 [DOI] [PubMed] [Google Scholar]
- Shulman GL, Ollinger JM, Akbudak E, Conturo TE, Snyder AZ, Petersen SE, Corbetta M, 1999. Areas Involved in Encoding and Applying Directional Expectations to Moving Objects. J. Neurosci 19, 9480–9496. doi: 10.1523/JNEUROSCI.19-21-09480.1999 [DOI] [PMC free article] [PubMed] [Google Scholar]
- Stanton GB, Friedman HR, Dias EC, Bruce CJ, 2005. Cortical afferents to the smooth-pursuit region of the macaque monkey’s frontal eye field. Exp. Brain Res 165, 179– 192. doi: 10.1007/s00221-005-2292-z [DOI] [PubMed] [Google Scholar]
- Stolk A, Griffin S, Meij R, Dewar C, Saez I, Lin JJ, Piantoni G, Schoffelen J-M, Knight RT, Oostenveld R, 2018. Integrated analysis of anatomical and electrophysiological human intracranial data. Nature Protocols 13, 1–25. doi: 10.1038/s41596-018-0009-6 [DOI] [PMC free article] [PubMed] [Google Scholar]
- Swann NC, Cai W, Conner CR, Pieters TA, Claffey MP, George JS, Aron AR, Tandon N, 2012. Roles for the pre-supplementary motor area and the right inferior frontal gyrus in stopping action: Electrophysiological responses and functional and structural connectivity. NeuroImage 59, 2860–2870. doi: 10.1016/j.neuroimage.2011.09.049 [DOI] [PMC free article] [PubMed] [Google Scholar]
- Tallon-Baudry C, Bertrand O, Hénaff M-A, Isnard J, Fischer C, 2005. Attention modulates gamma-band oscillations differently in the human lateral occipital cortex and fusiform gyrus. Cereb. Cortex 15, 654–662. doi: 10.1093/cercor/bhh167 [DOI] [PubMed] [Google Scholar]
- Thiebaut de Schotten M, Dell’Acqua F, Forkel SJ, Simmons A, Vergani F, Murphy DGM, Catani M, 2011. A lateralized brain network for visuospatial attention. Nat. Neurosci 14, 1245–1246. doi: 10.1038/nn.2905 [DOI] [PubMed] [Google Scholar]
- Tian JR, Lynch JC, 1996. Corticocortical input to the smooth and saccadic eye movement subregions of the frontal eye field in Cebus monkeys. J. Neurophysiol 76, 2754–2771. doi: 10.1152/jn.1996.76.4.2754 [DOI] [PubMed] [Google Scholar]
- Tootell RBH, Taylor JB, 1995. Anatomical Evidence for MT and Additional Cortical Visual Areas in Humans. Cereb. Cortex 5, 39–55. doi: 10.1093/cercor/5.1.39 [DOI] [PubMed] [Google Scholar]
- Tóth E, Chaitanya G, Pati S, 2020. Mapping short-latency cortical responses to electrical stimulation of thalamic motor nuclei by increasing sampling rate - A technical report. Clin. Neurophysiol 131, 142–144. doi: 10.1016/j.clinph.2019.10.015 [DOI] [PubMed] [Google Scholar]
- Trebaul L, Deman P, Tuyisenge V, Jedynak M, Hugues E, Rudrauf D, Bhattacharjee M, Tadel F, Chanteloup-Foret B, Saubat C, Reyes Mejia GC, Adam C, Nica A, Pail M, Dubeau F, Rheims S, Trébuchon A, Wang H, Liu S, Blauwblomme T, Garcés M, De Palma L, Valentín A, Metsähonkala E-L, Petrescu AM, Landré E, Szurhaj W, Hirsch E, Valton L, Rocamora R, Schulze-Bonhage A, Mindruta I, Francione S, Maillard L, Taussig D, Kahane P, David O, 2018. Probabilistic functional tractography of the human cortex revisited. NeuroImage 181, 414–429. doi: 10.1016/j.neuroimage.2018.07.039 [DOI] [PMC free article] [PubMed] [Google Scholar]
- Umarova RM, Saur D, Schnell S, Kaller CP, Vry M-S, Glauche V, Rijntjes M, Hennig J, Kiselev V, Weiller C, 2010. Structural connectivity for visuospatial attention: significance of ventral pathways. Cereb. Cortex 20, 121–129. doi: 10.1093/cercor/bhp086 [DOI] [PubMed] [Google Scholar]
- Ungerleider LG, Desimone R, 1986. Cortical connections of visual area MT in the macaque. J. Comp. Neurol 248, 190–222. doi: 10.1002/cne.902480204 [DOI] [PubMed] [Google Scholar]
- Usami K, Korzeniewska A, Matsumoto R, Kobayashi K, Hitomi T, Matsuhashi M, Kunieda T, Mikuni N, Kikuchi T, Yoshida K, Miyamoto S, Takahashi R, Ikeda A, Crone NE, 2019. The neural tides of sleep and consciousness revealed by single-pulse electrical brain stimulation. Sleep 42, 216. doi: 10.1093/sleep/zsz050 [DOI] [PMC free article] [PubMed] [Google Scholar]
- Valentin A, Anderson M, Alarcón G, Seoane JJG, Selway R, Binnie CD, Polkey CE, 2002. Responses to single pulse electrical stimulation identify epileptogenesis in the human brain in vivo. Brain 125, 1709–1718. doi: 10.1093/brain/awf187 [DOI] [PubMed] [Google Scholar]
- van ‘t Klooster MA, Zijlmans M, Leijten FSS, Ferrier CH, van Putten MJAM, Huiskamp GJM, 2011. Time–frequency analysis of single pulse electrical stimulation to assist delineation of epileptogenic cortex. Brain 134, 2855–2866. doi: 10.1093/brain/awr211 van [DOI] [PubMed] [Google Scholar]
- Kerkoerle T, Self MW, Dagnino B, Gariel-Mathis M-A, Poort J, van der Togt C, Roelfsema PR, 2014. Alpha and gamma oscillations characterize feedback and feedforward processing in monkey visual cortex. Proc. Natl. Acad. Sci. U. S. A 111, 14332–14341. doi: 10.1073/pnas.1402773111 [DOI] [PMC free article] [PubMed] [Google Scholar]
- Vernet M, Quentin R, Chanes L, Mitsumasu A, Valero-Cabré A, 2014. Frontal eye field, where art thou? Anatomy, function, and non-invasive manipulation of frontal regions involved in eye movements and associated cognitive operations. Front. Integr. Neurosci 8, 66. doi: 10.3389/fnint.2014.00066 [DOI] [PMC free article] [PubMed] [Google Scholar]
- Xu Y, Liu J, Kanwisher N, 2005. The M170 is selective for faces, not for expertise. Neuropsychologia 43, 588–597. doi: 10.1016/j.neuropsychologia.2004.07.016 [DOI] [PubMed] [Google Scholar]
- Yamao Y, Matsumoto R, Kunieda T, Arakawa Y, Kobayashi K, Usami K, Shibata S, Kikuchi T, Sawamoto N, Mikuni N, Ikeda A, Fukuyama H, Miyamoto S, 2014. Intraoperative dorsal language network mapping by using single-pulse electrical stimulation. Hum. Brain Mapp 35, 4345–4361. doi: 10.1002/hbm.22479 [DOI] [PMC free article] [PubMed] [Google Scholar]
- Yeo BTT, Krienen FM, Sepulcre J, Sabuncu MR, Lashkari D, Hollinshead M, Roffman JL, Smoller JW, Zöllei L, Polimeni JR, Fischl B, Liu H, Buckner RL, 2011. The organization of the human cerebral cortex estimated by intrinsic functional connectivity. J. Neurophysiol 106, 1125–1165. doi: 10.1152/jn.00338.2011 [DOI] [PMC free article] [PubMed] [Google Scholar]
- Yin S, Liu L, Tan J, Ding C, Yao D, Chen A, 2017. Attentional control underlies the perceptual load effect: Evidence from voxel-wise degree centrality and resting-state functional connectivity. Neuroscience 362, 257–264. doi: 10.1016/j.neuroscience.2017.08.055 [DOI] [PubMed] [Google Scholar]
- Yoshor D, Bosking WH, Ghose GM, Maunsell JHR, 2007. Receptive fields in human visual cortex mapped with surface electrodes. Cereb. Cortex 17, 2293–2302. doi: 10.1093/cercor/bhl138 [DOI] [PubMed] [Google Scholar]
- Zhang D, Raichle ME, 2010. Disease and the brain’s dark energy. Nat. Rev. Neurol 6, 15–28. doi: 10.1038/nrneurol.2009.198 [DOI] [PubMed] [Google Scholar]
Associated Data
This section collects any data citations, data availability statements, or supplementary materials included in this article.