Abstract
Transcript alterations often result from somatic changes in cancer genomes1. Various forms of RNA alterations have been described in cancer, including overexpression2, altered splicing3 and gene fusions4; however, it is difficult to attribute these to underlying genomic changes owing to heterogeneity among patients and tumour types, and the relatively small cohorts of patients for whom samples have been analysed by both transcriptome and whole-genome sequencing. Here we present, to our knowledge, the most comprehensive catalogue of cancer-associated gene alterations to date, obtained by characterizing tumour transcriptomes from 1,188 donors of the Pan-Cancer Analysis of Whole Genomes (PCAWG) Consortium of the International Cancer Genome Consortium (ICGC) and The Cancer Genome Atlas (TCGA)5. Using matched whole-genome sequencing data, we associated several categories of RNA alterations with germline and somatic DNA alterations, and identified probable genetic mechanisms. Somatic copy-number alterations were the major drivers of variations in total gene and allele-specific expression. We identified 649 associations of somatic single-nucleotide variants with gene expression in cis, of which 68.4% involved associations with flanking non-coding regions of the gene. We found 1,900 splicing alterations associated with somatic mutations, including the formation of exons within introns in proximity to Alu elements. In addition, 82% of gene fusions were associated with structural variants, including 75 of a new class, termed ‘bridged’ fusions, in which a third genomic location bridges two genes. We observed transcriptomic alteration signatures that differ between cancer types and have associations with variations in DNA mutational signatures. This compendium of RNA alterations in the genomic context provides a rich resource for identifying genes and mechanisms that are functionally implicated in cancer.
Subject terms: Cancer genomics, Data integration
Integrative analyses of transcriptome and whole-genome sequencing data for 1,188 tumours across 27 types of cancer are used to provide a comprehensive catalogue of RNA-level alterations in cancer.
Main
For a more extensive study of cancer genome alterations, particularly in non-coding regions, the PCAWG project was formed to analyse the large number of whole-genome samples that were contributed to the ICGC and TCGA projects5. Individual projects did not use the same methods for key analyses; therefore, a major focus for each of the 16 PCAWG Working Groups was the unified analysis of the PCAWG data. For example, the PCAWG Technical Working Group led raw data collection, realignment of whole-genome sequencing data and implemented core somatic mutation calling pipelines5. Other PCAWG working groups focused on unified analyses of copy-number variation6, structural variants7,8, germline variants5, mutational signatures9 and identification of driver genes8, among others5. Here, we report the joint analysis of available matched transcriptome and genome profiling for 1,188 samples from 27 tumour types by the PCAWG Transcriptome Working Group5, providing the largest, to our knowledge, resource of RNA phenotypes and their underlying genetic changes in cancer so far (Extended Data Fig. 1, Methods, Supplementary Results, Supplementary Table 23). We demonstrate the importance of transcriptomics data in understanding how different dimensions of specific DNA alterations contribute to carcinogenesis and map out the landscape of cancer-related RNA alterations.
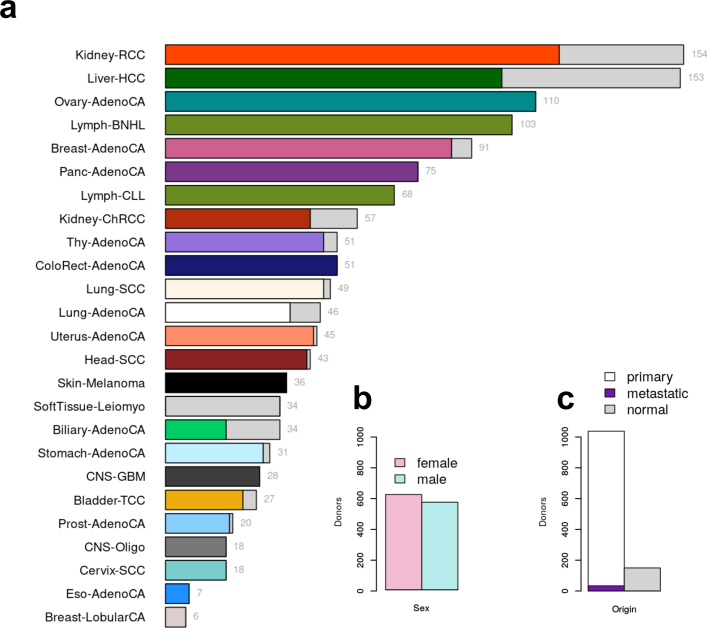
Extended Data Fig. 1. Pan-cancer expression profiling of 1,188 PCAWG donors.
a, Tumour and normal RNA-seq data from 27 histotypes. The total number of samples is shown to the right of the bars. Grey bars denote matched healthy samples. b, Number of female versus male donors. c, Total number of tumour and matched healthy samples from the PCAWG study. A subset of tumours (dark violet) was metastatic.
Cancer-specific germline cis-eQTLs
To investigate the underlying mechanisms of different types of RNA alteration, we first focused on changes in the gene expression level (Extended Data Fig. 2). We initially considered common germline variants (minor allele frequency ≥ 1%) proximal to individual genes (±100 kb), and mapped expression quantitative trait loci (eQTL) across the cohort (Extended Data Fig. 3, Supplementary Table 1). This pan-cancer analysis identified 3,532 genes with an eQTL (false discovery rate (FDR) ≤ 5%, hereafter denoted eGenes) (Supplementary Table 2), enriched in proximal regions of transcription start sites (TSSs) (Extended Data Fig. 3).
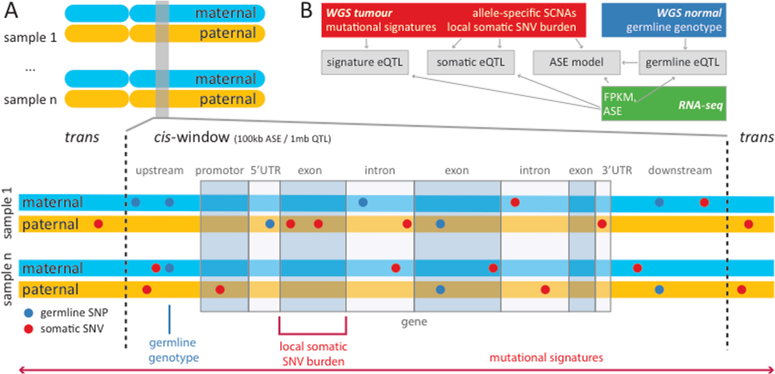
Extended Data Fig. 2. Overview of the different sources of genetic variation considered in the analysis.
a, For analyses of cis regulation, mono-allelic single-nucleotide germline variants (single nucleotide polymorphisms (SNPs), blue) were individually tested for association with total gene expression using standard eQTL approaches. Owing to their low recurrence in the cohort, somatic SNVs were aggregated in burden categories depending on their position relative to the gene tested (for example, promoter, 5′ UTR or intron). Local SNV burdens were then tested for association with ASE globally across all genes, as well as with total expression on a per-gene level using eQTL approaches. Trans effects were estimated by testing total gene expression for association with mutational and epigenetic signatures. Window sizes were 1 Mb for all somatic cis-eQTL analyses, and 100 kb for ASE and germline cis-eQTL. b, Overview of the different datasets and their contributions to the analyses described in a. Germline genotypes were derived from the matched healthy whole-genome sequencing (WGS) samples. Allele-specific SCNAs, mutational signatures and local SNV burdens were derived from the tumour WGS in comparison to the unaffected WGS samples. ASE and total expression (FPKM) were derived from the tumour and normal RNA-seq data. Arrows indicate dependencies between individual analyses carried out.
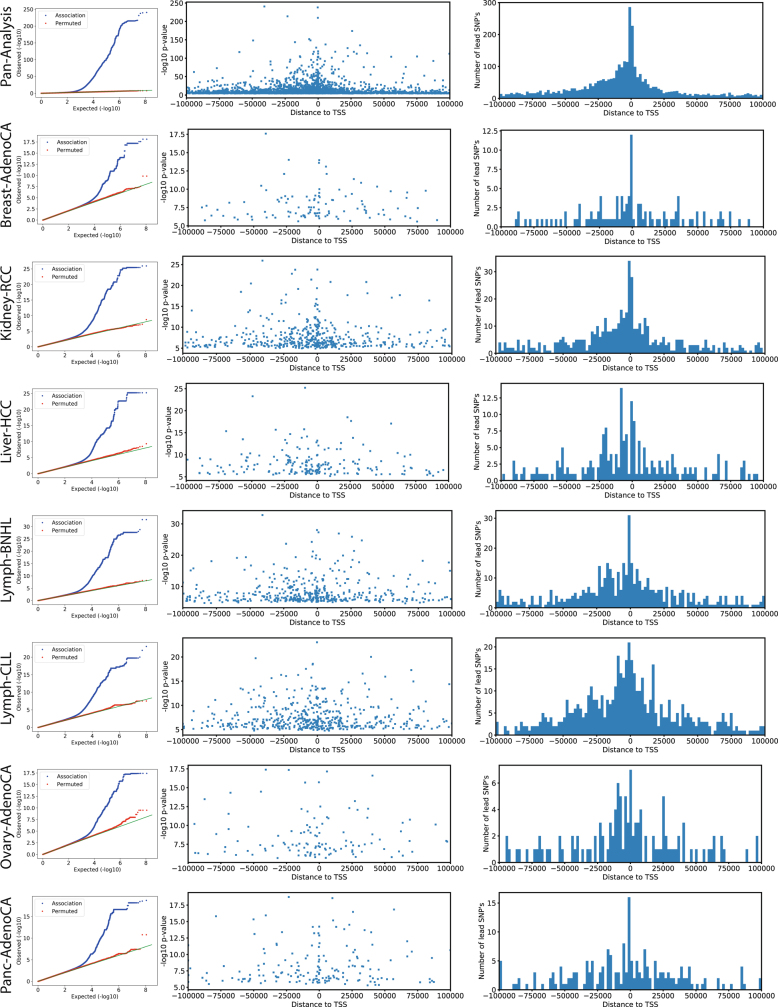
Extended Data Fig. 3. Germline eQTL lead variants.
Left, quantile–quantile (Q–Q) plot of P values of germline eQTL lead variants in the pan-cancer and histotype-specific analysis (FDR ≤ 5%, blue) and P values of the same analysis after permutation (random permutation of patients, red). Middle and right, distributions of distance to the respective TSS of all germline eQTL lead variants in the pan-cancer and histotype-specific analysis.
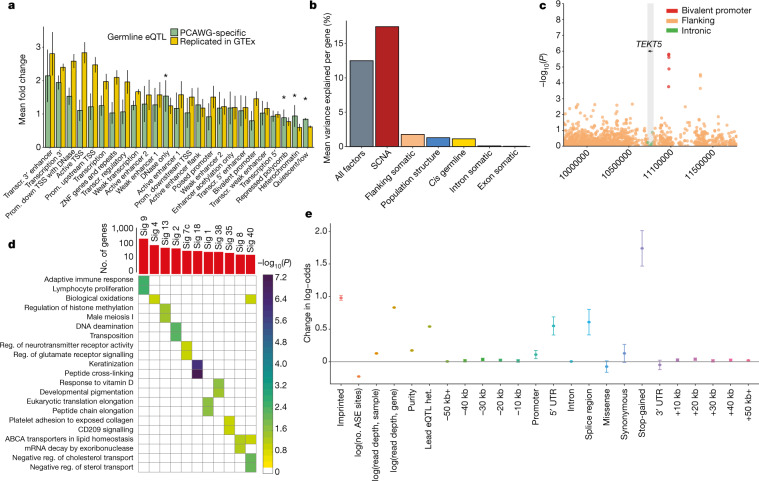
To identify cancer-specific regulatory variants, we compared our eQTLs to eQTLs from the Genotype-Tissue Expression (GTEx) project10, adopting previous strategies to assess eQTL replication11, and probed lead eQTL variants for marginal significance in GTEx tissues (P ≤ 0.01, Bonferroni-adjusted). Although most lead variants could be detected in GTEx samples (3,110 out of 3,532 eQTL variants), we identified 422 eQTLs that did not correspond to GTEx tissues, which suggests cancer-specific regulation (Extended Data Fig. 4, Supplementary Table 3). The corresponding eQTL lead variants were enriched for heterochromatic regions (Fig. 1a). Overall, this analysis revealed that the germline framework of gene expression regulation is largely conserved in cancer tissues.
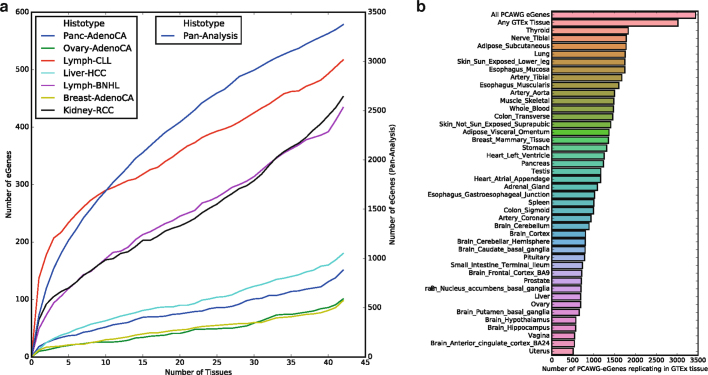
Extended Data Fig. 4. PCAWG-specific eGenes.
a, Number of PCAWG-specific eGenes in relation to eQTL replication in various numbers of GTEx tissues. b, Number of eGenes of the PCAWG pan-analysis replicating in corresponding GTEx tissues.
Fig. 1. Germline and somatic SNVs associated with expression.
a, Epigenetics Roadmap enrichment analysis, showing the average fold change in Roadmap factors across cell lines in PCAWG-specific eQTLs of the pan-analysis as well as eQTLs that replicate in GTEx tissues. *P < 0.05/25, one-sided Wilcoxon rank-sum test in PCAWG-specific eQTLs corrected for the number of Roadmap factors used (that is, 25). Data are mean and s.d. b, Variance component analysis for gene expression levels, showing the average proportion of variance explained by different germline and somatic factors for different sets of genes including the mean effect across all factors: (1) all genetic factors (germline and somatic); (2) SCNAs; (3) somatic variants in flanking regions; (4) population structure; (5) cis-germline effects; and (6) somatic intron and exon mutation effects. c, Manhattan plot showing nominal P values of association for TEKT5 (highlighted in grey), considering flanking, intronic and exonic intervals. The leading somatic burden is associated with increased TEKT5 expression (P = 1.61 × 10⁻⁶) and overlaps an upstream bivalent promoter (red dots; annotated in 81 Roadmap cell lines, including 8 embryonic stem cells, 9 embryonic-stem-cell-derived and 5 induced pluripotent stem-cell lines). d, Summary of significant associations between mutational signatures (Sig) and gene expression. Top, the total number of associated genes per signature (FDR ≤ 10%). Bottom, enriched GO categories or Reactome pathways for genes associated with each signature (FDR ≤ 10%, significance level encoded in colour, −log10-transformed adjusted P value). e, Standardized effect sizes on the presence of AEI, taking only SCNAs, germline eQTLs, coding and non-coding mutations into account. Data are the estimate and standard error of the estimate of the effect size.
Somatic cis-eQTLs in non-coding regions
Previous studies have described the landscape of non-coding mutations in cancer1, particularly in promoter regions, and also their regulatory effects on gene expression12,13. Here, we looked at possible somatic DNA changes, across the whole genome, that underlie alterations in gene expression. We estimated local mutation burdens by aggregating single-nucleotide variants (SNVs) in 2-kb intervals adjacent to genes (flanking), as well as in exons and introns (Extended Data Figs. 2, 5, 6). Next, we decomposed the expression variation of individual genes, considering common mutation burdens in cis, as well as cis germline variants and somatic copy-number alterations (SCNAs). This identified SCNAs as the major driver of expression variation (17%), followed by somatic SNVs in gene flanking regions (1.8%) and germline variants (1.3%) (Fig. 1b).
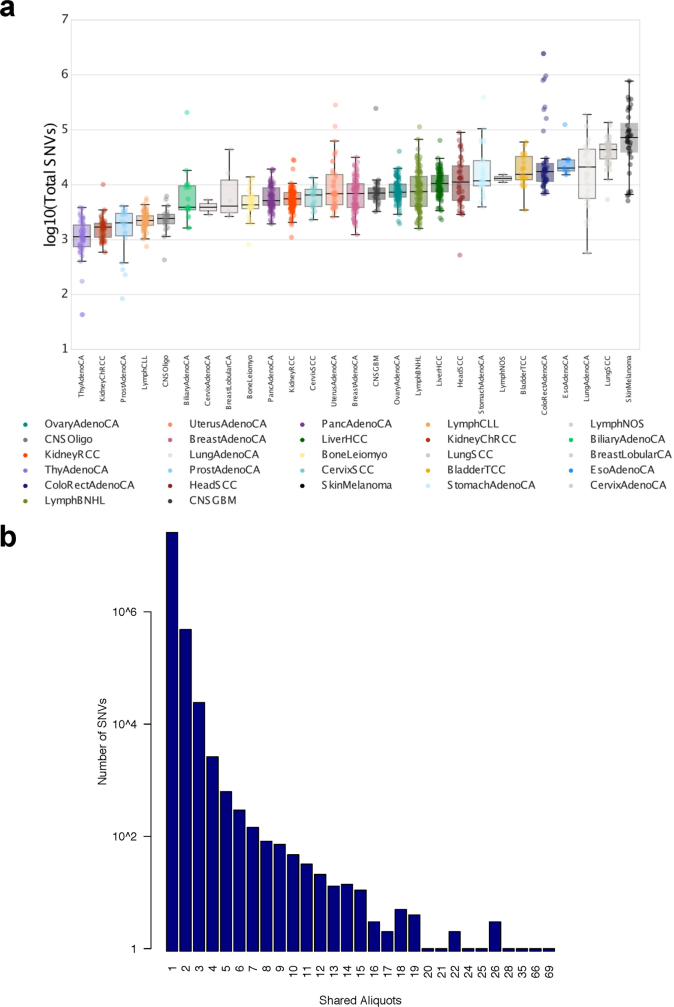
Extended Data Fig. 5. Cis-mutational somatic burden.
a, Total number of somatic mutational load per cancer type. Median numbers of SNVs range from 1,139 in thyroid adenocarcinoma to 72,804 in skin melanoma. b, Number of recurrent somatic SNVs shared by increasing numbers of patients. A small fraction of 86 SNVs is detected in more than 1% of the cohort (12 patients).
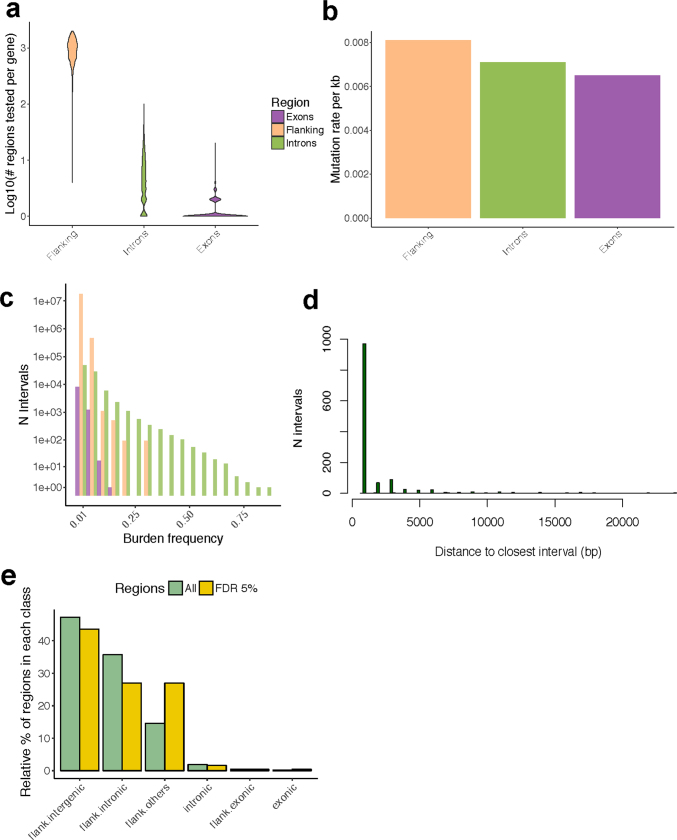
Extended Data Fig. 6. Somatic mutation rate and burden frequency by type of region tested.
a, Number of mutated regions tested per gene with somatic burden frequency ≥ 1%. b, Mutation rate per kilobase. c, Burden frequency, stratified by the type of interval tested (flanking, exonic or intronic). d, Distribution of distances (bp) of the leading intervals (FDR ≤ 5%) to the closest (left and right) interval such that the association P value decreases by at least one order of magnitude (99% of the distribution is shown). e, Breakdown of all genomic regions tested (n = 1,049,102 with burden frequency ≥ 1%) and of the 567 genomic regions that underlie the observed somatic cis-eQTL at a FDR of 5% (intronic denotes eGene intron; exonic denotes eGene exon; flank. denotes 2-kb flanking region within 1 Mb distance to the eGene start and end; flank.intergenic denotes flanking region in a genomic location without gene annotations; flank.intronic denotes flanking region overlapping an intron of a nearby gene; and flank.others denotes flanking region partially overlapping several annotations of a nearby gene).
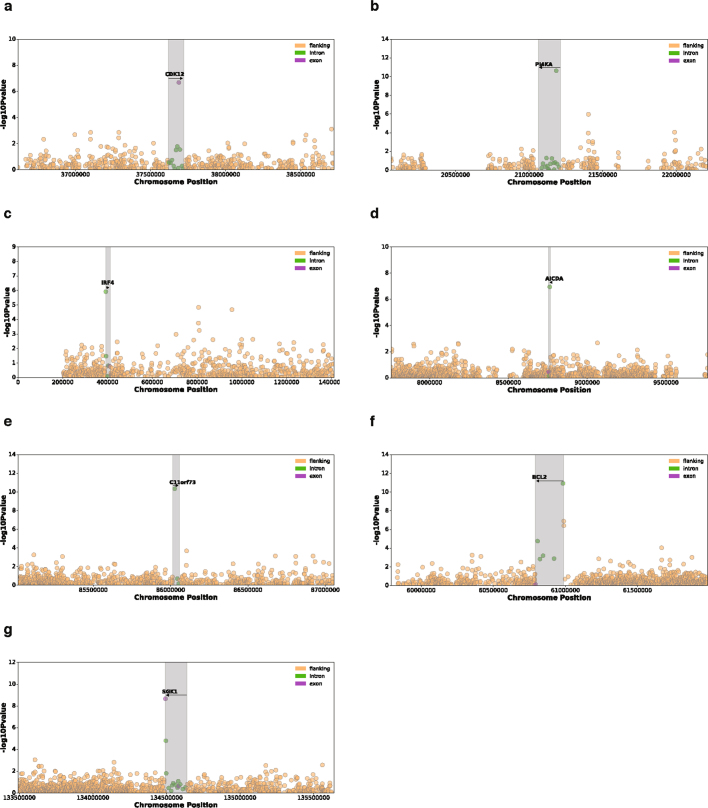
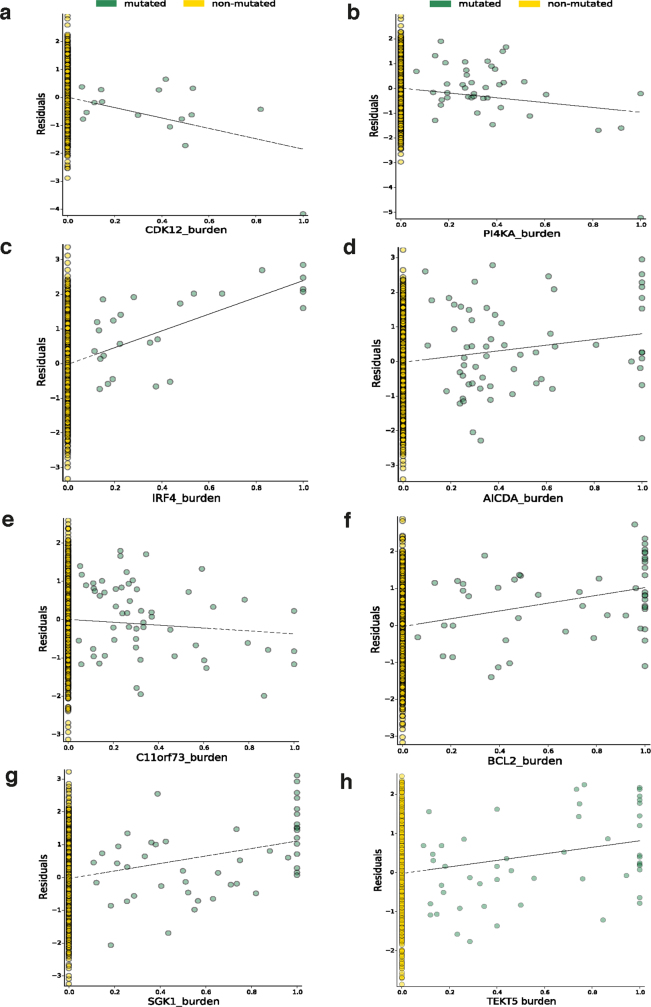
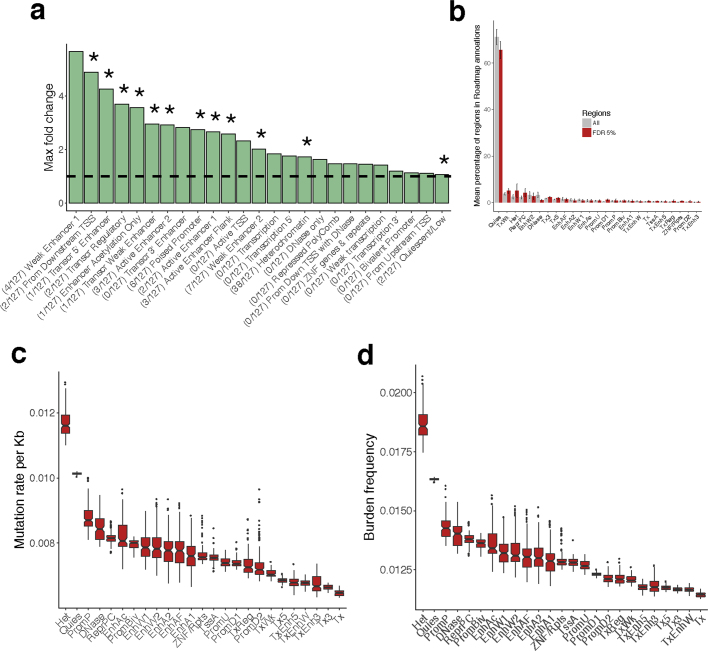
We also tested for associations between all common mutation burdens and gene expression across the whole genome. We identified 649 genes with a somatic eQTL (FDR ≤ 5%) (Supplementary Table 5). Of these, 11 associations were located in introns or exons of the respective eGene, including genes with known roles in the pathogenesis of specific cancers such as CDK12 in ovarian cancer14 and IRF4 in chronic lymphocytic leukaemia15 (Extended Data Figs. 7, 8). Most eQTLs (68.4%) involved associations with flanking non-coding mutation burdens (Extended Data Fig. 6e). Next, we considered eQTLs in flanking regions (n = 556) and tested for enrichment in cell-type-specific annotations from the Epigenetics Roadmap16. This identified 13 enriched annotations (FDR ≤ 10%) (Extended Data Fig. 9, Supplementary Table 6), including poised promoters, weak and active enhancers, and heterochromatin, but notably no enrichment for transcription-factor-binding sites (Supplementary Table 7). This enrichment in transcriptionally inactive regions may be due to an increased mutation rate in these regions (Extended Data Fig. 9), which has previously been reported in cancer17.
Extended Data Fig. 7. Manhattan plots of seven somatic eGenes associated with genic lead burden.
Altogether, 11 genic somatic eQTLs showed significant changes in gene expression associated with somatic burdens within the gene boundaries (intronic or exonic). The seven genes shown here are known to be important in the pathogenesis of specific cancers. a, CDK12. b, PI4KA. c, IRF4. d, AICDA. e, C11orf73 (also known as HIKESHI). f, BCL2. g, SGK1.
Extended Data Fig. 8. Scatter plots of eight somatic eGenes.
Plots show the effect of the lead weighted burden on the gene expression residuals (obtained as described in the Methods) of these genes. a, CDK12. b, PI4KA. c, IRF4. d, AICDA. e, C11orf73. f, BCL2. g, SGK1. h, TEKT5.
Extended Data Fig. 9. Roadmap epigenome marks overlapping flanking intervals with somatic burden.
a, Maximum fold enrichment of epigenetic marks from the Roadmap Epigenomics Project across 127 cell lines. The number of cell lines with significant enrichments is indicated in parentheses (FDR ≤ 10%); asterisks denote significant enrichments in at least one cell line. b, Mean percentages (over the 127 cell lines) of regions overlapping (by at least 10% of their length) Roadmap epigenome marks, calculated using all genomic flanking regions (n = 1,637,638) and the subset of 556 flanking intervals associated with somatic eQTL (FDR ≤ 5%). c, Mutation rate per kilobase. d, Burden frequency (across the 127 cell lines) of the 556 flanking intervals in somatic eQTLs (FDR ≤ 5%), overlapping 25 Roadmap epigenome marks. DNase, DNase only; EnhA, active enhancer; EnhAc, enhancer acetylation only; EnhAF, active enhancer flank; EnhW, weak enhancer; Het, heterochromatin; PromBiv, bivalent promoters; PromD, promoter downstream; PromP, poised promoters; PromU, promoter upstream; Quies, quiescent/low; ReprPC, repressed PolyComb; TssA, active TSS; TxReg, transcription regulatory; ZNF/Rpts, ZNF genes and repeats; Tx, transcription; Tx3, transcription 3′, Tx5, transcription 5′; TxEnh3, transcription 3′ enhancer; TxEnh5, transcription 5′ enhancer; TxEnhW, transcription weak enhancer; TxWk, weak transcription.
We also looked at the functional characterization of somatic eGenes and observed an enrichment for somatic eQTLs in bivalent promoters for cancer testis genes (P = 0.04, Fisher’s exact test) such as TEKT518 (Fig. 1c, Extended Data Fig. 8h). Furthermore, we found a global enrichment (FDR ≤ 10%) for Gene Ontology (GO) categories related to cell differentiation and developmental processes (Supplementary Table 8). Overall, somatic eQTL analysis identified mostly non-coding regions associated with changes in local gene expression and, similar to cancer-specific germline eQTLs, showed enrichment for transcriptionally inactive regions such as heterochromatin.
Expression and mutational signatures
Global variations in mutational patterns can be quantified using mutational signatures, which tag mutational processes specific to their tissue-of-origin and environmental exposures19. However, the extraction of mutational signatures is an intrinsically statistical process that requires a posteriori functional annotation. We performed a pan-cancer association analysis between genome-wide mutational signatures and gene expression levels to decipher the molecular processes that accompany the presence of mutational signatures.
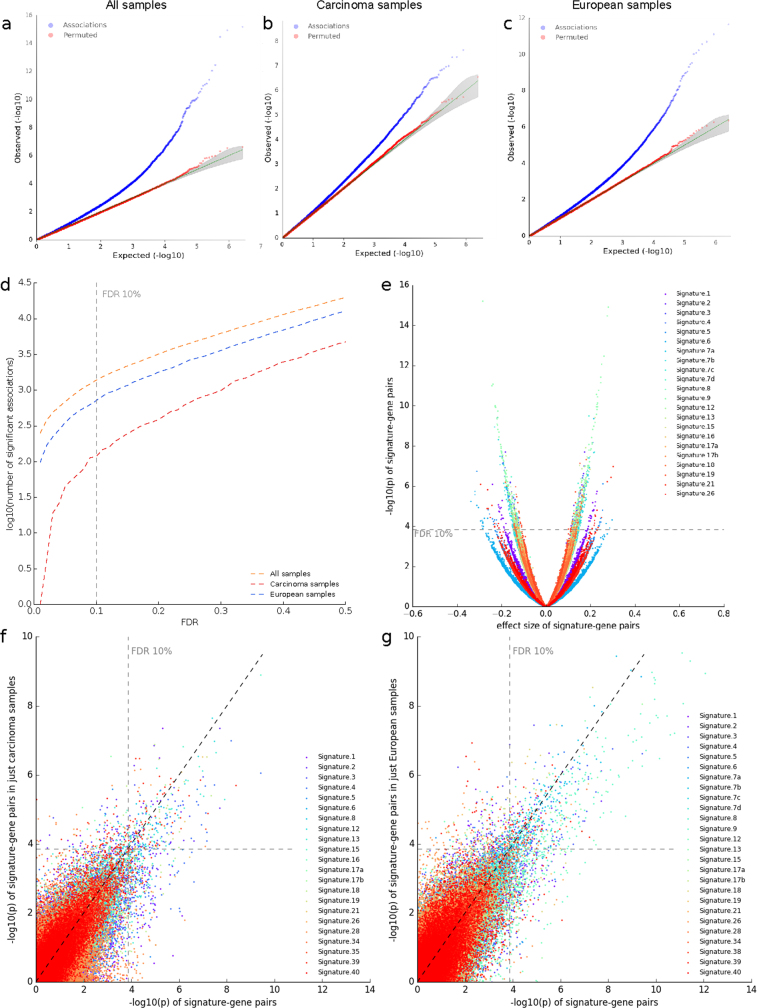
We considered 28 mutational signatures derived using non-negative matrix factorization of context-specific mutation frequencies9. We tested for association between signature prevalence in donors and total gene expression, accounting for total mutational burden, cancer type, and other technical and biological confounders. This identified 1,176 genes associated with at least one signature (FDR ≤ 10%) (Extended Data Fig. 10, Supplementary Table 19).
Extended Data Fig. 10. Quality control of the association studies between gene expression and mutational signatures.
a–c, Q–Q plots of the P values of the linear model to associate expression of 18,831 genes with 28 mutational signatures across all 1,159 patients (a), 877 patients with carcinoma (b), or 891 European patients (c). d, Number of significant associations (log10-transformed) at different FDR thresholds (across all patients, patients with carcinoma and European patients). e, Volcano plot of directionality of effects in the analysis of all patients. f, g, Comparison of analyses between all patients and patients with carcinoma (f) and between all patients and European patients (g). The −log10(P values) per signature–gene pair are correlated (r = 0.763 (f) and r = 0.789 (g), Pearson correlation coefficient), especially above an FDR threshold of 10%.
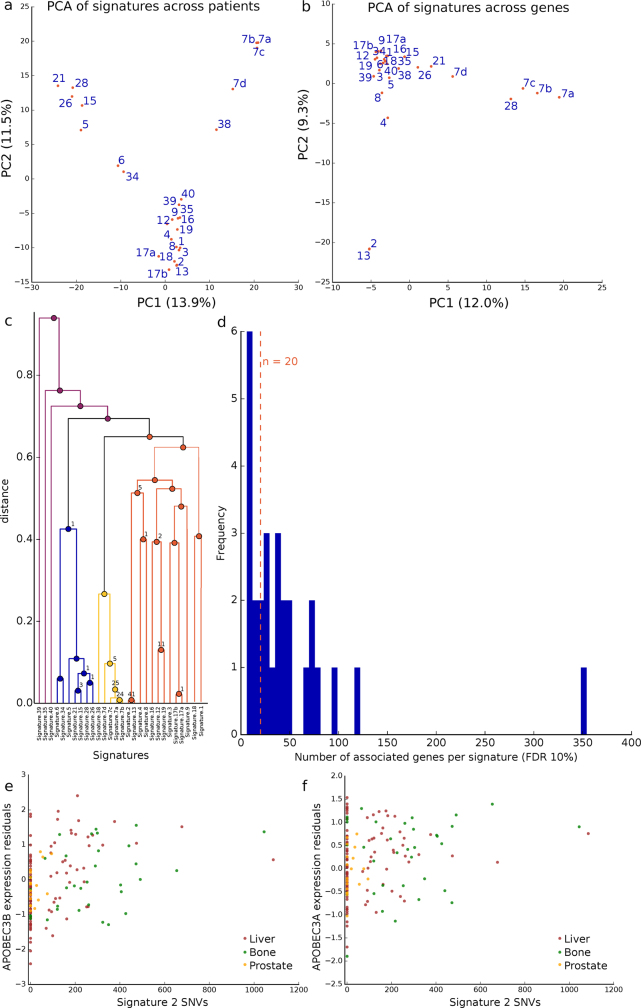
We considered 18 signatures with 20 or more associated genes for further annotation (Extended Data Fig. 11) and assessed enrichment using GO categories20 and Reactome pathways21. We found that 11 signatures were enriched for at least one category (FDR ≤ 10%) (Supplementary Table 19), revealing associations consistent with known and unknown aetiologies (Fig. 1d). For example, signature 38, which is correlated with the canonical UV signature 7 (r2 = 0.375, P = 5 × 10−40) (Extended Data Fig. 11c), was linked to melanin processes (Fig. 1d). The synthesis of melanin causes oxidative stress to melanocytes22, and we found signature 38 associated with the oxidative-stress-promoting gene TYR23 (P = 1.0 × 10⁻⁴). A hallmark of signature 38 genes are C>A mutations, a typical product of reactive oxygen species24. This suggests that signature 38 may capture DNA damage that is indirectly caused by UV-induced oxidative damage after direct sun exposure25, with TYR as a possible mediator of the effect.
Extended Data Fig. 11. Relationship between mutational signatures and gene expression patterns.
a, b, Principal component analysis (PCA) of signatures across 1,159 patients (PCA on signature-specific SNVs per patient) (a) and signature–gene expression associations across 18,831 genes (PCA on adjusted P values of signature–gene expression associations) (b). The PCA on the SNVs recapitulates known interdependencies, for example, between signatures 7, whereas the PCA on the signature–gene association studies also emphasizes functional relatedness, for example, between signatures 2 and 13. c, Hierarchical clustering of signatures. The numbers at the nodes indicate the number of genes commonly associated with two to four respective signatures. The dendrogram shows genes that are associated with more than one signature mostly owing to similar SNV patterns of these signatures across patients. d, Frequency of number of significantly associated genes per signature (FDR ≤ 10%). Although many signatures are significantly associated with a few genes, 18 signatures are associated with more than 20 genes. Signature 9 is associated with more than 350 genes. Vice versa, 1,009 genes are associated with only one signature, 129 with two, 32 with three, 5 with four and 1 with five signatures. e, f, Mutational signature–gene associations, depicting positive associations between the expression of the canonical APOBEC pathway genes APOBEC3B (e) and APOBEC3A (f) and signature 2. The associations within the three cancer type with the strongest correlation between signature and gene expression (hepatocellular carcinoma (Liver–HCC), bone leiomyosarcoma (Bone–Leiomyo) and prostate adenocarcinoma (Prost–AdenoCA)) are shown.
Genomic basis of allelic expression
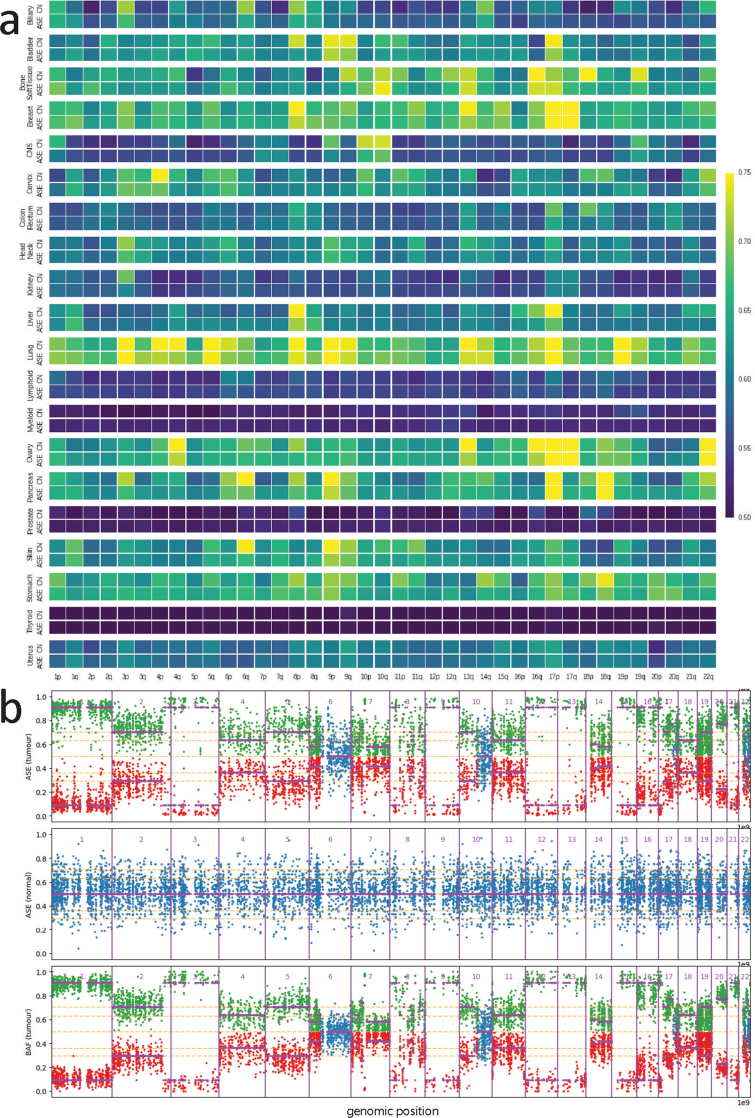
To analyse expression at the level of individual haplotypes, we tested for allelic expression imbalance (AEI) (FDR ≤ 5%, binomial test). We observed substantial differences in the fraction of genes with AEI between different types of cancer (Extended Data Fig. 12), and between cancer and the corresponding healthy tissues, with a high observed concordance between allelic imbalance at the DNA and RNA levels (Extended Data Fig. 13).
Extended Data Fig. 12. ASE analysis.
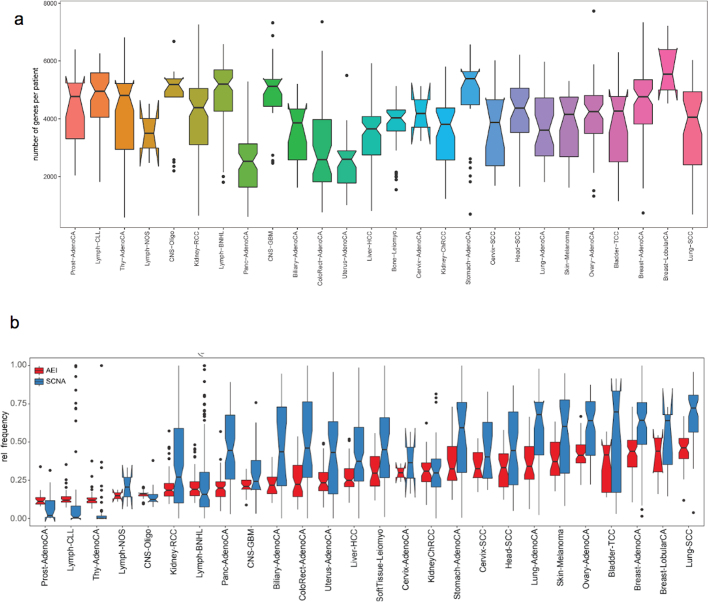
a, All types of cancer are ordered by the average AEI frequency. The numbers of genes per patient for which ASE could be quantified are shown, stratified according to cancer type, resulting in between 588 and 7,728 genes per patient. b, Distribution of the fraction of genes with AEI (red) and SCNAs (blue) over the number of measurable genes for each patient across the cohort. Cancer types with high chromosomal instability also exhibit highest amounts of AEI.
Extended Data Fig. 13. SCNAs as major driver for allelic dysregulation in cancer.
a, Absolute allelic expression imbalance closely follows allelic imbalance at the genomic level. Values of 0.5 (blue) denote equal number of reads from both alleles. Values of 1 (yellow) reflect mono-allelic expression or regions with loss of heterozygosity. b, Comparison between B-allele frequency (BAF) and ASE ratios from a single patient with lung cancer (LUAD-US) with profound chromosomal instability shows strong correlation between allelic imbalance on expression and genomic levels.
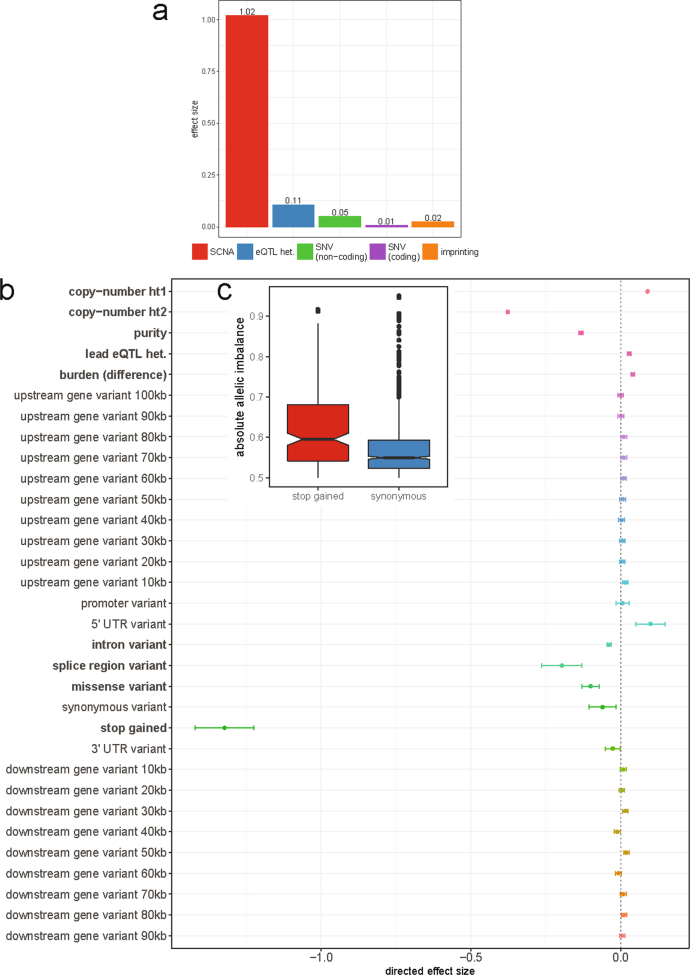
We used a logistic regression model to identify the determinants of AEI, accounting for known imprinting status26, the germline eQTL genotype, SCNAs and the weighted mutational burden of proximal somatic SNVs stratified into functional categories (Extended Data Fig. 2). In aggregate, SCNAs accounted for 84.3% of the total explained variation, which confirmed our findings from the somatic eQTL analysis, followed by germline eQTL lead variants (9.1%), somatic SNVs (4.9%) and imprinting status (1.7%) (Extended Data Fig. 14). Although cumulatively, non-coding variants were more relevant than coding variants, somatic protein-truncating variants (‘stop-gained’ variants) that triggered nonsense-mediated decay27 were the most predictive individually. SNVs within splice regions, 5′ untranslated regions (UTRs) and promoters were also strongly associated with the presence of AEI, and we observed a global trend of decreasing relevance of variants with increasing distance from the TSS (Fig. 1e, Extended Data Fig. 14).
Extended Data Fig. 14. Determinants of AEI.
a, Standardized effect sizes on the presence of AEI, taking only SCNAs, germline eQTLs, coding and non-coding mutations into account. In summary, SCNAs accounted for 86.1% of the total effect size, followed by germline eQTLs (9.0%) and somatic SNVs (4.8%). b, Relevance of individual somatic mutation types (‘copy-number ht1’ and ‘copy-number ht2’ as local allele-specific SCNAs of haplotypes 1 and 2, respectively), germline eQTLs and other covariates for the ASE ratio. Significant covariates (FDR ≤ 5%) are highlighted in bold. c, Comparison of the effect of protein-truncating variants (stop-gained) and synonymous variants on the ASE ratio.
Gene-centric attribution of AEI to individual sources of genetic variation (Supplementary Table 9) revealed an enrichment of somatically induced AEI in several known cancer-driver genes, as well as new candidates, such as the mismatch-repair-related gene EXO1 that is associated with survival in colorectal adenocarcinoma (log-rank P = 0.022, hazard ratio = 0.57) (Supplementary Results). We further observed a strong enrichment in the AEI score of cancer testis genes based on somatic SNVs only (χ2 test P = 6 × 10⁻³). In summary, we identify somatic and germline genetic variation that is associated with allele-specific dysregulation of genes across cancer types.
Mutations associated with promoter usage
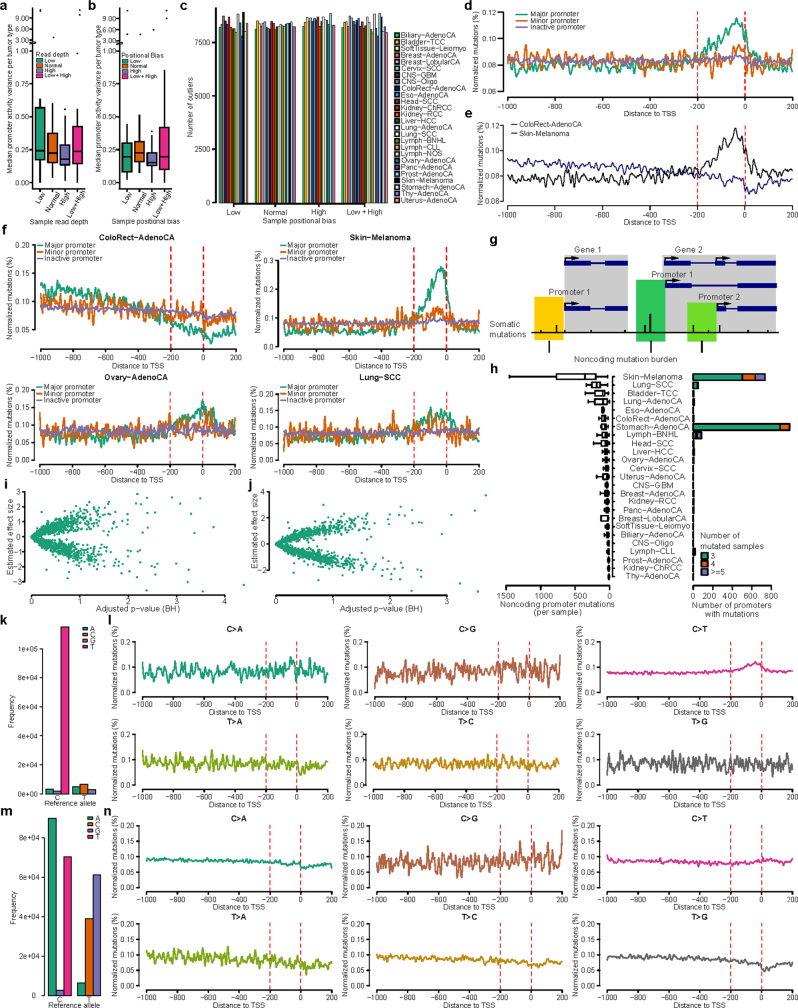
We considered promoter activity28–30 as another molecular phenotype to study the effect of promoter mutations. Although cancer-specific alternative promoter usage has previously been shown28, the association of underlying genomic alterations with promoter activities have not been broadly explored. To estimate the activity of individual gene promoters, we combined the expression of isoforms initiated in TSSs that are identical or nearby, assuming that these are transcribed from the same promoter (Extended Data Fig. 15a–c). We divided promoters into three categories: (1) inactive promoters (activity < 1 fragment per kilobase of transcript per million mapped reads (FPKM)), (2) major promoters (most active per gene) and (3) minor (all remaining) promoters, and examined the rates of mutation across varying activity levels. We observed an increase in the number of mutations near the TSS of major promoters compared with minor or inactive promoters (Extended Data Fig. 15d). This pattern is most prominent in skin melanoma, in which it has been attributed to impaired nucleotide-excision repair (Extended Data Fig. 15e, f, k, l). The cancer type that shows the strongest deviation from this pattern is colorectal adenocarcinoma, which highlights the tissue-specificity of mutational patterns at promoters (Extended Data Fig. 15e, f, m, n). Only 171 promoters show mutations in more than 5 samples per tumour type in a 200-bp window upstream of the promoter (Extended Data Fig. 15g, h). Most mutations occur in skin melanoma and lymphoma, which is expected owing to reduced nucleotide-excision repair and activation-induced cytidine deaminase (Extended Data Fig. 15h). We did not find significant pan-cancer associations between promoter mutational burden and promoter activity (Extended Data Fig. 15i, j). However, TERT has the highest number of promoter mutations1,5,31 (Extended Data Fig. 16a), and these mutations have previously been reported to be associated with TERT expression1; therefore, we investigated the TERT locus in more detail (Extended Data Fig. 16b). Although TERT does not show a significant association in the pan-cancer analysis, we found an association with increased promoter activity in individual types of cancer1 (Extended Data Fig. 16c).
Extended Data Fig. 15. Overview of estimations of promoter activity and non-coding promoter mutations associations and patterns.
a, b, The technical variation of the promoter activity estimates across varying library depth (a) and positional bias (b). c, The number of outlier promoters per tumour type according to promoter activity variance (variance larger than 1.5 × the interquartile range). d, Distribution of promoter mutations around promoters across the PCAWG cohort for major, minor and inactive promoters. Red lines indicate the window 200-bp upstream of a TSS, in which major promoters show an enrichment of mutations whereas minor and inactive promoters do not. e, Distribution of promoter mutations around promoters for the top two most mutated types of cancer (skin melanoma and colorectal adenocarcinoma (ColoRect–AdenoCA)). Colorectal adenocarcinoma displays a very different mutational pattern from other types of cancer. f, Distribution of promoter mutations around major, minor and inactive promoters across several types of cancer. Red lines indicate the window 200-bp upstream of a TSS, in which major promoters show an enrichment of mutations whereas minor and inactive promoters do not. g, Schematic of the calculation of non-coding promoter mutational burden. h, Overview of non-coding promoter mutations per sample and the number of mutated promoters per tumour type for promoters with at least three mutated samples. i, j, Association of absolute (i) and relative (j) promoter activity with promoter mutations across all samples. k, l, Overview of promoter mutations for skin melanoma tumours. k, Most promoter mutations are C>T, which indicates UV-induced DNA damage. l, Distribution of promoter mutations for each mutation class reveals the enrichment of C>T mutations around the 200-bp window upstream. m, n, Overview of promoter mutations for colorectal adenocarcinoma tumours. m, Most promoter mutations are C>A and C>T. n, Distribution of promoter mutations for each mutation class does not display an enrichment of mutations around the 200-bp window upstream, differing from the mutation pattern of skin melanoma tumours.
Extended Data Fig. 16. TERT promoter mutations.
a, Promoters ranked by the number of mutated samples across all types of cancer in a 200-bp window. Asterisk indicates cancer census genes. b, The TERT locus and number of mutations observed at each position. The first promoter shows a highly recurrent non-coding mutation reported previously118,119. c, Comparison of TERT promoter activity for mutated and non-mutated samples per tumour type.
Mutations associated with splicing
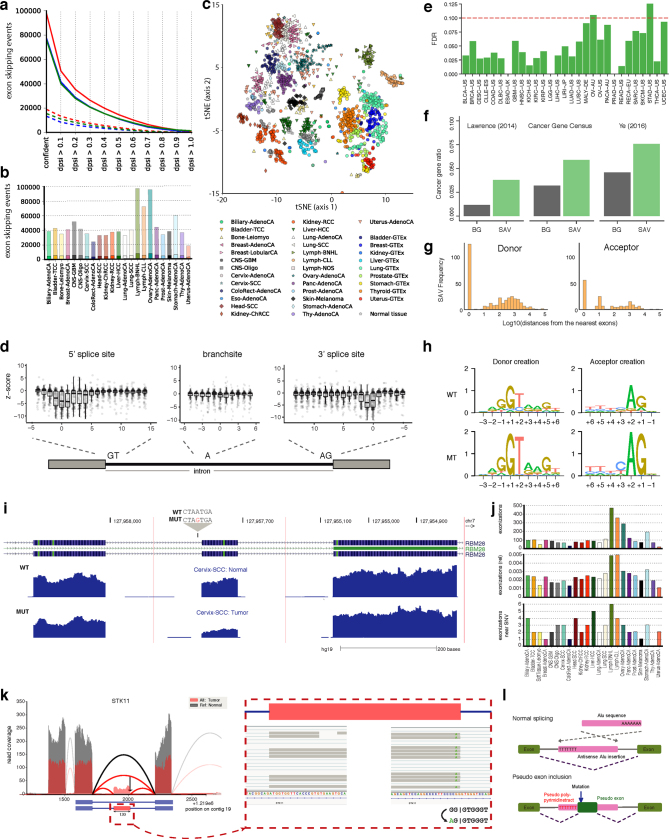
Extending the classical hallmarks of cancer, alternative splicing is seen as increasingly relevant to explain cancer heterogeneity32. On the basis of our observations of a globally changing splicing landscape (Extended Data Fig. 17a–c), we sought to specifically understand the relationship between splicing changes and somatic mutations within introns. Focusing on cassette exon events, we integrated the quantification of splice events with somatic variants and identified 5,282 mutations near exon–intron boundaries, 1,800 (34%) of which were associated with a change in splicing (|z-score| ≥ 3) (Supplementary Table 10). Consistent with previous findings using exome sequencing33,34, most mutations overlapping the essential dinucleotide motifs of the acceptor or donor site are associated with a splicing change—61% or 57%, respectively (Fig. 2a). Nearly one-third of all mutations (226 out of 469) in a 5-nucleotide window downstream of the 5′ site were significantly enriched for splicing changes (Fig. 2a). Almost all changes significantly associated with somatic mutations had a negative effect on splicing (96%) (Extended Data Fig. 17d). For mutations in or near the poly-pyrimidine tract, we found a significant (permutation test, P < 0.05) enrichment for mutations linked to outlier splicing (Fig. 2a). We also found an enrichment (P < 0.05, fold change > 2) of splicing outliers at branch-site adenosines (Fig. 2a middle, Extended Data Fig. 17d, Supplementary Table 11). Together, these results suggest that somatic mutations in the extended splice site region, poly-pyrimidine tract and branch point can affect splicing.
Extended Data Fig. 17. Alternative splicing and association with somatic mutations.
a, Number of exon-skipping events confirmed at different ΔPSI thresholds in tumour (red), matched healthy (green) and GTEx (blue) samples for liver tissue. Dashed lines show the subset of exon-skipping events that only contain annotated introns. b, Number of exon-skipping events confirmed at a ΔPSI level of greater than 0.3 for the individual histotypes. Transparent section of bars represents the fraction of novel events, containing at least one unannotated intron. c, Splicing landscape for exon-skipping events. t-SNE analysis based on exon-skipping PSI values for all ICGC tumour and healthy samples together with tissue-matched GTEx samples. d, Position-specific effect of somatic mutations on alternative splicing. Magnitude and direction of mutation-associated splicing alterations. e, Permutation-based FDR values for SAV detection based on the different types of cancer. f, Cancer gene set enrichment for SAV sets, shown for cancer census gene set (middle) and sets determined in ref. 48 (left) and ref. 120 (right). g, Positional distributions (logarithms of distance from the nearest exons) of somatic variant creating novel splicing donors and acceptors. h, Sequence motif logos around somatic mutation creating novel splicing motifs. i, Example splicing effect of a branch-point mutation. UCSC genome browser RNA-seq coverage plots of cassette exon event in RBM28 between mutant and wild type. Mutant (bottom track) contains an A>G mutation 29 nucleotides upstream from the acceptor site of an affected exon. j, Distribution of new cassette exon events detected only within the PCAWG cohort. Top, number of events per histology type. Middle, events normalized to the total number of cassette exons detected in the histology types. Bottom, the number of exonization events per histotype for the subset with the novel cassette exons colocated to a somatic alteration near the acceptor or donor of the exon. k, Example of an exonization event in the tumour-suppressor gene STK11. RNA-seq read coverage for a part of the gene is shown in red for a donor carrying the alternate allele and in grey for a random donor with reference allele. The cassette exon event is shown as a schematic below, with blue (red) boxes denoting constitutive (alternative) exons and blue solid lines denoting introns. Magnified panels at the bottom show details from Integrative Genomics Viewer visualization, highlighting a somatic mutation at the 3′ end of the cassette exon. The associated sequencing change is illustrated on the bottom right corner, in which the vertical bar denotes the exon–intron boundary. l, Alu-based exonization mechanism. Top, the presence of an Alu element in an intron in antisense alone will still result in normal splicing. Bottom, specific mutations of the Alu sequence creates new splice sites and results in exonization.
Fig. 2. Position-specific effect of somatic mutations on alternative splicing.
a, Top, proportion of mutations near exon–intron junctions and at branch sites that are associated with exon-skipping events. Mutations with associated splicing changes are those in which the percentage spliced in-derived |z-score| is ≥ 3 (dark blue). Asterisks denote intron positions significantly enriched for splicing changes relative to background based on a permutation test. *P < 0.05, **P < 0.01, ***P < 0.001. Bottom, sequence motifs of regions. b, Example of an exonization event in the tumour-suppressor gene STK11. The RNA-seq read coverage for a part of the gene is shown in red for a donor carrying the alternative allele, and in grey for a random donor with reference allele. The cassette exon event is shown as a schematic below. c, Enrichment of SINE elements in SAVs compared to sequence background (BG). Shown for SINE elements overlapping in sense (middle) and antisense (right) directions.
We also identified 1,900 rare splicing-associated variants (SAVs) that appear in only a small number of samples using the SAVNet approach35 (Extended Data Fig. 17e; see ‘Data availability’ in the Methods). Notably, 862 SAVs affected canonical splice sites, whereas the other 1,038 disrupted non-canonical sites or created new splice sites. Notably, we find a twofold enrichment of cancer genes in SAVs (Extended Data Fig. 17f).
Although we find that those SAVs that create splice sites strongly concentrate near exon–intron boundaries (Extended Data Fig. 17g), 45.9% of SAVs are further than 100 bp away from the nearest annotated exon. Mutations at those sites generally changed the sequences towards the donor or acceptor motif consensus (Extended Data Fig. 17h). Focusing on novel splice sites deep in introns, we analysed the extent of exonizations—that is, the formation of new exons within an intron (Extended Data Fig. 17j, Supplementary Tables 13, 14). More than one-fifth of these new exons (9 out of 43) occur in cancer-related genes, such as the well-known tumour-suppressor gene STK11. As expected, the exonization event would cause a frameshift in STK11 (Fig. 2b, Extended Data Fig. 17k).
Alu elements that are inserted in an antisense direction have sequences that resemble consensus splice sites that, together with activating mutations, can lead to the formation of a new exon36 (Extended Data Fig. 17l). We found a significant enrichment of splice-site-creating SAVs within annotated Alu sequences (P = 2.8 × 10⁻⁹), particularly in the antisense direction (P = 2.6 × 10⁻¹⁵) (Fig. 2c). Our results indicate that the exonization of Alu sequences, which has been extensively studied in the context of primate genome evolution, is also observed in cancer genome evolution.
Patterns of gene fusions across cancer
Gene fusions are an important class of cancer-driving event with therapeutic and diagnostic value37. We identified a total of 925 known and 2,372 new cancer-specific gene fusions by combining the output of two fusion discovery methods as well as genomic rearrangement (structural variants) information and excluding artefacts or fusions in non-cancer samples38 (Fig. 3a). For the 3,540 identified fusion events representing 3,297 unique gene fusions, we categorized them on the basis of novelty, recurrence and known oncogenic gene partners (Fig. 3a).
Fig. 3. Structural rearrangements associated with RNA fusions.
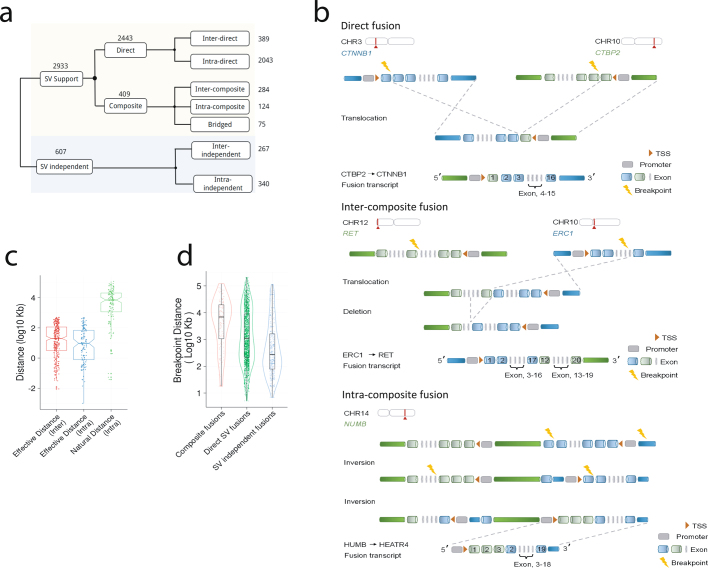
a, The number of all detected and new fusions and their overlap with the cancer census genes. b, Schematic of an example of bridged fusions. Bridged fusions are those composite fusions formed by a third genomic segment that bridges two genes. Only one of the possible orders of genomic arrangement is depicted in each case, with break points highlighted as thunderbolts.
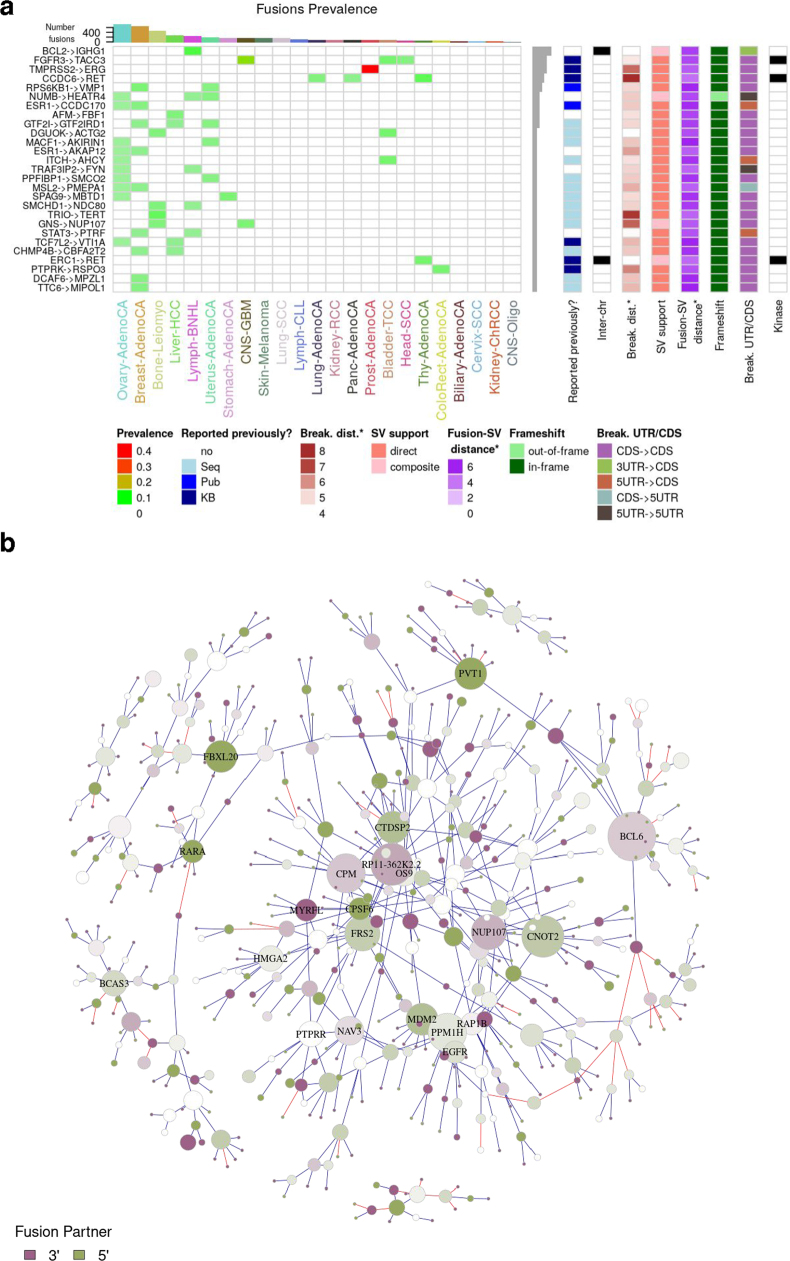
Only 149 (approximately 5%) of the fusions occur in more than one sample, among which 78 are novel. Most of these (46 out of 78) were found across several histotypes. Of the 27 most recurrent gene fusions (Extended Data Fig. 18a), 8 have previously been reported (for example, CCDC6-RET39, FGFR3-TACC340 and PTPRK-RSPO3) or independently detected in the TCGA cohort41, whereas 6 were new (such as NUMB-HEATR4, ESR1-AKAP12 and TRAF3IP2-FYN). In total, 105 fusion transcripts involved the UTR region of one gene and the complete coding sequences of another gene, possibly resulting from structural variation in promoter regions.
Extended Data Fig. 18. Recurrent and promiscuous RNA fusions.
a, Features of the 27 most recurrent in-frame or open-reading-frame-retaining fusions. Kinase column indicates whether one of the gene partners is a kinase gene b, Network with connected clusters of at least 10 genes. Genes are represented as nodes, and the size of a node is proportional to the number of gene-fusion partners. Two nodes are connected if one fusion was detected involving the two genes: an edge is coloured blue if the fusion has evidence for matched structural rearrangements and is coloured red otherwise. Nodes and connections are shown only between promiscuous genes. The colour intensity indicates whether a gene is involved more often in a fusion as a 3′ (purple) or 5′ (green) gene or both (white).
Although most genes involved in fusions engaged with only one fusion partner, 35 genes had more than 5 partners. These ‘promiscuous’ genes tended to be selective in being either a 5′ or a 3′ partner with conserved break points and positions (3′ or 5′), and were overrepresented in cancer census genes and the PCAWG cancer-driver genes (one-tailed Fisher’s exact test, odds ratio = 8.66, P ≤ 1.1 × 10⁻¹⁵, and odds ratio = 12.27, P ≤ 2.2 × 10⁻¹⁶, respectively). Network analysis of promiscuous genes and their partners revealed several large gene clusters containing at least 10 genes (Extended Data Fig. 18b), enriched in cancer-related pathways (Benjamini–Hochberg corrected P ≤ 0.01) and in protein–protein interactions (P ≤ 1.0 × 10⁻⁷), which suggests a possible functional role in cancer.
Notably, a large number of fusions, including known fusions, could not be associated with only a single structural-variation event. For example, the ETV6-NTRK3 gene fusion42 was present in a head and neck thyroid carcinoma sample, linking exon 4 of ETV6 to exon 12 of NTRK3. We found three separate structural variants in the same sample: (1) a translocation of ETV6 to chromosome 6; (2) a translocation of NTRK3 also to chromosome 6; and (3) an additional copy-number loss spanning from intron 5 of ETV6 to the exact structural variant break points, jointly bringing ETV6 within 45 kb upstream of NTRK3—a distance that would allow transcriptional read-through43 or splicing44 to yield the ETV6-NTRK3 fusion45 (Fig. 3b). Thus, the short chromosome-6 segment appeared to function as a bridge, which linked two genomic locations to facilitate a gene fusion. We term such products ‘bridged fusions’. This class of fusion is not uncommon. Out of a total of 436 gene fusions supported by 2 separate structural variants, 75 are bridged fusions (Supplementary Table 15).
On the basis of the nature of the underlying genomic rearrangements, we propose a unified fusion classification system (Extended Data Fig. 19a). Aside from bridged fusions, 344 additional fusions are linked to more than one structural variant in the same sample. These multi- structural variant fusions are collectively termed ‘composite fusions’ (Extended Data Fig. 19a, b). We find 284 intercomposite fusions (interchromosomal translocation) and 124 intracomposite fusions (intrachromosomal rearrangement), exemplified by ERC1-RET1 and NUMB-HEATR4 fusions, respectively (Extended Data Fig. 19b). Composite rearrangements bring the fusion partners significantly closer to each other, from the median natural distance of 6.8 Mb to the median of 7.9 kb (Wilcoxon rank-sum test, P ≤ 2.2 × 10⁻¹⁶; Extended Data Fig. 19c) after translocation. For 18% of fusions, no evidence of structural variation was found. Given that 340 structural-variant-independent, intrachromosomal fusions had significantly closer break points than those with structural variation (Extended Data Fig. 19d), it is possible that they could result from RNA read-through events. The other possibility is that the underlying supporting structural variants escaped detection, as shown by the observation that known gene fusions that are driven by structural variation, such as TMPRSS2-ERG46, did not have consistent evidence for structural variation in matching samples.
Extended Data Fig. 19. Structural rearrangements associated with RNA fusions.
a, Systematic classification scheme of all gene fusions based on underlying structural variants (SVs). Numbers of fusion events of different classes are shown to the right. b, Schematic of examples of different types of structural-variant-supported fusions: (1) direct fusions; (2) intercomposite fusions; and (3) intracomposite fusions. Bridged fusions are shown in Fig. 3b. Only one of the possible orders of genomic arrangement is depicted in each case, with break points highlighted by thunderbolts. c, Supported rearrangements for composite fusions bring the fused segments of two genes significantly closer. Natural distance indicates the native distance between two related structural variant break points. Effective distance indicates the distance between the final two break points of the intra- and intercomposite fusions. d, The break points of structural-variant-independent fusions are typically closer than those for other interchromosomal fusions, which indicates that at least some of the structural-variant-independent fusions may occur directly at the RNA level, mediated either by trans-splicing or read-through events.
Landscape of RNA alterations in cancer
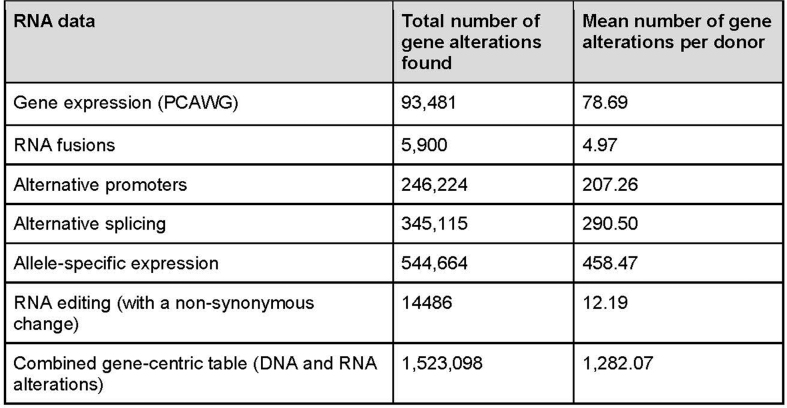
Given our comprehensive set of RNA alterations, we sought to characterize the heterogeneous mechanisms of cancer genome and transcriptome alterations. To enable joint analyses of RNA and DNA alterations, we created a gene-level table, which indicates the presence or absence of possible functional changes to RNA or DNA for each gene and donor. After stringent filtering, we identified 1,523,098 alteration events, in which an event is a gene–sample–alteration triplet (Extended Data Table 1, Supplementary Table 14). It should be noted that we chose to include only RNA alterations with potential functional effects or with the strongest quantitative affect, resembling similar strategies for filtering DNA alterations47. Recurrence analysis across several alteration types helped us to further enrich for functionally relevant genes. Building on the gene-centric table, we characterized gene alterations at the RNA level and contrasted these with DNA alterations (non-synonymous SNVs or SCNAs)5. On the basis of the calculated association between each RNA- and DNA-level alteration across all histotypes, we found that half of the RNA alterations significantly correlated with DNA alterations (likelihood ratio test, FDR < 1 × 10⁻⁴) (Extended Data Fig. 20).
Extended Data Table 1.
RNA alteration data
Extended Data Fig. 20. Correlation of the number of somatic genomic alterations with RNA alterations.
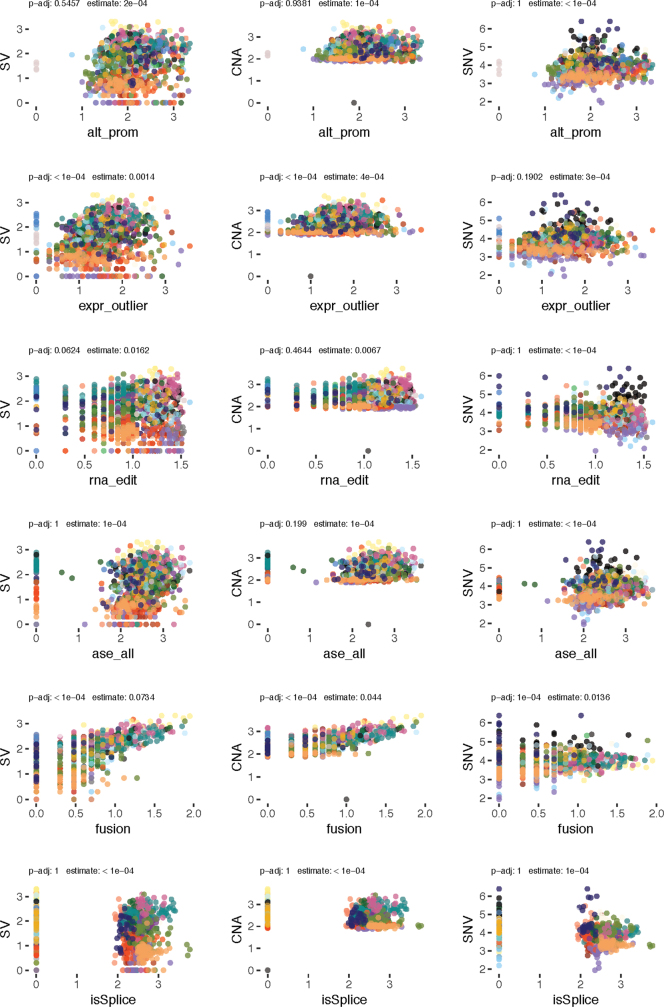
Scatter plots of log10-transformed frequency of DNA alterations versus log10-transformed frequency of RNA alterations, in which each row is a DNA alteration in the following order: structural variants, copy-number aberrations and non-synonymous variants. Each row is an RNA alteration in the following order: expression outliers, RNA editing, ASE, fusions and splicing. Each point is a sample coloured by histotype, and its position is the log-transformed number of aberrations found in each sample. The Benjamini–Hochberg-adjusted P values are calculated from a likelihood ratio test assuming negative binomial distribution; histotype is used as a confounder.
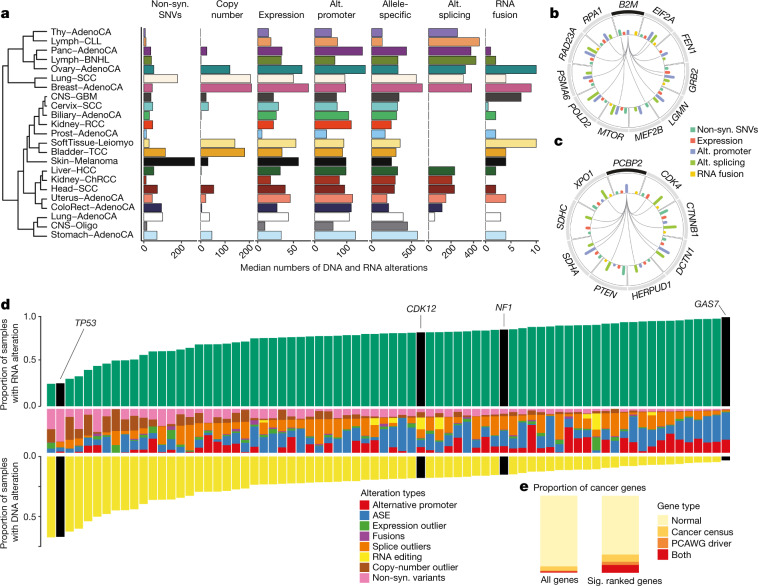
When comparing gene alteration frequencies across all histotypes (Fig. 4a), we note that different types of cancer contain distinct combinations of DNA- and RNA-level alterations (Fig. 4a, Supplementary Table 17). Although, as expected, skin melanoma significantly exceeds other cancers in the number of non-synonymous SNVs48 (Wilcoxon rank-sum test, P < 0.012), lymphatic cancers have low numbers of SNVs (Wilcoxon rank-sum test, P = 5.3 × 10⁻¹⁵), but high incidences of alternative splicing outliers (Wilcoxon rank-sum test, P = 4.9 × 10−47), which suggests that transcriptomic alterations can be relatively more pronounced in certain cancer types.
Fig. 4. Global view of DNA and RNA alterations that affect tumours.
a, The median numbers of different alterations across histotypes. Histotypes are ordered by hierarchical clustering based on the pattern of different types of alteration. Only histotypes with more than 10 donors are shown. Alt., alternative; non-syn, non-synonymous. Cancer-type abbreviations are listed in Supplementary Table 23. b, c, Circular representations of the selected genes significantly co-occurred with B2M (b) and PCBP2 (c). Connecting lines indicate the specific types of co-occurrence of alteration pairs. The inner histograms indicate the frequencies of incidences of different alteration types shown in different colours. d, All 74 Catalogue of Somatic Mutations in Cancer (COSMIC) cancer census genes or PCAWG driver genes that are both frequently and heterogeneously altered across both RNA- and DNA-level alterations. Yellow bars indicate the proportion of samples that had DNA-level alterations, and green bars indicate the proportion of samples with RNA-level alterations. Middle column is the proportion of each alteration type observed for that gene. e, The enrichment of cancer genes within our list of significantly recurrent genes.
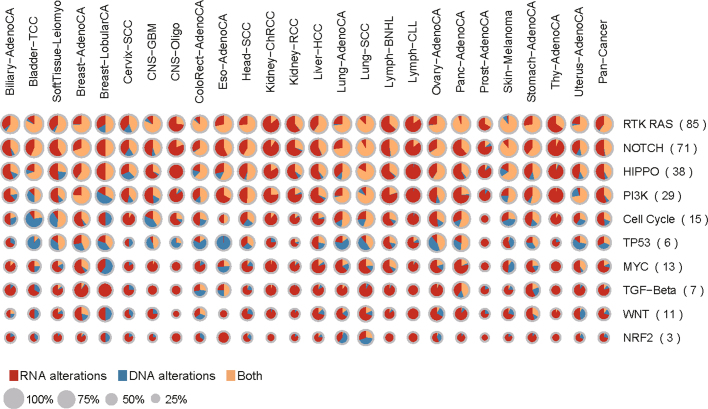
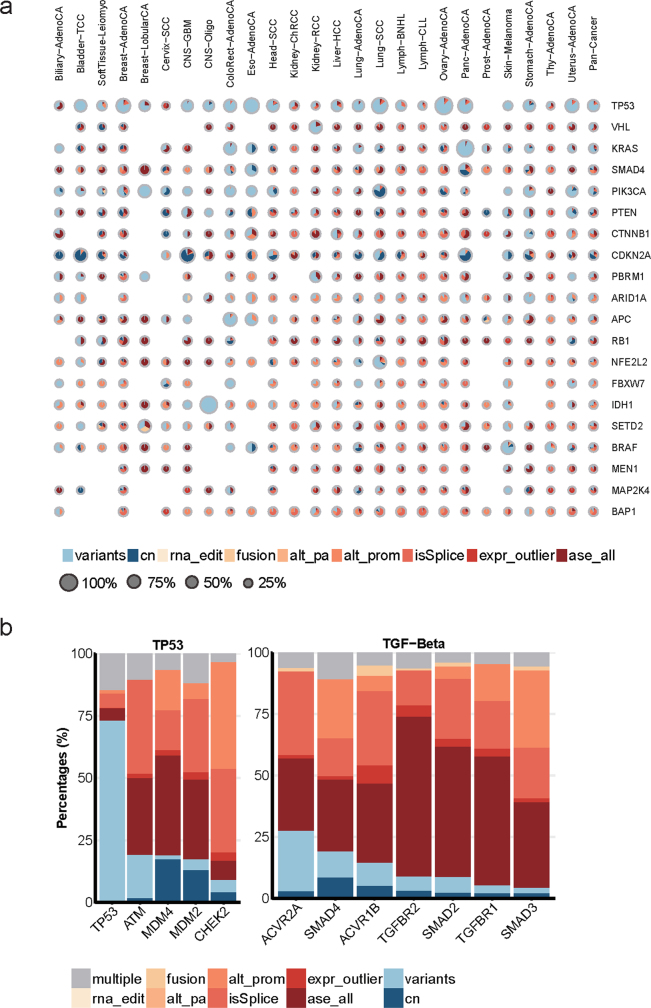
To evaluate to which extent RNA changes provide additional mechanisms for cancer gene alterations, we examined DNA- and RNA-level alterations both in sets of genes in pathways (Extended Data Fig. 21) and in individual genes with known roles in cancer (Extended Data Fig. 22). We found that RNA alterations occur at a high proportion in many pathways, including the NOTCH and TGF-β pathways. In addition, KRAS exhibits more RNA alterations than DNA alterations in some types of cancer. Given the recent finding that alternative splicing of KRAS expanded the prognostic affect beyond mutation status in colorectal cancer49, our data further support several modes of alteration for KRAS in tumours.
Extended Data Fig. 21. Global view of DNA and RNA alterations affecting cancer pathways.
Composite pie charts showing the percentages of RNA alterations, DNA alterations or both, affecting sets of genes in well-characterized cancer pathways and known to be functionally altered in cancer. The sizes of circles represent the percentages of patients affected based on the given gene set. The columns indicate different types of cancer. The numbers in parenthesis indicate the number of genes analysed for the specific pathway.
Extended Data Fig. 22. Breakdown of DNA and RNA alterations of cancer genes.
a, Composite pie charts showing percentages of DNA and RNA alterations for top cancer-driver genes. The 20 most significant cancer-driver genes identified by the PCAWG group in pan-cancer level are depicted, with the sizes of the pie charts indicating the percentages of patients carrying alterations in the given driver gene. The areas represent the relative percentages of patients exhibiting different alterations depicted by corresponding colours. When several types of alteration in one pathway affect the same patient, only a fraction is counted towards each type of alteration. b, Proportional bar plots showing the distribution of gene alterations for genes in the TP53 and TGFB pathways.
Co-occurrence of RNA and DNA alterations
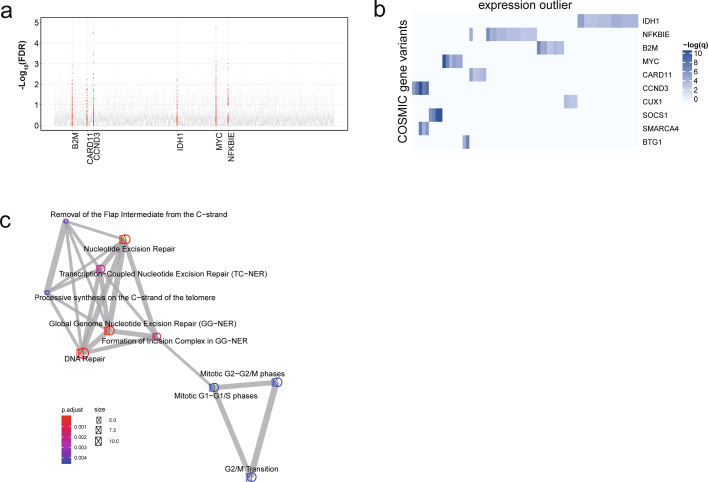
The diverse types of alteration in this study enabled us to investigate trans-associations between different genetic and expression characteristics involving cancer-related genes (FDR < 5%) (Supplementary Table 18). By investigating whether somatic mutations of known cancer genes are associated with the expression of other genes, we found IDH1 and NFKBIE to be widely linked to the dysregulation of many genes (Extended Data Fig. 23a, b). Notable co-occurrences were present in several types of cancer. For example, B2M and EIF4G2 alterations were simultaneously observed in both B-cell non-Hodgkin lymphoma and lung squamous cell carcinoma. Pathway enrichment analysis of the top 100 genes associated with all B2M alterations indicates that the most affected genes are involved in DNA repair (FDR ≤ 1%), and approximately two-thirds of those associations were significant in more than one cancer type (Fig. 4b, Extended Data Fig. 23c).
Extended Data Fig. 23. Trans-associations found by co-occurrence analyses.
a, Scatter plot for association of gene expression outliers with cancer gene variants. Each dot represents an alteration pair. The x axis shows all COSMIC genes ordered alphabetically and the y axis represents the FDR-adjusted P values (q values) based on Fisher’s exact tests. COSMIC genes with more than five significant associations (FDR < 5%) are coloured in red and labelled. b, Heat map showing the extent of associations between COSMIC gene somatic mutations and expression outliers of all genes. Each row indicates one gene, and the colour intensity shows the significance of trans-association. COSMIC genes labelled to the right are ordered by the number of significant associations. Only the top 10 genes are shown. c, Enrichment map showing the significant (FDR ≤ 0.01) pathways based on the top 100 significant genes associated with B2M alterations. Colour intensity represents enrichment significance, node sizes the number of analysed genes belonging to the given pathway and edge sizes the degree of overlap between two gene sets. Only the top 10 enriched terms are shown.
We also examined how cancer genes could be affected by other genes by co-occurrence analyses. Expression outliers of PCBP2 co-occurred with aberrant splicing of a large number of cancer-related genes, including CTNNB1 and CDK4 (Fig. 4c). PCBP2 has been reported to enhance the splicing of cassette exons50. Our results thus further support the possible role of PCBP2 in regulating the splicing of cancer-related genes.
Recurrent RNA alterations in driver genes
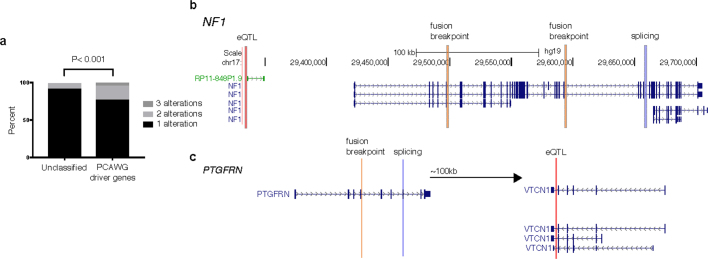
In our analyses of cis-acting mutations that are associated with these individual RNA phenotypes, the vast majority were observed rarely in the PCAWG cohort. Many cancer genes (such as MET51,52) are known to be somatically altered by heterogeneous mechanisms such as gene fusions, splicing mutations and non-synonymous mutations; therefore, examining genes that are altered by several cis-acting mechanisms may help to identify cancer genes in which an individual alteration type is rare. A total of 5,413 genes were altered by gene expression, allele-specific expression (ASE), splicing and/or gene fusion, and had an associated DNA-level mutation in cis (Supplementary Table 20). PCAWG-defined driver genes8 tended to have more diverse mechanisms of RNA-level alterations when compared to genes that have not previously been identified as a cancer gene (P < 0.001) (Extended Data Fig. 24a). We identified, for example, a somatic eQTL, a splicing-associated variant and fusions in the known tumour-suppressor NF1 in the MAPK pathway (Extended Data Fig. 24b).
Extended Data Fig. 24. Genes can be altered in cis by several mechanisms.
a, Genes with at least one type of RNA alteration that also has an associated change at the DNA-level in cis. Genes are either classified as a PCAWG driver gene or not classified as a driver gene or a cancer gene from the cancer gene census. b, c, Examples of a known cancer gene, NF1 (b), and an unclassified gene, PTGFRN (c), having heterogeneous mechanisms of alterations.
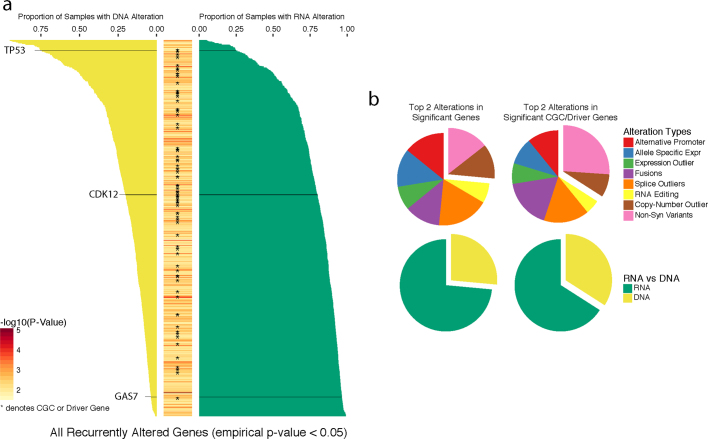
Owing to the fact that most somatic mutations are rare5, it is difficult to statistically distinguish functionally relevant, potential driver alterations from passenger alterations. Therefore, we aimed to identify genes that are both recurrently and heterogeneously altered, under the hypothesis that these genes have increased functional relevance. This analysis identified 731 genes with significant recurrent aberrations (FDR < 5%) (Extended Data Fig. 25a), with the top-ranking genes carrying both RNA and DNA alterations. RNA alterations accounted for 0.05–99.14% (mean: 78.23%) of all identified alterations in each gene (Extended Data Fig. 25a, Supplementary Table 21). This ranking is enriched for the union of cancer census genes53 (60 out of 603) and PCAWG-defined driver genes (33 out of 157, unioned: 74 out of 674 P = 4.6 × 10⁻¹³, enrichment: 2.45) (Fig. 4d, e).
Extended Data Fig. 25. Proportion of genes with DNA or RNA alterations.
a, Full list of 731 genes that are both frequently and heterogeneously altered across both RNA- and DNA-level alterations. Yellow bars to the left indicate the proportion of samples that had DNA-level alterations, whereas green bars to the right indicate the proportion of samples with RNA-level alterations. Middle column is a heat map corresponding to the −log10(P value). Asterisks indicate a COSMIC Cancer Gene Census (CGC) gene or PCAWG driver genes. b, Distribution of alteration types among all significant genes or just CGC or PCAWG driver genes.
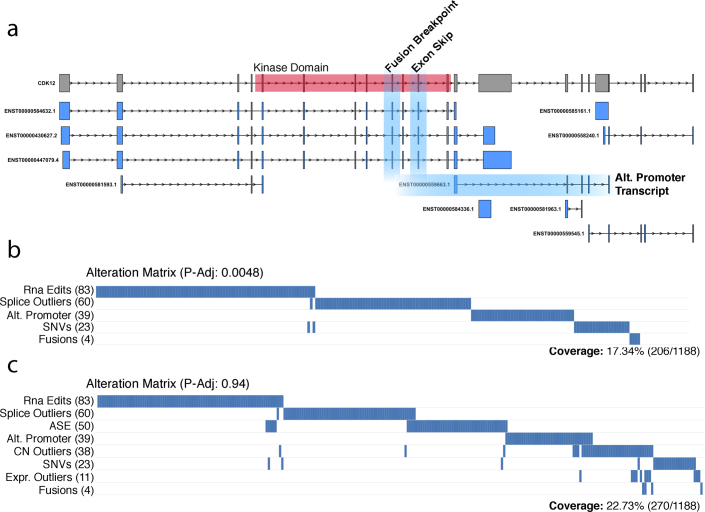
Among the top 10% of our ranked genes is CDK12 (rank 55). We find 91 samples that have an alteration involving its protein kinase domain, which has been implicated in DNA repair dysregulation54. Many of these samples have no DNA-level alterations in CDK12 (46%) (Extended Data Fig. 26a). Furthermore, splicing, alternative promoter, SNV, RNA-editing and fusion alterations in this gene are mutually exclusive (adjusted P = 4.8 × 10⁻³) (Extended Data Fig. 26b, c). Upon further investigation, we find that somatic eQTL mutations in CDK12 are associated with a tandem duplicator phenotype55. Although this association was not replicated with other RNA alterations, it provides evidence that somatic CDK12 mutations may alter its function through gene expression changes. This example illustrates that performing a recurrence analysis over diverse RNA and DNA alterations can help to identify genes known to be important in tumorigenesis.
Extended Data Fig. 26. Outlier events in CDK12.
a, Fusion, splicing and alternative promoter outlier events of the RNA alterations that lead to either partial or full removal of the kinase domain in CDK12. b, All outlier events in CDK12, including those not contained directly within the kinase domain, across all 1,188 samples. Each column is a sample and each row is the alteration type. Although not directly searching for mutually exclusive events across all genes, we find that CDK12 is marginally mutually exclusive in RNA editing, splicing outliers, alternative promoters, non-synonymous variants and fusions (4.810−3, unweighted WExT). c, All alteration events that occur within CDK12 across all 1,188 samples, which is not mutually exclusive.
Discussion
Here we present a comprehensive catalogue of RNA-level alterations in cancer, spanning 27 different tumour types, and provide a harmonized resource of matched transcriptome and whole-genome sequences. We identified 731 genes that were recurrently altered by several mechanisms, jointly enriched for known cancer census and PCAWG driver genes8. The list includes genes that are primarily altered at the DNA level (such as TP53), but also genes for which the alteration most frequently manifests in RNA (such as GAS7). Out of 87 samples from the PCAWG study that did not have a driver alteration at the DNA level5, and had RNA-sequencing (RNA-seq) data, every sample had an RNA-level alteration identified. Although cancer is thought to be driven by changes in DNA primarily, some driver alterations may manifest themselves via changes in RNA rather than DNA sequence mutations.
We identified germline eQTLs for around 20% of expressed genes. The number of eGenes found is generally low compared with some other studies, reflecting the heterogeneity of our samples. Only 422 genes appeared to be specific to cancer; this is likely to be an underestimate owing to the heterogeneity, small sample numbers and the rather conservative strategy chosen. We have also mapped linkages between genes and somatic aberrations in cis, in which 68.4% of associations were between non-coding somatic variants and gene expression. Allelic copy-number imbalance is a major determinant of ASE dysregulation in cancer. We found mutations associated with splicing changes including novel cancer-specific exons that can be partially explained by mutation-driven exonization. We systematically compared gene fusions with whole-genome rearrangements across many tumour types and found 82% of detected fusions were associated with specific genomic rearrangements. For the remaining fusions, it is possible that the relevant genomic rearrangements have not been detected, or that some fusions happen directly at the RNA level, as trans-splicing or read-through events. The availability of whole-genome sequences allowed us to develop a systematic classification of fusion events and to propose a new bridged fusion mechanism.
Because global differences in RNA expression phenotypes are largely tissue-specific, our ability to associate mutations in cis or trans are limited by the small and variable sample sizes within each histotype. Further work is needed to investigate other mechanisms of genome alteration that can lead to changes in RNA such as epigenetic changes56 or enhancer hijacking57. Our work will help to prioritize further investigations.
Overall, our analyses show diverse modes of alteration of cancer genes and pathways at the DNA and RNA levels, and demonstrate that RNA analyses reveal cancer-associated pathway alterations that have not yet been detected via DNA-only approaches. These insights illustrate the power of integrated transcriptome and whole-genome sequencing analysis for cancer studies.
Methods
RNA-seq alignment and quality-control analysis
Tumour and healthy ICGC RNA-seq data, included in the PCAWG cohort5, was aligned to the human reference genome (GRCh37.p13) using two read aligners: STAR58 (v.2.4.0i, two-pass), performed at MSKCC and ETH Zürich, and TopHat259 (v.2.0.12), performed at the European Bioinformatics Institute. Both tools used Gencode (release 19)60 as the reference gene annotation. For the STAR two-pass alignment, an initial alignment run was performed on each sample to generate a list of splice junctions derived from the RNA-seq data. These junctions were then used to build an augmented index of the reference genome per sample. In a second pass, the augmented index was used for a more sensitive alignment. Alignment parameters have been fixed to the values reported in https://github.com/ICGC-TCGA-PanCancer/pcawg3-rnaseq-align-star. The TopHat2 alignment strategies also followed the two-pass alignment principle, but was performed in a single alignment step with the respective parameter set. For the TopHat2 alignments, the irap analysis suite61 was used. The full set of parameters is available along with the alignment code in https://hub.docker.com/r/nunofonseca/irap_pcawg/. For both aligners, the resulting files in BAM format were sorted by alignment position, indexed and are available for download in the GDC portal (https://portal.gdc.cancer.gov/) and the ICGC Data Portal (https://dcc.icgc.org/). The individual accession numbers and download links can be found in the PCAWG data release table: http://pancancer.info/data_releases/may2016/release_may2016.v1.4.tsv. Cancer-type abbreviations are listed in Supplementary Table 23. Histology was derived from an older version released by the PCAWG Pathology and Clinical Correlates Working Group. Assignments of donor to histology used in this study can be found in the file rnaseq.extended.metadata.aliquot_id.V4.tsv.gz at https://dcc.icgc.org/releases/PCAWG/transcriptome/metadata/.
Quality control of all datasets was performed at three main levels: (1) assessment of initial raw data using FastQC62 (v.0.11.3) (Supplementary Fig. 4); (2) assessment of aligned data (percentage of mapped and unmapped reads for both alignment approaches); and (3) quantification (by correlating the expression values produced by the STAR and TopHat2 based expression pipelines) (Supplementary Fig. 2). In total, we defined six quality-control criteria to assess the quality of the samples. We marked a sample as a candidate for exclusion if: (1) 3 out of 5 main FastQC measures (base-wise quality, k-mer overrepresentation, guanine-cytosine content, content of N bases and sequence quality) did not pass; (2) more than 50% of reads were unmapped or fewer than 1 million reads could be mapped in total using the STAR pipeline; (3) more than 50% of reads were unmapped or fewer than 1 million reads could be mapped in total using the TopHat2 pipeline; (4) we measured a degradation score63 greater than 10; (5) the fragment count in the aligned sample (averaged over STAR and TopHat2) was <5 million; and (6) the correlation between the expression counts of both pipelines was <0.95. If a sample did not pass one of these six criteria it was marked as problematic and placed on a greylist. If more than two criteria were not passed, we excluded the sample.
A subset of 722 libraries from the projects ESAD-UK, OV-AU, PACA-AU and STAD-US were identified as technical replicates generated from the same sample aliquot. These libraries were integrated post-alignment for both the STAR and the TopHat2 pipelines using samtools64 into combined alignment files. Further analysis was based on these files. Read counts of the individual libraries were integrated to a sample-level count by adding the read counts of the technical replicates.
Initially, a total of 2,217 RNA-seq libraries were fully processed by the pipeline. Quality-control filtering and integration of technical replicates (722 libraries) gave a final number of 1,359 fully processed RNA-seq sample aliquots from 1,188 donors.
GTEx data analysis
For a panel of RNA-seq data from a variety of healthy tissues, data from 3,274 samples from GTEx (phs000424.v4.p1) were used and analysed with the same pipeline as PCAWG data for quantifying gene expression. A list of GTEx identifiers are provided at https://dcc.icgc.org/releases/PCAWG/transcriptome/metadata.
Quantification and normalization of transcript and gene expression
STAR and TopHat2 alignments were used as input for HTSeq65 (v.0.6.1p1) to produce gene expression counts. Gencode v.1960 was used as the gene annotation reference. Quantification on a per-transcript level was performed with Kallisto66 (v.0.42.1). This implementation is available as a Docker container at https://hub.docker.com/r/nunofonseca/irap_pcawg. The implementation of the STAR and TopHat2 quantification is available as docker containers in: https://github.com/ICGC-TCGA-PanCancer/pcawg3-rnaseq-align-star and https://hub.docker.com/r/nunofonseca/irap_pcawg/, respectively. Quantification of consensus expression was performed by taking the average expression based on STAR and TopHat2 alignments. Gene counts were normalized by adjusting the counts to FPKM67 as well as FPKM with upper quartile normalization (FPKM-UQ) in which the total read counts in the FPKM definition has been replaced by the upper quartile of the read count distribution multiplied by the total number of protein-coding genes.
The FPKM and FPKM-UQ calculations were as follows. FPKM = (C × 109)/(NL), in which N denotes the total fragment count to protein-coding genes, L denotes the length of the gene and C denotes the fragment count. FPKM-UQ = (C × 109)/(ULG), in which U denotes the upper quartile of fragment counts to protein-coding genes on autosomes unequal to zero, and G denotes the number of protein-coding genes on autosomes.
t-Distributed stochastic neighbour embedding analysis
The t-distributed stochastic neighbour embedding (t-SNE) plots in Supplementary Figs. 5 and 6 were produced using the RTsne package68 (with a perplexity value of 3) based on the Pearson correlation of the aggregated expression (log + 1) of the 1,500 most variable genes. FPKM expression values per gene were aggregated (median) by tissue (GTEx) and study (PCAWG). Coefficient of variation for each gene was also computed per tissue (GTEx) and study (PCAWG) to determine the 1,500 most variable genes. Purity values were previously described69.
The t-SNE plot in Extended Data Fig. 17c is based on all exon-skipping events in protein-coding genes confirmed by SplAdder70. Each event was quantified in both the PCAWG and GTEx cohort. All events with more than 1% of missing percentage spliced in (PSI) values across the concatenated PCAWG and GTEx samples were removed. The remaining missing values were imputed as the mean over the non-missing samples. The centred data were then visualized using the TSNE package from the Scikit Learn toolkit71 with a perplexity value of 100, random state 0 and an initialization with PCA.
Associations between genetic variation and gene expression: patient cohort
To associate genetic variation with gene expression, we analysed whole-genome sequencing (WGS) of the 1,188 donors with matched whitelisted RNA-seq data from the PCAWG cohort. Germline genotypes, SNV calls and segmented allele-specific SCNA calls were previously reported5. We matched 1,188 tumour RNA-seq IDs5 to WGS whitelist tumour IDs (synapse entry syn10389164). For patients with multiple WGS IDs (2 out of 1,188) or RNA-seq aliquot IDs (17 out of 1,188), we resolved the matching by pairing samples with the same ‘tumor_wgs_submitter_specimen_id’ (Supplementary Table 1). The 1,188 patients are spread across 27 types of cancer and 29 project codes and include 899 carcinomas; 34 patients are metastatic and 13 recurrent with the remaining patients being primary tumours (Supplementary Table 1).
We used the data of these 1,188 patients for performing somatic and germline eQTL mapping, ASE analysis and association studies between gene expression and mutational signatures.
Gene expression filtering
Gene expression values (measured in FPKM; https://dcc.icgc.org/releases/PCAWG/transcriptome/gene_expression) from consensus expression quantification as described above were used for this analysis.
Genes with FPKM ≥ 0.1 in at least 1% of the patients (12 patients) were retained, resulting in 47,730 genes. Only 18,898 protein-coding genes (according to the ‘gene_type’ biotype reported in Gencode v.1960) were used for the subsequent QTL analyses. The log2-transformed expression values (FPKM + 1) were subjected to peer analysis72 to account for hidden covariates (syn7850427; https://dcc.icgc.org/releases/PCAWG/transcriptome/eQTL/phenotype). To balance the number of covariates, statistical power and available sample sizes per cancer type, we followed the GTEx protocol and estimated 15, 30 and 35 hidden covariates to be used depending on sample size73 (n < 150, 150 ≤ n < 250, n ≥ 250). Peer residuals were then rank-standardized across patients. The FPKM cut-off values and peer correction were also applied to the subset of 899 patients with carcinoma, yielding 18,837 protein-coding genes after filtering. Furthermore, we used ordinary least-squares regression to correlate each of the 35 peer factors with per-sample covariates, including cancer project codes, gender, tumour purity, somatic burden and several sequence metrics (Supplementary Notes), to understand the proportion of variance explained by known biological and technical covariates.
Covariates
In all linear models, we accounted for known confounding factors by modelling them as fixed effects. In all association studies, we accounted for sex, project code (describing cancer type and country of origin) and per-gene copy-number status (Supplementary Table 1 for the list of per patient covariates; syn7253568 and syn7253569 for sex and project codes; syn9661460 for per gene copy number). Per-gene copy-number alterations were derived as the average copy number across all copy-number aberrations called within the annotated gene boundaries based on syn8042988.
The somatic eQTL, ASE and mutational signature analyses also accounted for total somatic mutation burden (number of SNVs and short insertions and deletions (indels)) and sample purity (Supplementary Table 1). Purity was estimated based on copy-number segmentation. In addition, the somatic eQTL and ASE analyses accounted for local SNV burden calculated in a 1-Mb window from the gene coordinates (https://dcc.icgc.org/api/v1/download?fn=/PCAWG/transcriptome/eQTL/covariates/pergene.somatic.snv.cis.burden.1188.wl.donors.tsv.gz).
The germline eQTL analysis also modelled the population structure as random effect. The population structure was assessed by a kinship matrix that was calculated based on every twentieth germline variant, processed as described below (see ‘Germline eQTL variants’). The kinship matrix was then calculated as an empirical patient-by-patient covariance matrix.
Different covariates were accounted for per-analysis method (Supplementary Table 1). The project code describes cancer type and country-of-origin. Somatic burden is the total number of SNVs and indels. Purity was estimated based on copy-number segmentation. Local somatic burden is the number of SNVs in a 1-Mb window around the gene coordinates. Local copy number was defined as the average copy-number state across all SCNAs called within the annotated gene boundaries.
GO and Reactome pathway enrichment
We performed GO74,75 and Reactome pathway20,21 enrichment with the Bioconductor packages biomaRt76,77, clusterProfiler78 and ReactomePA79 (FDR ≤ 10%). The number of genes used as background set is described per analysis method.
Germline eQTL variants
PCAWG variant calls v.0.15 were downloaded from GNOS and processed following the PCAWG-8 protocol: (1) VCF files were indexed and merged using bcftools80. (2) All variants were filtered for ‘PASS’ flag. (3) All variants were filtered for quality larger than 20. (4) Only bi-allelic sites were considered.
HDF5 files for each 100-kb chunk of the VCF files were generated, assuming additivity that was numerically encoded as 0, 1 or 2 for homozygous reference, heterozygous or homozygous alternative state, respectively. For indels, we encoded the presence or absence of the variant as 0 or 1, respectively. Each variant was normalized to mean 0 and standard deviation 1. Missing variants were mean-imputed. To create our eQTL release set v.1.0, the resulting HDF5 files were subsequently merged into a global HDF5 file and all variants which follow any of the following conditions were removed: (1) minor allele frequency ≤ 1%; and (2) missing values ≥ 5%
Germline eQTL analysis
In the germline eQTL analyses, we used the processed gene expression dataset from 1,178 patients for which germline variant calls (eQTL release set v.1.0, see ‘Germline eQTL variants’) were available. Linear mixed models were used to model the correlation between germline variants (within 100 kb of gene boundaries) and gene expression values (see ‘Gene expression filtering’) using the limix package81. Known covariates were modelled as fixed effects and population structure as random effect (see ‘Covariates’).
A two-step approach was used to adjust for multiple testing. First, for each gene, we adjusted for the number of independent tests estimated based on local linkage disequilibrium82. Second, we performed a global correction across the lead variants, that is, the most significant SNPs, per eQTL. Germline eGenes were defined as genes with an eQTL with global FDR ≤ 5%.
GTEx comparative analysis
The GTEx comparative eQTL analysis was based on the eQTL maps v.6p10. We mapped the positions and alleles of our PCAWG-specific eQTL to the eQTL in all GTEx tissues. To determine whether a lead eQTL variant is replicated in a given GTEx tissue, we followed the previously described strategy10. For each eGene, we considered the eQTL lead variant and assessed the replicability of the signal in the GTEx cohort based on marginal association statistics using 42 GTEx tissues without cell lines (P < 0.00024 = 0.01/42, corrected for the number of GTEx tissues—that is, 42)). If the lead variant did not replicate or was not tested, we determined replication based on the variant with the smallest P value within the linkage disequilibrium block (r2 ≥ 0.8 estimated based on UK10K project) of the lead variant across 25 (or 42) tissue-matched GTEx analyses. If neither lead nor any variant within the linkage disequilibrium block was tested, we determined replication based on the smallest P value of any variant within the 100-kb window tested within the GTEx cohort. We also derived less stringent sets of PCAWG-specific eGenes by allowing replication in up to 1, 5 or 10 GTEx tissues.
Tissue sharing of germline eGenes between histotypes
Using the R package qvalue (https://github.com/StoreyLab/qvalue, v.2.14.0), we generated π1 statistics comparing the lead variants of one histotype against their P value distribution in the other histotypes. Because π1 statistics are known to be confounded by sample size and number of eQTL found, we subsampled the eQTL lead variants to a randomly selected set of 100 variants. After 20 rounds of subsampling, we derived the same π1 statistics as mentioned earlier and reported the average.
Roadmap enrichment of germline eGenes
For each lead variant, we generated a matching background set of 1,000 variants using SNPsnap83. Each variant (background and foreground) was intersected with the location of 25 Roadmap factors16 in 127 cell types. From this we derived fold change and P values. Significant changes of fold change between PCAWG-specific and unspecific eQTLs is based on a one-sided Wilcoxon rank-sum test.
Enrichment analysis
Enrichment of Reactome pathways of PCAWG-specific eGenes was performed using the Bioconductor package ReactomePA79.
Somatic calls and mutational burden
We used the set of consensus SNVs somatic calls provided by PCAWG (syn7357330) based on three core caller pipelines and MuSE84. On average, we counted 22,144 somatic SNVs per patient, with different median numbers of SNVs per cancer type, ranging from 1,139 in thyroid adenocarcinoma to 72,804 SNVs in skin melanoma (Extended Data Fig. 5a). Owing to the low frequency of somatic SNVs across the cohort (Extended Data Fig. 5b), we collapsed the variants by genomic regions defined by gene annotations (Gencode v.1960). Specifically, we generated a set of disjoint gene exons by collapsing overlapping exon annotations into single features using bedtools85. The set of disjoint introns was generated using bedtools by subtracting the collapsed exonic regions from the gene regions. To map local effects of somatic mutations in flanking features outside the gene body, we binned the surrounding regions (plus and minus 1 Mb from the gene boundaries) into 2-kb windows (flanking) overlapping by 1 kb.
We defined three different types of aggregated somatic burden to assess differences in power in detecting somatic eGenes and P value calibration. The burden in a genomic region was defined as (1) a binary value that indicates presence or absence of SNVs; (2) the aggregated burden as sum of SNVs; or as (3) weighted burden, that is, sum of variant allele frequencies of the SNVs (Supplementary Fig. 10a) to take into account their clonality (https://dcc.icgc.org/releases/PCAWG/transcriptome/eQTL/genotypes). We assessed calibration of all three analyses with Q–Q plots of nominal and permuted P values (permutation of the patients in the gene expression matrix) (Supplementary Fig. 10b–d). Moreover, for the linear regression analysis, genotypes were standardized across patients (to mean zero and standard deviation one) and standardized effect sizes are provided in Supplementary Table 5.
Overall, somatic burden within flanking regions was the most prevalent type of burden tested per gene (Extended Data Fig. 6a). We found similar average relative mutation density per type of genomic region (flanking = 0.008 mutations per kb; introns = 0.007 mutations per kb; exons = 0.006 mutations per kb) (Extended Data Fig. 6b) and average recurrence of the same mutated region across the cohort was rather low (flanking = 1.4%; exons = 1.7%; introns = 4%) (Extended Data Fig. 6c).
Somatic eQTL analysis
Linear models were used to model the correlation between recurrent somatic burden and gene expression of up to 18,898 protein-coding genes, using the limix package81 (see ‘Gene expression filtering’). Gene expression was corrected for 35 hidden Peer factors. Known covariates were modelled as fixed effects (see ‘Covariates’). We considered only somatic burdens with frequency greater than 1%, including exonic and intronic burdens, as well as flanking burdens, within 1 Mb from gene boundaries.
The somatic eQTL analysis was performed on all 1,188 patients and on the subset of 899 patients with carcinoma (representing 20 of the 27 types of cancer) to replicate the analysis on a more homogeneous set of tumours. A cis window of 1 Mb from the gene boundaries was used to find mutated genomic intervals with a burden frequency ≥ 1% in the cohort (at least 12 patients in the full cohort and 9 patients in the carcinoma cohort). Together, 18,708 of the genes had at least one mutated interval at that frequency and were included in the analysis and 1,049,102 regions showed a burden frequency ≥ 1%
Bonferroni correction was applied to correct for multiple cis windows tested within the same gene. Then, Benjamini–Hochberg correction was applied to adjust the P values of the lead genomic regions across genes. Somatic eGenes were defined as genes with an eQTL at a FDR ≤ 5%.
Somatic cis-eQTL comparative analysis
We compared our 649 somatic eQTL set with three previous cancer studies86–88 to identify independent evidence of interaction between our eGenes and the associated cis-genomic regions with somatic burden. Studies were chosen if they provided lists of cancer regulatory elements linked to genes or regulatory elements with somatic mutations linked to gene expression deregulation in cancer. All the three studies examined were based on TCGA cancers. For this, we checked perfect overlaps with both the somatic burden location and the eGene. Moreover, we looked at the overlap between somatic eQTL and 72,987 GeneHancer89 enhancers-to-genes interactions, with at least two independent supporting methods (called ‘double-elite’), downloaded from the UCSC hg19 GeneHancer track90. We then compared this overlap with a set of nulls generated by 1,000 random permutations of the GeneHancer regulatory elements with nearby genes located within 1 Mb. We then retrieved an empirical P value of enrichment by counting the number of random nulls (N) showing greater number of overlaps than those found between the somatic eQTL set and the GeneHancer set (P = (N + 1)/(1,000 + 1)).
Functional enrichment in somatic cis-eQTL
To identify putative regulatory sites enriched for somatic eQTL, we retrieved functional annotations of the lead genomic flanking intervals of the somatic eQTL (556 intervals linked to 638 somatic eQTL). Therefore, we mapped somatic eQTL to 25 Roadmap Epigenomics chromatin marks of 127 different cell types16 and ENCODE transcription-factor binding site annotations in 9 cell types (including 8 cancer and one embryonic stem-cell lines91) (Supplementary Tables 6 and 7). We compared annotations in the significant set of eQTLs with a null distribution based on 1,000 random samplings of a matched set of genomic intervals. To define the matched sets of genomic intervals, we selected flanking genomic intervals from the whole set of tested genes that showed a similar distance from the gene start (exact distance ± 2 kb) and that matched the exact burden frequency of the corresponding interval in the significant associations. We then overlapped the 1,000 matched sets with Roadmap Epigenomics and ENCODE annotations. To avoid ambiguous overlaps (with multiple annotations), we retained only genomic intervals showing a minimum overlap of 10% of their length.
We retrieved an empirical P value of enrichment for each annotation by counting the number of randomly sampled flanking intervals (N) showing greater number of overlaps compared to the eQTL set (P = (N + 1)/(1,000 + 1)). Benjamini–Hochberg correction was applied to the empirical P values (over 25 marks in 127 cell lines for Roadmap Epigenomics annotations and over 149 transcription-factor-binding sites for 9 ENCODE cell lines). We then computed the fold change per annotation and cell line as a ratio of annotated lead flanking intervals and mean number of annotated matched random flanking intervals over the 1,000 samplings.
Furthermore, we performed GO74,75 and Reactome pathway20,21 enrichment with the Bioconductor packages biomaRt76,77, clusterProfiler78 and ReactomePA79 (FDR ≤ 10%) and also looked at enrichment within high-confidence cancer testis genes previously described92, using 18,708 genes with at least one mutated interval as background.
Variance component analysis
Limix was used to perform variance decomposition using the same covariates as in the somatic variant analyses except for local copy-number state (see ‘Covariates’). The random effects were based on the following common germline variants and somatic burden (frequency > 1%) (see ‘Somatic calls and mutational burden’ for detailed description of burden): (1) cis-somatic intronic: weighted burden in introns; (2) cis-somatic exonic: weighted burden in exons; (3) cis-somatic flanking: weighted burden in 1-kb-overlapping regions of 2 kb within 1 Mb from gene boundaries; (4) somatic intergenic: weighted burden in 1-kb-overlapping regions of 2 kb outside the 1 Mb window; (5) cis-germline: germline variants within 100 kb from gene boundaries; (6) trans-germline: genome-wide population structure (see ‘Covariates’); and (7) local copy-number variation (see ‘Covariates’).
All the data was mean-centred and standardized. For each of the random effects, a linear kernel was computed and used as covariance matrix. The resulting variance components were normalized to add up to one.
Mutational signature associations
We obtained 39 mutational signatures from PCAWG-7 beta 2 release9 and used linear models to associate the mutational signatures with gene expression of up to 18,898 protein-coding genes across 1,159 patients while accounting for known covariates (see ‘Covariates’) (quality control) (Extended Data Fig. 10a–e). The 1,159 patients were a subset of the total 1,188 patients, for whom mutational signature profiles were available. Gene expression was corrected for 35 hidden peer factors (see ‘Gene expression filtering’).
We retained 18,888 genes that showed a minimum FPKM of 0.1 in at least 1% of 1,159 the patients (see ‘Gene expression filtering’). Signatures with zero variance and a prevalence below 1% were filtered, and we obtained 28 signatures. We applied linear models to associate expression of these genes with the signatures across all 1,159 patients, a subset of 877 patients with carcinoma or a subset of 891 European patients to assess consistency of the associations (Extended Data Fig. 10f, g).
Across all patients, we found 1,176 significantly associated genes after Benjamini–Hochberg correction (we used an FDR ≤ 10% for enrichment analyses, multiple testing was applied across all signature–gene pairs) (Supplementary Tables 19a–c). We performed gene enrichment analyses of the significant genes per signature (see ‘GO and Reactome pathway enrichment’) (here 18,831 background genes, multiple testing correction across all ontologies per signature FDR ≤ 10%) (Supplementary Table 19d). Whereas most signatures were associated with only few genes, 18 showed recurrent trans effects and affected expression of over 20 genes (Extended Data Fig. 11d, Supplementary Table 19e). We further found that the vast majority of genes (85.8%) were associated with only one signature (1,009 genes); 129 genes were associated with two, 32 with three, 5 with four and 1 with five signatures.
To assess how tissue-specific both mutational signatures and their associations with gene expression are, we analysed the occurrence of each signature in each of the types of cancer. We assessed the presence (at least one SNV of a signature in at least one patient with a specific cancer type) and mean prevalence (mean number of SNVs of a certain signature across all patients of a specific cancer type) of the signatures in the types of cancer (Extended Data Fig. 13c, d). We defined cancer-type-specific signatures to occur in up to four types of cancer (signatures 4, 7, 9, 12, 16, 38 and 39) and common signatures to be missing in up to five types of cancer (signatures 2, 13 and 18). For each of these signatures, we performed cancer-type-specific analyses, that is, we assessed the association between the respective signature and gene expression in just the patients who are of a cancer type that shows mutations of the respective signature (Extended Data Fig. 13c, left heat map). We then correlated the P values of these cancer-type-specific analyses with the P values of the analysis across all patients and calculated the Pearson correlation coefficients (Supplementary Fig. 24a–e). We show that the correlation between cancer-type-specific and whole-cohort P values is dependent on the sample size of the respective analysis (r2 = 0.671) (Supplementary Fig. 1f).
We further performed PCA on the signatures across both, patients (PCA on signature-specific SNVs per patient) and genes (PCA on adjusted P values of signature-gene expression associations) (Extended Data Fig. 11a, b).
To assess significance of the functional annotation of SNVs by mutational signatures, we also associated gene expression with the total number of SNVs and correlated the P values (−log10(P)) of the associations with the respective signature-specific P values. The absolute Pearson correlation coefficients remain below 0.1 (Supplementary Table 19f).
To establish causality of signature–gene expression associations, we included the germline eQTL into the analysis using linear mixed models; 197 of our 1,176 signature-associated genes were also germline eGenes. These 197 associations involved 26 of the 28 mutational signatures. We associated the lead variants of these eGenes with the rank-standardized signature SNVs across 2,507 patients. We used the subset of the 2,818 WGS patients for which mutational signature profiles and all known covariates were available. We accounted for the same fixed covariates as in the mutational signature–gene expression association studies and, in addition, for kinship as a random effect (see ‘Covariates’).
We then performed proportional colocalization analysis with Bayesian model averaging using the R package coloc93 to test whether gene expression and mutational signatures share common causal genetic variants in a given gene region. A proportional colocalization analysis tests the null hypothesis of colocalization by assuming that two phenotypes that share causal variants will have proportional regression coefficients for either phenotype with any variant selection in the vicinity of the causal variant. We applied the Bayesian model averaging approach, with each tested model consisting of a selection of two variants. The P values are then averaged over all models to generate posterior predictive P values93. We filtered variants so that no pair of variants showed r2 > 0.95 and each variant’s marginal posterior probability of inclusion with one of the phenotypes was greater than 0.01. The nominal P values of rejecting the null hypothesis of colocalization are listed in Supplementary Table 19e.
We then performed mediation analysis94,95 to assess directionality of the effect between germline eQTL, gene expression and mutational signature. First, causal mediation analysis was applied to each of the triples of eQTL lead variant, gene and mutational signature using a structural equation model from the R package lavaan96. Then, we used the R package mediation97 to assess significance of mediation and estimate the proportion of mediated effect by non-parametric bootstrap confidence intervals (1,000 simulations).
ASE analysis: assembling phased germline and somatic variants
To understand the precise effect of somatic variations in their genomic context and for subsequent allele-specific analyses, both germline and somatic variants were phased. For assembling phased germline genotypes, we used the Sanger 1000G callset6, and applied IMPUTE298 for phasing of heterozygous germline variants. The IMPUTE2 output was corrected using results from the Battenberg CN calling algorithm99 to ascertain that no haplotype switches occur within regions of consecutive copy-number gain. The resulting phased germline genotypes were arranged such that haplotype 1 always corresponded to the amplified alleles in regions with SCNAs (major allele). In cases in which both co-occur on the same NGS read (approximately 10 million variants, 20% of all SNVs), we phased individual somatic variants to the nearest germline heterozygous site. For downstream analyses, we considered only SNVs that were phased by at least three reads to the respective germline variant (approximately 6 million out of 10 million SNVs).
All phased SNVs were aggregated into functional categories based on their genomic regions defined by gene annotations (upstream, downstream, promoter, 5′ UTR, intron, synonymous, missense, stop gain and 3′ UTR) and mapped to the nearest gene within a cis window of 100 kb using the Variant Effect Predictor (VEP) tool100. Promoter variants were defined as 1-kb upstream of the TSS. We included flanking regions by using the VEP ‘UpDownDistance’ plugin with a maximum range parameter of 100 kb. We divided the upstream and downstream variant categories into disjoint categories using 10-kb windows from 10 to 100 kb. We integrated ‘splice donor’ and ‘splice acceptor’ variants into the general ‘splice region’ variant category and mapped ‘stop retained’ variants to the ‘synonymous’ variant category. We averaged transcript-level annotations to gene-level annotations to retrieve the expected functional effect of a variant for a given gene. We analysed the relationship between SNV variant allele frequency and SCNAs at the same locus to determine whether variants occurred before (‘early’) or after (‘late’) the corresponding SCNA (PCAWG-11). We computed a weighted cis-mutational burden per category by estimating the cancer cell fraction of each SNV and aggregating SNVs to a total localized burden weighted by their respective cancer cell fraction.
ASE read counts
The positional information of the heterozygous germline variants was used together with the RNA-seq BAM files as input to the GATK ASEReadCounter101 algorithms for counting ASE reads. We considered reads with a minimum mapping quality of 20 and a minimum base quality of 10. Only heterozygous variants with a minimum coverage of eight RNA-seq reads were considered for all further analyses.
The raw ASE read counts were post-processed as follows: (1) ASE sites were converted to BED files and aligned against the ENCODE 50-mer mappability track (wgEncodeCrgMapabilityAlign50mer.bigWig) to extract mappability scores for all sites. All sites with mappability scores unequal to 1 were removed. (2) All sites with allelic read counts less or equal to 1 were removed to prevent genotyping error to influence ASE quantification. (3) All sex chromosomes were dropped for further analysis. (4) We estimated sequencing error per patient as the sum of non-reference and non-alternative bases over the total number of bases. We assessed statistical mono-allelicity through a binomial test using the estimated sequencing error probabilities, corrected using the Benjamini–Hochberg step down procedure. All sites that appeared to be statistically mono-allelic were removed. (5) For each ASE site, copy-number states were retrieved from the Sanger copy-number consensus callset (PCAWG-11). Purity estimates for each patients were retrieved from the accompanying purity tables.
To aggregate site-level ASE to a gene-level readout and to allow for estimation of effect directionality, we used the phased germline genotypes. Gene mapping was performed against ENSEMBL release 75 using the pyEnsembl Python library. We retrieved all genes at each ASE site and summed up the read counts on the respective haplotypes to gene-level haplotype-specific read counts. We further averaged haplotype-specific copy-number states to a mean haplotype-specific copy-number state per gene and computed the gene-level copy-number ratio as the major over total ratio of those averages. To allow for a robust assessment of gene-level ASE, we considered only genes with at least 15 reads total, yielding 4,379,378 gene–patient pairs of 1,120 patients and 17,009 unique genes across 12,441,502 accessible sites in total. Every remaining gene was tested for AEI using a binomial test against an expected read ratio of 0.5 to derive nominal P values, and a binomial test against the expected copy-number ratio modified by tumour purity to derive copy-number-corrected P values. Nominal and copy-number-corrected P values were adjusted separately for multiple testing using the Benjamini–Hochberg procedure. Significant AEI was called at FDR ≤ 5%. We further annotated each gene with the number of ASE sites used for aggregation. For all downstream analyses, we considered only genes annotated as protein coding (ENSEMBL biotype = ‘protein_coding’).
Generalized linear models
Across all 4,379,378 gene–patient pairs, we trained multivariate linear models using (i) logistic regression against a binary indicator of AEI absence or presence in a gene, or (ii) standard linear regression against the phased ASE ratio of a gene to assess the directionality of the regulatory change. For (i), haplotype-specific mutations were summed up to a total burden per category, whereas for (ii) we used the difference in burden between the haplotypes 1 and 2. The consistency of the phasing map between somatic variants and ASE sites ensured that model coefficients kept their directionality independent of the arbitrary labelling of haplotypes as 1 or 2. The full set of considered factors is as follows: (1) copy-number ratio at the gene locus (0.5 ≤ x ≤ 1); (2) sample purity (0 < x < 1); (3) natural logarithm of total gene length (x > 0); (4) natural logarithm of the length of the canonical transcript (x > 0); (5) heterozygosity of the lead eQTL variant (x = 0 if homozygous, x = 1 if not homozygous); (6) all mutational burden categories as determined by VEP annotations (upstream in 10-kb windows, downstream in 10-kb windows, promoter, 5′ UTR, intron, synonymous, missense, stop gain and 3′ UTR; x ≥ 0 for logistic model, x ∈ ℝ for directed model).
To compare global effects and different contributions of SCNA, germline eQTL, coding and non-coding SNVs, a simplified logistic model was trained after accumulating all coding and non-coding variants to separate categories and reporting standardised effect sizes (Fig. 1e).
Cancer gene enrichment
Cancer gene enrichment was conducted on the COSMIC census53 using Fisher’s exact test and gene set enrichment analysis as previously described102. For enrichment, the average score of a gene was computed across the cohort and only genes with at least five replicates in the cohort were kept, yielding a total of 16,078 genes.
Chromosomal distribution of ASE
We calculated the recurrence of ASE genes in each tumour type. To examine the chromosomal distribution of ASE genes, we calculated the average recurrence of all genes for every 200-gene window with a 10-gene step, and then subtracted the average ASE occurrence in each tumour type to obtain the peaks of ASE surplus across all chromosomes. The recurrence of copy-number genes was calculated in an analogous manner.
Estimation of alternative promoter activity
We estimated promoter activities using RNA-seq data and Gencode (release 19) annotations for 70,937 promoters in 20,738 genes. We grouped transcripts with overlapping first exons under the assumption that they are regulated by the same promoter103. TSSs that are located within internal exons, or which overlap with splice acceptor sites, were removed from this analysis as these promoters are difficult to estimate from RNA-seq data28. Promoter activity can be estimated using exon usage29, spliced reads28 or isoform-based estimates30. Here we used an isoform-based approach to quantify promoter activity. We quantified the expression of each transcript from the RNA-seq data using Kallisto66 and calculated the sum of expression of the transcripts initiated at each promoter to obtain an estimate of promoter activity. To obtain the relative activity for each promoter, we normalized each promoter’s activity by the overall gene’s expression. We divided the promoters of each gene into three categories based on their average pan-cancer promoter activity. The promoters with <1 FPKM average activity are called inactive promoters, and the most active promoter of each gene is called the major promoter. The remaining active promoters of the gene are called minor promoters.
The association between promoter activities and promoter mutation burden was estimated using the same framework as the somatic eQTL analysis. We examined associations for the promoters of expressed multi-promoter genes with a burden frequency ≥ 1% in the cohort (at least 12 patients in the full cohort). The weighted burden of the region 1-kb upstream of the TSS—that is, the sum of variant allele frequencies of the SNVs for each gene—was used as the genotype for the promoters of the respective genes. We used linear models to study the associations between the recurrent somatic burden and the promoter activity (both for the relative activity and the log2-transformed absolute activity). Similar to the somatic eQTL analysis, the known covariates and the 35 hidden peer factors were provided as cofactors to the linear models. We adjusted the P values using Benjamini–Hochberg correction method and looked for associations with FDR ≤ 5%.
Identification of alternative splicing
We used the alignments based on the STAR pipeline to collect and quantify alternative splicing events with SplAdder70. The software has been run with its default parameters with confidence level 3. We generated individual splicing graphs for each RNA-seq sample for both tumour samples as well as matched healthy samples (when available). All graphs were then integrated into a merged graph to comprehensively reflect all splice junctions observed in all samples together. On the basis of this combined graph, SplAdder was used to extract alternative splicing events of the following types: alternative 3′ splice site, alternative 5′ splice site, cassette exon, intron retention, mutually exclusive exons, coordinated exon skip (see supplementary figure 3 in ref. 70). Each identified event was then quantified in all samples by counting split alignments for each splice junction in any previously identified event and the average read coverage of each exonic segment involved in the event was determined. We then computed a PSI value for each event that was then used for further analysis. We further generated different subsets of events, filtered at different levels of confidence, in which confidence is defined by the SplAdder confidence level (generally 2), the number of aligned reads supporting each event, the number of samples that were found to support the event by SplAdder, and the number of samples that passed the minimum aligned read threshold.
Enrichment of outlier splicing associated with splice sites and branchpoint motifs
We assessed the significance of mutational enrichment for 5′ and 3′ splice sites, and branch-point104,105 intronic regions using a permutation-based approach. Impactful mutations were defined as mutations overlapping exons and introns involved in cassette exon events, in which the PSI-derived z-score was ≥ 3 or ≤ −3. For each intronic site, we compared the frequency of observed impactful mutations against frequencies of randomly sampled intronic regions (number of iterations = 1,000). For exonic sites, the null distribution was established from randomly sampled exonic sites. Randomly sampled sites were within a 100-bp window around the 5′ and 3′ splice site. For branch-point regions, sampled sites were within a 50-bp window around the branch-point sequence. The P value was computed as the number of randomly sampled frequencies greater or equal to the observed frequency.
SAVNet analysis for identifying rare SAVs
The SAVNet approach35 was designed for identifying somatic variants associated with local aberrant splicing alterations from matched genome and transcriptome sequencing data. It uses permutations to calculate an FDR and by restricting to two classes of relationships between somatic mutations and splicing alterations to focus: (1) splice site disruption, in which exon skipping, alternative 5′ or 3′ splice site, or intron retention is associated with a mutation in a splice site motif; and (2) splice site creation, in which alternative 5′ or 3′ splice sites are associated with mutations that create a novel splice motif (FDR ≤ 10%) (Extended Data Fig. 17e).
Identification of RNA fusions
Gene fusions between any two genes were identified based on two gene fusions detection pipelines: FusionMap (v.2015-03-31) pipeline106 and FusionCatcher (v.0.99.6a)/STAR-Fusion (v.0.8.0) pipeline107. ChimerDB 3.0 was used as a reference of previously reported gene fusions. The database contains 32,949 fusion genes split into three groups: (1) KB: 1,067 fusion genes manually curated based on public resources of fusion genes with experimental evidences; (2) Pub: 2,770 fusion genes obtained from text mining of PubMed abstracts; and (3) Seq: archive with 30,001 fusion gene candidates from deep-sequencing data. This set includes fusions found by re-analysing the RNA-seq data of the TCGA project encompassing 4,569 patients from 23 types of cancer.
In brief, FusionMap was applied to all unaligned reads from the PCAWG aligned TopHat2 RNA-seq BAM files for each aliquot to detect gene fusions. In the FusionCatcher/STAR-Fusion pipeline, for each aliquot with paired-end RNA-seq reads FusionCatcher was applied to the raw reads, with the genome reference. Specifically, for each aliquot with paired-end RNA-seq reads FusionCatcher was applied to the raw reads. The ‘-U True; -V True’ runtime options were used. For each aliquot with single-end RNA-seq reads, STAR-Fusion was applied to the raw reads, with the same reference genome and gene models as FusionCatcher and with default settings. In parallel, FusionMap was applied to all unaligned reads from the PCAWG aligned TopHat2 RNA-seq BAM files for each aliquot to detect gene fusions with the following non-default options values: MinimalHit = 4; OutputFusionReads = True; RnaMode = True; FileFormat = BAM.
To reduce the number of false-positive fusions, the two sets of fusions were filtered to exclude fusions based on the number of supporting junction reads, sequence homology, and occurrence in normal samples (from the GTEx and the PCAWG cohort). To get a high-confident consensus fusion call set from these two pipelines, a fusion to be included in the final set of fusions had to: (i) be detected by both fusion detection tools in at least one sample; and/or (ii) be detected by one of the methods and have a matched structural variant in at least one sample. The consensus WGS-based somatic structural variants (v.1.6) were obtained from the PCAWG repository in https://dcc.icgc.org/releases/PCAWG.
For integration with matched structural variant evidence, a fusion was considered to match a structural variant if the absolute distance between the fusion break points and structural variant break points did not exceed 500 kb (the distance was considered infinite when the chromosomes of the fusion and structural variant break point differ). When there was no evidence for a direct structural variant fusion, the search was expanded to look for composite fusions. In this case, an exhaustive search was performed to look for two structural variants with break points close to the fusion break points and with an effective distance smaller than 250 kb.
Finally, 3,540 fusion events were included as the consensus fusion call set, from these 2,268 were detected by both FusionCatcher/STAR-Fusion and FusionMap (from these, 1,821 had matched structural variant evidence) and 1,112 were detected by only one method and had matched structural variance evidence.
In total, approximately 36% of all detected fusion transcripts were predicted to be in-frame, several UTR-mediated fusion transcripts preserve complete coding sequences of one fusion partner. These include a known fusion TBL1XR1-PIK3CA in a breast tumour and a notable new example CTBP2-CTNNB1 in a gastric tumour.
All fusions are available in Synapse: https://dcc.icgc.org/releases/PCAWG/transcriptome/fusion.
Identification of RNA-editing events
We used an RNA-editing events calling pipeline, which is an improved version of that previously published108. First, we summarized the base calls of pre-processed aligned RNA reads to the human reference in pileup format. Second, the initially identified editing sites were then filtered by the following quality-aware steps: (1) the depth of candidate editing site, base quality, mapping quality and the frequency of variation were taken into account to do a basic filter: the candidate variant sites should be with base-quality ≥ 20, mapping quality ≥ 50, mapped reads ≥ 4, variant-supporting reads ≥ 3, and mismatch frequencies (variant-supporting-reads/mapped-reads) ≥ 0.1. (2) Statistical tests based on the binomial distribution B(n, p) were used to distinguish true variants from sequencing errors on every mismatch site109, in which p denotes the background mismatch rate of each transcriptome sequencing, and n denotes sequencing depth on this site. (3) Discard the sites present in combined DNA SNP datasets (dbSNP v.138, 1000 Genome SNP phase 3, human Dutch populations110, and BGI in-house data; combined datasets deposited at: ftp://ftp.genomics.org.cn/pub/icgc-pcawg3). (4) Estimate strand bias and filter out variants with strand bias based on two-tailed Fisher’s exact test. (5) Estimate and filter out variants with position bias, such as sites only found at the 3′ end or at 5′ end of a read. (6) Discard the variation site in simple repeat region or homopolymer region or <5 bp from splicing site. (7) To reduce false positives introduced by misalignment of reads to highly similar regions of the reference genome, we performed a realignment filtering. Specifically, we extracted variant-supporting reads on candidate variant sites and realign them against a combination reference (hg19 genome plus Ensembl transcript reference v.75) by bwa0.5.9-r16. We retain a candidate variant site if at least 90% of its variant-supporting reads are realigned to this site. Finally, all high confident RNA-editing sites were annotated by ANNOVAR111. (8) To remove the possibility of an RNA-editing variant being a somatic variant, the variant sites are positionally filtered against PCAWG WGS somatic variant calls (9). The final two steps of filtering are designed to enrich the number of functional RNA editing sites. First, we keep only events that occur more than two times in at least one cancer type. Second, we keep only events that occur in exonic regions with a predicted function of missense, nonsense or stop-loss. The final step of filtering within exonic regions with a specific predicted function induces the largest difference in observed frequencies of RNA-editing events between our analysis and the published one108. A comparative depiction of the frequencies of RNA-editing events identified in our analysis (Supplementary Table 24) and the previously published analysis108 is seen in Supplementary Fig. 23.
Gene-centric table creation
To perform joint analysis across RNA and DNA alterations, each alteration type was condensed into a binary gene-centric format. Because alterations occur at many different scales (nucleotide, exonic, gene or transcript), to make them comparable we projected each alteration type onto the gene body. We summarized each alteration type by its presence or absence within a single gene, yielding a binary value per type for each gene-sample pair.
The events we included in this analysis were: RNA editing, non-synonymous variants, expression, splicing alterations, copy-number alterations, fusions and alternative promoters. Each alteration type was summarized differently owing to their inherent differences.
RNA-editing events and non-synonymous variants can occur several times within a single gene body, so these events were denoted as 1 if they occurred at least once within a gene–sample pair.
For copy number, to obtain a single numerical value per gene-sample pair, the copy-number alteration was averaged over the gene body. Because we do not have matched normal samples against which to compare, we instead consider outlying events within each histotype as significant. Thus, a value of 1 was given to average copy-number alterations larger than 6 or smaller than 1.
Similar to non-synonymous variants, multiple splice events can occur within a gene body. The event with the most extreme PSI value within the gene body is selected as the candidate event for the gene. The candidate’s PSI value for a gene is compared over all samples within a histotype and it is set to 1 (that is, significant) only if it the absolute value of its z-score is larger than 6 and the standard deviation is larger than 0.01 within that histotype.
Similar to expression outliers, we calculate a z-score using the log-transformed upper-quartile normalized FPKM values with a pseudo-count of 1. All genes within a histotype with a standard deviation larger than zero and an absolute value larger than three were identified as an outlier. Alternative promoter outliers were calculated based on relative promoter activity within each cancer type. To binarize the promoter activity, a z-score cut-off of two over the relative expression distribution within each cancer type was used.
For ASE outliers, only genes with significant allelic imbalance (FDR ≤ 5% and allelic imbalance > 0.2, binomial test) were denoted as 1. All ASE events that were identified were further filtered to keep only genes that have not been identified as imprinted26.
In addition to the z-score-filtering mentioned above, we further filtered non-synonymous SNVs, RNA-editing events and splicing events such that they either induce a frameshift or the alternative region contains an HGMD variant112 of the category ‘damaging’.
It must be noted that in many cases, the z-score calculated is not from a Gaussian distribution, so some events may be missed or falsely included. Through our choice of very stringent z-score thresholds and functional filters, we hope that spurious outlier events are minimized.
Pathway analysis
For our pathway analysis, we used the TCGA pathway definitions to examine genes and pathways that have several alterations at both the DNA and RNA level113.
Co-occurrence analysis
The co-occurrence analysis was also performed on the aforementioned binarized gene-centric table, but only including variants, expression outliers, alternative promoters, alternative splicing and fusions. SCNA and ASE are excluded owing to a large number of anticipated co-occurrence. In this analysis, we required at least one gene of a given alteration pair to be a COSMIC gene. For each alteration pair, based on the number of donors with both alterations, one alteration only and neither alterations in a set of cancer samples, we performed Fisher’s exact test to determine whether the alteration pair was independent of each other. Such tests were followed by Benjamini–Hochberg multiple testing correction to obtain the FDR (or q values). To rule out the potential false-positive association caused by tissue-specific alterations, we performed the same analysis for each of the tumour types with at least 50 patients, and retained only those alteration pairs that were significantly associated in both the pan-cancer analysis and in at least one specific cancer indication. Among the significantly associated alteration pairs, the co-occurred pairs were those with odds ratio greater than 1. Pathway enrichment and visualization21,114 were conducted using the R package ReactomePA79. The circos plots were generated using the R package circlize115. The splicing related genes were derived from the genes annotated as ‘REACTOME_MRNA_SPLICING’ or ‘REACTOME_MRNA_SPLICING_MINOR_PATHWAY’ in the Molecular Signatures Database (MSigDB)116.
Identifying genes with heterogeneous mechanisms of alterations in cis
Genes with multiple heterogeneous mechanisms of RNA alteration were identified from associations of cis variants with gene expression, ASE, fusions and splicing. For gene expression, genes associated with somatic eQTL with FDR < 5% were selected. For ASE, the top 5% of genes ranked by the predicted contribution of somatic variants on ASE. For fusions, all RNA fusions with structural variant support were selected. For splicing, genes having somatic mutations within 10 bp of an annotated splice site or 3 bp of a branch point and associated splicing were selected. These associated splicing events also had to have a |z-score| greater than or equal to 3 and the difference of percent spliced in the outlier event was greater than or equal to 10%.
Recurrence analysis
The recurrence analysis was performed on the binarized gene-centric table for all nine alteration types. The recurrence analysis was performed in three main steps: (1) Aggregate within each alteration type across all samples. This results in a sum for each gene-alteration pair. (2) Convert the counts to ranks within each alteration. The smallest rank goes to the most frequently altered genes. Ranks are split evenly across ties. (3) To generate a single score for each gene, the second smallest rank across alterations is used as the score. To identify a score cut-off value for significantly altered genes, a null distribution was generated through permutation. The permutations were performed over the samples within each gene-alteration pair, this was done over all genes and samples 1,000 times, concatenating together all observations, results in 16.8 million permuted scores. P < 0.05 as derived from the null distribution was defined as significant, resulting in a score greater than or equal to 774 considered as significant.
WExT117 was used to test the significance of mutually exclusivity of RNA and DNA alterations. As further evidence that CDK12 alterations may have a functional affect, we find evidence of the previously detected link55 between a large tandem duplicator phenotype (here defined as more than 10 tandem duplications of size greater than 100 kb) and CDK12 somatic eQTL mutation (7 out of 18 somatic eQTL carriers are also among the 215 large tandem duplicator cases, P = 0.032, hypergeometric test).
Statistical tests
All common statistical tests are two-sided unless otherwise specified. No statistical methods were used to predetermine sample size. The experiments were not randomized and investigators were not blinded to allocation during experiments and outcome assessment.
Reporting summary
Further information on research design is available in the Nature Research Reporting Summary linked to this paper.
Online content
Any methods, additional references, Nature Research reporting summaries, source data, extended data, supplementary information, acknowledgements, peer review information; details of author contributions and competing interests; and statements of data and code availability are available at 10.1038/s41586-020-1970-0.
Supplementary information
This file contains Supplementary Results, 26 Supplementary Figures, and Supplementary Notes.
This zipped file contains Supplementary Tables 1-24 and a Supplementary Table Guide.
This file contains a full list of the PCAWG consortium.
Acknowledgements
Funding for this work was provided by the Damon Runyon Cancer Research Foundation (A.N.B.), European Research Council (RNAEDIT-649019, Q.-P.-H.). C.M.S. was supported by National Institutes of Health (NIH) training grants T32GM008646 and 2R25GM058903. K.-V.L., A.K., N.R.D., S.G.S. and G.R. received core funding from ETH Zurich and MSKCC (New York). This work was also partially supported by SPHN/PHRT Project (106 to G.R.). L.U., R.F.S. and O.S. received support from core funding of the EMBLand the EU Horizon2020 research and innovation programme (grant agreement N635290). R.F.S. and J.M. received support from the Helmholtz Foundation and the Max Delbrueck Center for Molecular Medicine. Y.H., F.L., F.Z. and Z.Z. received support from Beijing Advanced Innovation Centre for Genomics at Peking University, Key Technologies R&D Program (2016YFC0900100), National Natural Science Foundation of China (81573022, 31530036, 91742203). C.C., L.G., N.F. and A.B. received support from core funding of the EMBL and from EU FP7 Programme projects EurocanPlatform (grant agreement 260791) and CAGEKID (241669). J.G. received support from the Agency for Science, Technology and Research (A*STAR). D.D. received support from the Singapore International Graduate Award (SINGA) and A*STAR. We acknowledge the contributions of the many clinical networks across ICGC and TCGA who provided samples and data to the PCAWG Consortium, and the contributions of the Technical Working Group and the Germline Working Group of the PCAWG Consortium for collation, realignment and harmonized variant calling of the cancer genomes used in this study. We thank the patients and their families for their participation in the individual ICGC and TCGA projects.
Extended data figures and tables
Author contributions
The design of the study was contributed by C.C., N.R.D., D.D., N.A.F., Y.H., A.K., K.-V.L., F.L., Y.S., C.M.S., L.U., L.G., S.L., D.L., M.D.P., Q.X., F.Z., J.Z., P.B., S.E., K.A.H., Y.H., M.R.H., H.K., J.O.H., M.G.M., J.M., T.N., Q.P.-H., C.S.P., R.S., S.G.S., H.S., P.T., S.M.W., S.Z., P.A., C.J.C., M.M., B.F.F.O., K.W., H.Y., A.B., A.N.B., J.G., G.R., R.F.S., O.S. and Z.Z. (equal contributions by C.C., N.R.D., D.D., N.A.F., Y.H., A.K., K.-V.L., F.L., Y.S., C.M.S. and L.U.; jointly supervised and contributed by A.B., A.N.B. J.G., G.R., R.F.S., O.S. and Z.Z.). Data collection and coordination were carried out by N.A.F., A.K., K.-V.L., J.Z. M.D.P., Q.X., C.Y., K.A.H., P.B., R.S., S.G.S., B.F.F., A.B., G.R. and A.N.B. (equal contributions by N.A.F., A.K., K.-V.L., J.Z. M.D.P. and Q.X.; jointly supervised by A.B., G.R. and A.N.B.). Processing of RNA-seq data was carried out by N.A.F., A.K., K.-V.L., C.J.C., S.G.S., A.N.B., A.B. and G.R. (equal contributions by N.A.F., A.K. and K.-V.L.; jointly supervised by A.N.B., A.B. and G.R). Analyses of eQTLs were carried out by C.C., K.-V.L., N.A.F., A.K., L.U., H.K., S.M.W., J.O.K., A.B., R.F.S., G.R. and O.S. (equal contributions by C.C. and K.-V.L.; jointly supervised by A.B., R.F.S., G.R. and O.S.). Analyses of allelic expression were carried out by L.U., F.L., H.K., J.M., S.E., M.R.H., Z.Z., O.S. and R.F.S. (equal contributions by L.U. and F.L.; jointly supervised by Z.Z., O.S. and R.F.S.). Analyses of alternative splicing were carried out by A.K., Y.S., C.M.S., K.-V.L., S.G.S., M.G.M., G.R. and A.N.B. (equal contributions by A.K., Y.S. and C.M.S.; jointly supervised by G.R. and A.N.B.). Analyses of alternative promoters were carried out by D.D., T.N., C.C., K.-V.L., P.T. and J.G. Analyses of fusions were carried out by N.A.F., Y.H., L.G., A.B. and Z.Z. (equal contributions by N.A.F. and Y.H.; jointly supervised by A.B. and Z.Z.). Analyses of RNA editing were carried out by D.L., S.L., H.S., Y.H., S.Z., Q.P.-H., H.Y. and K.W (equal contributions by D.L. and S.L.; jointly supervised by H.Y. and K.W.). Mutational signature analysis was carried out by L.U., S.M.W., K.-V.L., R.F.S. and O.S. (jointly supervised by R.F.S. and O.S). Meta-analyses of transcriptome alterations were carried out by N.R.D., F.L., K.-V.L., F.Z., D.D., N.A.F., A.K., S.L., R.F.S., H.S., R.S., Y.H., S.G.S., A.B., A.N.B., Z.Z. and G.R. (jointly supervised by A.B., A.N.B., Z.Z. and G.R.). A.B., G.R. and A.N.B. coordinated the overall project as working group leaders. Writing was carried out by C.C., N.R.D., D.D., N.A.F., Y.H., A.K., K.-V.L., F.L., Y.S., C.M.S., L.U., A.B., A.N.B., J.G., G.R., R.F.S., O.S. and Z.Z. (equal contributions by C.C., N.R.D., D.D., N.A.F., Y.H., A.K., K.-V.L., F.L., Y.S., C.M.S. and L.U.; jointly supervised and contributed by A.B., A.N.B., J.G., G.R., R.F.S., O.S. and Z.Z.) with input from all other co-authors.
Data availability
Somatic and germline variant calls, mutational signatures, subclonal reconstructions, and other core data generated by the ICGC and TCGA PCAWG Consortium are described in an accompanying Article5 and are available for download at https://dcc.icgc.org/releases/PCAWG. Additional information on accessing the data, including raw read files, can be found at https://docs.icgc.org/pcawg/data/. In accordance with the data access policies of the ICGC and TCGA projects, most molecular, clinical and specimen data are in an open tier that does not require access approval. To access potentially identification information, such as germline alleles and underlying sequencing data, researchers will need to apply to the TCGA data access committee via dbGaP (https://dbgap.ncbi.nlm.nih.gov/aa/wga.cgi?page=login) for access to the TCGA portion of the dataset, and to the ICGC data access compliance office (http://icgc.org/daco) for the ICGC portion of the dataset. In addition, to access somatic SNVs derived from TCGA donors, researchers will also need to obtain dbGaP authorization. Data derived specifically from RNA-seq analysis can be found at https://dcc.icgc.org/releases/PCAWG/transcriptome. Subfolders contain identification and quantification of alternative promoter usage, alternative splicing, RNA fusions, gene expression, transcript-level expression and RNA editing. Identified eQTLs are in https://dcc.icgc.org/releases/PCAWG/transcriptome/eQTL and a binarized table indicating all RNA and DNA alterations for each gene can be found in the subfolder https://dcc.icgc.org/releases/PCAWG/transcriptome/recurrence_analyses/. In addition, quality-control metrics and metadata are also included. Some datasets are denoted with synXXXXX accession numbers and available at Synapse (https://www.synapse.org/).
Code availability
The core computational pipelines used by the PCAWG Consortium for alignment, quality control and variant calling are available to the public at https://dockstore.org/search?search=pcawg under the GNU General Public License v.3.0, which allows for reuse and distribution. Further details on code availability are in the Supplementary Information.
Competing interests
M.M. is a scientific advisory board chair of, and consultant for, OrigiMed, receives research funding from Bayer and Ono Pharma, and has patent royalties from LabCorp. G.R. is on the scientific advisory board of Computomics GmbH and receives research funding from Roche Diagnostics and Google. R.S. received honorariums for speaking at meeting organized by Roche and AstraZeneca. All the other authors have no competing interests.
Footnotes
Peer review information Nature thanks Nicolas Robine and the other anonymous reviewer(s) for their contribution to the peer review of this work.
Publisher’s note Springer Nature remains neutral with regard to jurisdictional claims in published maps and institutional affiliations.
A list of members and their affiliations appears at the end of the paper.
A list of members and their affiliations appears online.
These authors contributed equally: PCAWG Transcriptome Core Group, Claudia Calabrese, Natalie R. Davidson, Deniz Demircioğlu, Nuno A. Fonseca, Yao He, André Kahles, Kjong-Van Lehmann, Fenglin Liu, Yuichi Shiraishi, Cameron M. Soulette, Lara Urban
These authors jointly supervised this work: Alvis Brazma, Angela N. Brooks, Jonathan Göke, Gunnar Rätsch, Roland F. Schwarz, Oliver Stegle, Zemin Zhang
Change history
1/25/2023
A Correction to this paper has been published: 10.1038/s41586-022-05596-y
Contributor Information
Alvis Brazma, Email: brazma@ebi.ac.uk.
Angela N. Brooks, Email: anbrooks@ucsc.edu
Gunnar Rätsch, Email: raetsch@inf.ethz.ch.
PCAWG Transcriptome Core Group:
Claudia Calabrese, Natalie R. Davidson, Deniz Demircioğlu, Nuno A. Fonseca, Yao He, André Kahles, Kjong-Van Lehmann, Fenglin Liu, Yuichi Shiraishi, Cameron M. Soulette, and Lara Urban
PCAWG Transcriptome Working Group:
Nuno A. Fonseca, André Kahles, Kjong-Van Lehmann, Lara Urban, Cameron M. Soulette, Yuichi Shiraishi, Fenglin Liu, Yao He, Deniz Demircioğlu, Natalie R. Davidson, Claudia Calabrese, Junjun Zhang, Marc D. Perry, Qian Xiang, Liliana Greger, Siliang Li, Dongbing Liu, Stefan G. Stark, Fan Zhang, Samirkumar B. Amin, Peter Bailey, Aurélien Chateigner, Isidro Cortés-Ciriano, Brian Craft, Serap Erkek, Milana Frenkel-Morgenstern, Mary Goldman, Katherine A. Hoadley, Yong Hou, Matthew R. Huska, Ekta Khurana, Helena Kilpinen, Jan O. Korbel, Fabien C. Lamaze, Chang Li, Xiaobo Li, Xinyue Li, Xingmin Liu, Maximillian G. Marin, Julia Markowski, Tannistha Nandi, Morten M. Nielsen, Akinyemi I. Ojesina, Qiang Pan-Hammarström, Peter J. Park, Chandra Sekhar Pedamallu, Jakob S. Pedersen, Reiner Siebert, Hong Su, Patrick Tan, Bin Tean Teh, Jian Wang, Sebastian M. Waszak, Heng Xiong, Sergei Yakneen, Chen Ye, Christina Yung, Xiuqing Zhang, Liangtao Zheng, Jingchun Zhu, Shida Zhu, Philip Awadalla, Chad J. Creighton, Matthew Meyerson, B. F. Francis Ouellette, Kui Wu, Huanming Yang, Jonathan Göke, Roland F. Schwarz, Oliver Stegle, Zemin Zhang, Alvis Brazma, Gunnar Rätsch, and Angela N. Brooks
PCAWG Consortium:
Lauri A. Aaltonen, Federico Abascal, Adam Abeshouse, Hiroyuki Aburatani, David J. Adams, Nishant Agrawal, Keun Soo Ahn, Sung-Min Ahn, Hiroshi Aikata, Rehan Akbani, Kadir C. Akdemir, Hikmat Al-Ahmadie, Sultan T. Al-Sedairy, Fatima Al-Shahrour, Malik Alawi, Monique Albert, Kenneth Aldape, Ludmil B. Alexandrov, Adrian Ally, Kathryn Alsop, Eva G. Alvarez, Fernanda Amary, Samirkumar B. Amin, Brice Aminou, Ole Ammerpohl, Matthew J. Anderson, Yeng Ang, Davide Antonello, Pavana Anur, Samuel Aparicio, Elizabeth L. Appelbaum, Yasuhito Arai, Axel Aretz, Koji Arihiro, Shun-ichi Ariizumi, Joshua Armenia, Laurent Arnould, Sylvia Asa, Yassen Assenov, Gurnit Atwal, Sietse Aukema, J. Todd Auman, Miriam R. R. Aure, Philip Awadalla, Marta Aymerich, Gary D. Bader, Adrian Baez-Ortega, Matthew H. Bailey, Peter J. Bailey, Miruna Balasundaram, Saianand Balu, Pratiti Bandopadhayay, Rosamonde E. Banks, Stefano Barbi, Andrew P. Barbour, Jonathan Barenboim, Jill Barnholtz-Sloan, Hugh Barr, Elisabet Barrera, John Bartlett, Javier Bartolome, Claudio Bassi, Oliver F. Bathe, Daniel Baumhoer, Prashant Bavi, Stephen B. Baylin, Wojciech Bazant, Duncan Beardsmore, Timothy A. Beck, Sam Behjati, Andreas Behren, Beifang Niu, Cindy Bell, Sergi Beltran, Christopher Benz, Andrew Berchuck, Anke K. Bergmann, Erik N. Bergstrom, Benjamin P. Berman, Daniel M. Berney, Stephan H. Bernhart, Rameen Beroukhim, Mario Berrios, Samantha Bersani, Johanna Bertl, Miguel Betancourt, Vinayak Bhandari, Shriram G. Bhosle, Andrew V. Biankin, Matthias Bieg, Darell Bigner, Hans Binder, Ewan Birney, Michael Birrer, Nidhan K. Biswas, Bodil Bjerkehagen, Tom Bodenheimer, Lori Boice, Giada Bonizzato, Johann S. De Bono, Arnoud Boot, Moiz S. Bootwalla, Ake Borg, Arndt Borkhardt, Keith A. Boroevich, Ivan Borozan, Christoph Borst, Marcus Bosenberg, Mattia Bosio, Jacqueline Boultwood, Guillaume Bourque, Paul C. Boutros, G. Steven Bova, David T. Bowen, Reanne Bowlby, David D. L. Bowtell, Sandrine Boyault, Rich Boyce, Jeffrey Boyd, Alvis Brazma, Paul Brennan, Daniel S. Brewer, Arie B. Brinkman, Robert G. Bristow, Russell R. Broaddus, Jane E. Brock, Malcolm Brock, Annegien Broeks, Angela N. Brooks, Denise Brooks, Benedikt Brors, Søren Brunak, Timothy J. C. Bruxner, Alicia L. Bruzos, Alex Buchanan, Ivo Buchhalter, Christiane Buchholz, Susan Bullman, Hazel Burke, Birgit Burkhardt, Kathleen H. Burns, John Busanovich, Carlos D. Bustamante, Adam P. Butler, Atul J. Butte, Niall J. Byrne, Anne-Lise Børresen-Dale, Samantha J. Caesar-Johnson, Andy Cafferkey, Declan Cahill, Claudia Calabrese, Carlos Caldas, Fabien Calvo, Niedzica Camacho, Peter J. Campbell, Elias Campo, Cinzia Cantù, Shaolong Cao, Thomas E. Carey, Joana Carlevaro-Fita, Rebecca Carlsen, Ivana Cataldo, Mario Cazzola, Jonathan Cebon, Robert Cerfolio, Dianne E. Chadwick, Dimple Chakravarty, Don Chalmers, Calvin Wing Yiu Chan, Kin Chan, Michelle Chan-Seng-Yue, Vishal S. Chandan, David K. Chang, Stephen J. Chanock, Lorraine A. Chantrill, Aurélien Chateigner, Nilanjan Chatterjee, Kazuaki Chayama, Hsiao-Wei Chen, Jieming Chen, Ken Chen, Yiwen Chen, Zhaohong Chen, Andrew D. Cherniack, Jeremy Chien, Yoke-Eng Chiew, Suet-Feung Chin, Juok Cho, Sunghoon Cho, Jung Kyoon Choi, Wan Choi, Christine Chomienne, Zechen Chong, Su Pin Choo, Angela Chou, Angelika N. Christ, Elizabeth L. Christie, Eric Chuah, Carrie Cibulskis, Kristian Cibulskis, Sara Cingarlini, Peter Clapham, Alexander Claviez, Sean Cleary, Nicole Cloonan, Marek Cmero, Colin C. Collins, Ashton A. Connor, Susanna L. Cooke, Colin S. Cooper, Leslie Cope, Vincenzo Corbo, Matthew G. Cordes, Stephen M. Cordner, Isidro Cortés-Ciriano, Kyle Covington, Prue A. Cowin, Brian Craft, David Craft, Chad J. Creighton, Yupeng Cun, Erin Curley, Ioana Cutcutache, Karolina Czajka, Bogdan Czerniak, Rebecca A. Dagg, Ludmila Danilova, Maria Vittoria Davi, Natalie R. Davidson, Helen Davies, Ian J. Davis, Brandi N. Davis-Dusenbery, Kevin J. Dawson, Francisco M. De La Vega, Ricardo De Paoli-Iseppi, Timothy Defreitas, Angelo P. Dei Tos, Olivier Delaneau, John A. Demchok, Jonas Demeulemeester, German M. Demidov, Deniz Demircioğlu, Nening M. Dennis, Robert E. Denroche, Stefan C. Dentro, Nikita Desai, Vikram Deshpande, Amit G. Deshwar, Christine Desmedt, Jordi Deu-Pons, Noreen Dhalla, Neesha C. Dhani, Priyanka Dhingra, Rajiv Dhir, Anthony DiBiase, Klev Diamanti, Li Ding, Shuai Ding, Huy Q. Dinh, Luc Dirix, HarshaVardhan Doddapaneni, Nilgun Donmez, Michelle T. Dow, Ronny Drapkin, Oliver Drechsel, Ruben M. Drews, Serge Serge, Tim Dudderidge, Ana Dueso-Barroso, Andrew J. Dunford, Michael Dunn, Lewis Jonathan Dursi, Fraser R. Duthie, Ken Dutton-Regester, Jenna Eagles, Douglas F. Easton, Stuart Edmonds, Paul A. Edwards, Sandra E. Edwards, Rosalind A. Eeles, Anna Ehinger, Juergen Eils, Roland Eils, Adel El-Naggar, Matthew Eldridge, Kyle Ellrott, Serap Erkek, Georgia Escaramis, Shadrielle M. G. Espiritu, Xavier Estivill, Dariush Etemadmoghadam, Jorunn E. Eyfjord, Bishoy M. Faltas, Daiming Fan, Yu Fan, William C. Faquin, Claudiu Farcas, Matteo Fassan, Aquila Fatima, Francesco Favero, Nodirjon Fayzullaev, Ina Felau, Sian Fereday, Martin L. Ferguson, Vincent Ferretti, Lars Feuerbach, Matthew A. Field, J. Lynn Fink, Gaetano Finocchiaro, Cyril Fisher, Matthew W. Fittall, Anna Fitzgerald, Rebecca C. Fitzgerald, Adrienne M. Flanagan, Neil E. Fleshner, Paul Flicek, John A. Foekens, Kwun M. Fong, Nuno A. Fonseca, Christopher S. Foster, Natalie S. Fox, Michael Fraser, Scott Frazer, Milana Frenkel-Morgenstern, William Friedman, Joan Frigola, Catrina C. Fronick, Akihiro Fujimoto, Masashi Fujita, Masashi Fukayama, Lucinda A. Fulton, Robert S. Fulton, Mayuko Furuta, P. Andrew Futreal, Anja Füllgrabe, Stacey B. Gabriel, Steven Gallinger, Carlo Gambacorti-Passerini, Jianjiong Gao, Shengjie Gao, Levi Garraway, Øystein Garred, Erik Garrison, Dale W. Garsed, Nils Gehlenborg, Josep L. L. Gelpi, Joshy George, Daniela S. Gerhard, Clarissa Gerhauser, Jeffrey E. Gershenwald, Mark Gerstein, Moritz Gerstung, Gad Getz, Mohammed Ghori, Ronald Ghossein, Nasra H. Giama, Richard A. Gibbs, Bob Gibson, Anthony J. Gill, Pelvender Gill, Dilip D. Giri, Dominik Glodzik, Vincent J. Gnanapragasam, Maria Elisabeth Goebler, Mary J. Goldman, Carmen Gomez, Santiago Gonzalez, Abel Gonzalez-Perez, Dmitry A. Gordenin, James Gossage, Kunihito Gotoh, Ramaswamy Govindan, Dorthe Grabau, Janet S. Graham, Robert C. Grant, Anthony R. Green, Eric Green, Liliana Greger, Nicola Grehan, Sonia Grimaldi, Sean M. Grimmond, Robert L. Grossman, Adam Grundhoff, Gunes Gundem, Qianyun Guo, Manaswi Gupta, Shailja Gupta, Ivo G. Gut, Marta Gut, Jonathan Göke, Gavin Ha, Andrea Haake, David Haan, Siegfried Haas, Kerstin Haase, James E. Haber, Nina Habermann, Faraz Hach, Syed Haider, Natsuko Hama, Freddie C. Hamdy, Anne Hamilton, Mark P. Hamilton, Leng Han, George B. Hanna, Martin Hansmann, Nicholas J. Haradhvala, Olivier Harismendy, Ivon Harliwong, Arif O. Harmanci, Eoghan Harrington, Takanori Hasegawa, David Haussler, Steve Hawkins, Shinya Hayami, Shuto Hayashi, D. Neil Hayes, Stephen J. Hayes, Nicholas K. Hayward, Steven Hazell, Yao He, Allison P. Heath, Simon C. Heath, David Hedley, Apurva M. Hegde, David I. Heiman, Michael C. Heinold, Zachary Heins, Lawrence E. Heisler, Eva Hellstrom-Lindberg, Mohamed Helmy, Seong Gu Heo, Austin J. Hepperla, José María Heredia-Genestar, Carl Herrmann, Peter Hersey, Julian M. Hess, Holmfridur Hilmarsdottir, Jonathan Hinton, Satoshi Hirano, Nobuyoshi Hiraoka, Katherine A. Hoadley, Asger Hobolth, Ermin Hodzic, Jessica I. Hoell, Steve Hoffmann, Oliver Hofmann, Andrea Holbrook, Aliaksei Z. Holik, Michael A. Hollingsworth, Oliver Holmes, Robert A. Holt, Chen Hong, Eun Pyo Hong, Jongwhi H. Hong, Gerrit K. Hooijer, Henrik Hornshøj, Fumie Hosoda, Yong Hou, Volker Hovestadt, William Howat, Alan P. Hoyle, Ralph H. Hruban, Jianhong Hu, Taobo Hu, Xing Hua, Kuan-lin Huang, Mei Huang, Mi Ni Huang, Vincent Huang, Yi Huang, Wolfgang Huber, Thomas J. Hudson, Michael Hummel, Jillian A. Hung, David Huntsman, Ted R. Hupp, Jason Huse, Matthew R. Huska, Barbara Hutter, Carolyn M. Hutter, Daniel Hübschmann, Christine A. Iacobuzio-Donahue, Charles David Imbusch, Marcin Imielinski, Seiya Imoto, William B. Isaacs, Keren Isaev, Shumpei Ishikawa, Murat Iskar, S. M. Ashiqul Islam, Michael Ittmann, Sinisa Ivkovic, Jose M. G. Izarzugaza, Jocelyne Jacquemier, Valerie Jakrot, Nigel B. Jamieson, Gun Ho Jang, Se Jin Jang, Joy C. Jayaseelan, Reyka Jayasinghe, Stuart R. Jefferys, Karine Jegalian, Jennifer L. Jennings, Seung-Hyup Jeon, Lara Jerman, Yuan Ji, Wei Jiao, Peter A. Johansson, Amber L. Johns, Jeremy Johns, Rory Johnson, Todd A. Johnson, Clemency Jolly, Yann Joly, Jon G. Jonasson, Corbin D. Jones, David R. Jones, David T. W. Jones, Nic Jones, Steven J. M. Jones, Jos Jonkers, Young Seok Ju, Hartmut Juhl, Jongsun Jung, Malene Juul, Randi Istrup Juul, Sissel Juul, Natalie Jäger, Rolf Kabbe, Andre Kahles, Abdullah Kahraman, Vera B. Kaiser, Hojabr Kakavand, Sangeetha Kalimuthu, Christof von Kalle, Koo Jeong Kang, Katalin Karaszi, Beth Karlan, Rosa Karlić, Dennis Karsch, Katayoon Kasaian, Karin S. Kassahn, Hitoshi Katai, Mamoru Kato, Hiroto Katoh, Yoshiiku Kawakami, Jonathan D. Kay, Stephen H. Kazakoff, Marat D. Kazanov, Maria Keays, Electron Kebebew, Richard F. Kefford, Manolis Kellis, James G. Kench, Catherine J. Kennedy, Jules N. A. Kerssemakers, David Khoo, Vincent Khoo, Narong Khuntikeo, Ekta Khurana, Helena Kilpinen, Hark Kyun Kim, Hyung-Lae Kim, Hyung-Yong Kim, Hyunghwan Kim, Jaegil Kim, Jihoon Kim, Jong K. Kim, Youngwook Kim, Tari A. King, Wolfram Klapper, Kortine Kleinheinz, Leszek J. Klimczak, Stian Knappskog, Michael Kneba, Bartha M. Knoppers, Youngil Koh, Jan Komorowski, Daisuke Komura, Mitsuhiro Komura, Gu Kong, Marcel Kool, Jan O. Korbel, Viktoriya Korchina, Andrey Korshunov, Michael Koscher, Roelof Koster, Zsofia Kote-Jarai, Antonios Koures, Milena Kovacevic, Barbara Kremeyer, Helene Kretzmer, Markus Kreuz, Savitri Krishnamurthy, Dieter Kube, Kiran Kumar, Pardeep Kumar, Sushant Kumar, Yogesh Kumar, Ritika Kundra, Kirsten Kübler, Ralf Küppers, Jesper Lagergren, Phillip H. Lai, Peter W. Laird, Sunil R. Lakhani, Christopher M. Lalansingh, Emilie Lalonde, Fabien C. Lamaze, Adam Lambert, Eric Lander, Pablo Landgraf, Luca Landoni, Anita Langerød, Andrés Lanzós, Denis Larsimont, Erik Larsson, Mark Lathrop, Loretta M. S. Lau, Chris Lawerenz, Rita T. Lawlor, Michael S. Lawrence, Alexander J. Lazar, Ana Mijalkovic Lazic, Xuan Le, Darlene Lee, Donghoon Lee, Eunjung Alice Lee, Hee Jin Lee, Jake June-Koo Lee, Jeong-Yeon Lee, Juhee Lee, Ming Ta Michael Lee, Henry Lee-Six, Kjong-Van Lehmann, Hans Lehrach, Dido Lenze, Conrad R. Leonard, Daniel A. Leongamornlert, Ignaty Leshchiner, Louis Letourneau, Ivica Letunic, Douglas A. Levine, Lora Lewis, Tim Ley, Chang Li, Constance H. Li, Haiyan Irene Li, Jun Li, Lin Li, Shantao Li, Siliang Li, Xiaobo Li, Xiaotong Li, Xinyue Li, Yilong Li, Han Liang, Sheng-Ben Liang, Peter Lichter, Pei Lin, Ziao Lin, W. M. Linehan, Ole Christian Lingjærde, Dongbing Liu, Eric Minwei Liu, Fei-Fei Fei Liu, Fenglin Liu, Jia Liu, Xingmin Liu, Julie Livingstone, Dimitri Livitz, Naomi Livni, Lucas Lochovsky, Markus Loeffler, Georgina V. Long, Armando Lopez-Guillermo, Shaoke Lou, David N. Louis, Laurence B. Lovat, Yiling Lu, Yong-Jie Lu, Youyong Lu, Claudio Luchini, Ilinca Lungu, Xuemei Luo, Hayley J. Luxton, Andy G. Lynch, Lisa Lype, Cristina López, Carlos López-Otín, Eric Z. Ma, Yussanne Ma, Gaetan MacGrogan, Shona MacRae, Geoff Macintyre, Tobias Madsen, Kazuhiro Maejima, Andrea Mafficini, Dennis T. Maglinte, Arindam Maitra, Partha P. Majumder, Luca Malcovati, Salem Malikic, Giuseppe Malleo, Graham J. Mann, Luisa Mantovani-Löffler, Kathleen Marchal, Giovanni Marchegiani, Elaine R. Mardis, Adam A. Margolin, Maximillian G. Marin, Florian Markowetz, Julia Markowski, Jeffrey Marks, Tomas Marques-Bonet, Marco A. Marra, Luke Marsden, John W. M. Martens, Sancha Martin, Jose I. Martin-Subero, Iñigo Martincorena, Alexander Martinez-Fundichely, Yosef E. Maruvka, R. Jay Mashl, Charlie E. Massie, Thomas J. Matthew, Lucy Matthews, Erik Mayer, Simon Mayes, Michael Mayo, Faridah Mbabaali, Karen McCune, Ultan McDermott, Patrick D. McGillivray, Michael D. McLellan, John D. McPherson, John R. McPherson, Treasa A. McPherson, Samuel R. Meier, Alice Meng, Shaowu Meng, Andrew Menzies, Neil D. Merrett, Sue Merson, Matthew Meyerson, William Meyerson, Piotr A. Mieczkowski, George L. Mihaiescu, Sanja Mijalkovic, Tom Mikkelsen, Michele Milella, Linda Mileshkin, Christopher A. Miller, David K. Miller, Jessica K. Miller, Gordon B. Mills, Ana Milovanovic, Sarah Minner, Marco Miotto, Gisela Mir Arnau, Lisa Mirabello, Chris Mitchell, Thomas J. Mitchell, Satoru Miyano, Naoki Miyoshi, Shinichi Mizuno, Fruzsina Molnár-Gábor, Malcolm J. Moore, Richard A. Moore, Sandro Morganella, Quaid D. Morris, Carl Morrison, Lisle E. Mose, Catherine D. Moser, Ferran Muiños, Loris Mularoni, Andrew J. Mungall, Karen Mungall, Elizabeth A. Musgrove, Ville Mustonen, David Mutch, Francesc Muyas, Donna M. Muzny, Alfonso Muñoz, Jerome Myers, Ola Myklebost, Peter Möller, Genta Nagae, Adnan M. Nagrial, Hardeep K. Nahal-Bose, Hitoshi Nakagama, Hidewaki Nakagawa, Hiromi Nakamura, Toru Nakamura, Kaoru Nakano, Tannistha Nandi, Jyoti Nangalia, Mia Nastic, Arcadi Navarro, Fabio C. P. Navarro, David E. Neal, Gerd Nettekoven, Felicity Newell, Steven J. Newhouse, Yulia Newton, Alvin Wei Tian Ng, Anthony Ng, Jonathan Nicholson, David Nicol, Yongzhan Nie, G. Petur Nielsen, Morten Muhlig Nielsen, Serena Nik-Zainal, Michael S. Noble, Katia Nones, Paul A. Northcott, Faiyaz Notta, Brian D. O’Connor, Peter O’Donnell, Maria O’Donovan, Sarah O’Meara, Brian Patrick O’Neill, J. Robert O’Neill, David Ocana, Angelica Ochoa, Layla Oesper, Christopher Ogden, Hideki Ohdan, Kazuhiro Ohi, Lucila Ohno-Machado, Karin A. Oien, Akinyemi I. Ojesina, Hidenori Ojima, Takuji Okusaka, Larsson Omberg, Choon Kiat Ong, Stephan Ossowski, German Ott, B. F. Francis Ouellette, Christine P’ng, Marta Paczkowska, Salvatore Paiella, Chawalit Pairojkul, Marina Pajic, Qiang Pan-Hammarström, Elli Papaemmanuil, Irene Papatheodorou, Nagarajan Paramasivam, Ji Wan Park, Joong-Won Park, Keunchil Park, Kiejung Park, Peter J. Park, Joel S. Parker, Simon L. Parsons, Harvey Pass, Danielle Pasternack, Alessandro Pastore, Ann-Marie Patch, Iris Pauporté, Antonio Pea, John V. Pearson, Chandra Sekhar Pedamallu, Jakob Skou Pedersen, Paolo Pederzoli, Martin Peifer, Nathan A. Pennell, Charles M. Perou, Marc D. Perry, Gloria M. Petersen, Myron Peto, Nicholas Petrelli, Robert Petryszak, Stefan M. Pfister, Mark Phillips, Oriol Pich, Hilda A. Pickett, Todd D. Pihl, Nischalan Pillay, Sarah Pinder, Mark Pinese, Andreia V. Pinho, Esa Pitkänen, Xavier Pivot, Elena Piñeiro-Yáñez, Laura Planko, Christoph Plass, Paz Polak, Tirso Pons, Irinel Popescu, Olga Potapova, Aparna Prasad, Shaun R. Preston, Manuel Prinz, Antonia L. Pritchard, Stephenie D. Prokopec, Elena Provenzano, Xose S. Puente, Sonia Puig, Montserrat Puiggròs, Sergio Pulido-Tamayo, Gulietta M. Pupo, Colin A. Purdie, Michael C. Quinn, Raquel Rabionet, Janet S. Rader, Bernhard Radlwimmer, Petar Radovic, Benjamin Raeder, Keiran M. Raine, Manasa Ramakrishna, Kamna Ramakrishnan, Suresh Ramalingam, Benjamin J. Raphael, W. Kimryn Rathmell, Tobias Rausch, Guido Reifenberger, Jüri Reimand, Jorge Reis-Filho, Victor Reuter, Iker Reyes-Salazar, Matthew A. Reyna, Sheila M. Reynolds, Esther Rheinbay, Yasser Riazalhosseini, Andrea L. Richardson, Julia Richter, Matthew Ringel, Markus Ringnér, Yasushi Rino, Karsten Rippe, Jeffrey Roach, Lewis R. Roberts, Nicola D. Roberts, Steven A. Roberts, A. Gordon Robertson, Alan J. Robertson, Javier Bartolomé Rodriguez, Bernardo Rodriguez-Martin, F. Germán Rodríguez-González, Michael H. A. Roehrl, Marius Rohde, Hirofumi Rokutan, Gilles Romieu, Ilse Rooman, Tom Roques, Daniel Rosebrock, Mara Rosenberg, Philip C. Rosenstiel, Andreas Rosenwald, Edward W. Rowe, Romina Royo, Steven G. Rozen, Yulia Rubanova, Mark A. Rubin, Carlota Rubio-Perez, Vasilisa A. Rudneva, Borislav C. Rusev, Andrea Ruzzenente, Gunnar Rätsch, Radhakrishnan Sabarinathan, Veronica Y. Sabelnykova, Sara Sadeghi, S. Cenk Sahinalp, Natalie Saini, Mihoko Saito-Adachi, Gordon Saksena, Adriana Salcedo, Roberto Salgado, Leonidas Salichos, Richard Sallari, Charles Saller, Roberto Salvia, Michelle Sam, Jaswinder S. Samra, Francisco Sanchez-Vega, Chris Sander, Grant Sanders, Rajiv Sarin, Iman Sarrafi, Aya Sasaki-Oku, Torill Sauer, Guido Sauter, Robyn P. M. Saw, Maria Scardoni, Christopher J. Scarlett, Aldo Scarpa, Ghislaine Scelo, Dirk Schadendorf, Jacqueline E. Schein, Markus B. Schilhabel, Matthias Schlesner, Thorsten Schlomm, Heather K. Schmidt, Sarah-Jane Schramm, Stefan Schreiber, Nikolaus Schultz, Steven E. Schumacher, Roland F. Schwarz, Richard A. Scolyer, David Scott, Ralph Scully, Raja Seethala, Ayellet V. Segre, Iris Selander, Colin A. Semple, Yasin Senbabaoglu, Subhajit Sengupta, Elisabetta Sereni, Stefano Serra, Dennis C. Sgroi, Mark Shackleton, Nimish C. Shah, Sagedeh Shahabi, Catherine A. Shang, Ping Shang, Ofer Shapira, Troy Shelton, Ciyue Shen, Hui Shen, Rebecca Shepherd, Ruian Shi, Yan Shi, Yu-Jia Shiah, Tatsuhiro Shibata, Juliann Shih, Eigo Shimizu, Kiyo Shimizu, Seung Jun Shin, Yuichi Shiraishi, Tal Shmaya, Ilya Shmulevich, Solomon I. Shorser, Charles Short, Raunak Shrestha, Suyash S. Shringarpure, Craig Shriver, Shimin Shuai, Nikos Sidiropoulos, Reiner Siebert, Anieta M. Sieuwerts, Lina Sieverling, Sabina Signoretti, Katarzyna O. Sikora, Michele Simbolo, Ronald Simon, Janae V. Simons, Jared T. Simpson, Peter T. Simpson, Samuel Singer, Nasa Sinnott-Armstrong, Payal Sipahimalani, Tara J. Skelly, Marcel Smid, Jaclyn Smith, Karen Smith-McCune, Nicholas D. Socci, Heidi J. Sofia, Matthew G. Soloway, Lei Song, Anil K. Sood, Sharmila Sothi, Christos Sotiriou, Cameron M. Soulette, Paul N. Span, Paul T. Spellman, Nicola Sperandio, Andrew J. Spillane, Oliver Spiro, Jonathan Spring, Johan Staaf, Peter F. Stadler, Peter Staib, Stefan G. Stark, Lucy Stebbings, Ólafur Andri Stefánsson, Oliver Stegle, Lincoln D. Stein, Alasdair Stenhouse, Chip Stewart, Stephan Stilgenbauer, Miranda D. Stobbe, Michael R. Stratton, Jonathan R. Stretch, Adam J. Struck, Joshua M. Stuart, Henk G. Stunnenberg, Hong Su, Xiaoping Su, Ren X. Sun, Stephanie Sungalee, Hana Susak, Akihiro Suzuki, Fred Sweep, Monika Szczepanowski, Holger Sültmann, Takashi Yugawa, Angela Tam, David Tamborero, Benita Kiat Tee Tan, Donghui Tan, Patrick Tan, Hiroko Tanaka, Hirokazu Taniguchi, Tomas J. Tanskanen, Maxime Tarabichi, Roy Tarnuzzer, Patrick Tarpey, Morgan L. Taschuk, Kenji Tatsuno, Simon Tavaré, Darrin F. Taylor, Amaro Taylor-Weiner, Jon W. Teague, Bin Tean Teh, Varsha Tembe, Javier Temes, Kevin Thai, Sarah P. Thayer, Nina Thiessen, Gilles Thomas, Sarah Thomas, Alan Thompson, Alastair M. Thompson, John F. F. Thompson, R. Houston Thompson, Heather Thorne, Leigh B. Thorne, Adrian Thorogood, Grace Tiao, Nebojsa Tijanic, Lee E. Timms, Roberto Tirabosco, Marta Tojo, Stefania Tommasi, Christopher W. Toon, Umut H. Toprak, David Torrents, Giampaolo Tortora, Jörg Tost, Yasushi Totoki, David Townend, Nadia Traficante, Isabelle Treilleux, Jean-Rémi Trotta, Lorenz H. P. Trümper, Ming Tsao, Tatsuhiko Tsunoda, Jose M. C. Tubio, Olga Tucker, Richard Turkington, Daniel J. Turner, Andrew Tutt, Masaki Ueno, Naoto T. Ueno, Christopher Umbricht, Husen M. Umer, Timothy J. Underwood, Lara Urban, Tomoko Urushidate, Tetsuo Ushiku, Liis Uusküla-Reimand, Alfonso Valencia, David J. Van Den Berg, Steven Van Laere, Peter Van Loo, Erwin G. Van Meir, Gert G. Van den Eynden, Theodorus Van der Kwast, Naveen Vasudev, Miguel Vazquez, Ravikiran Vedururu, Umadevi Veluvolu, Shankar Vembu, Lieven P. C. Verbeke, Peter Vermeulen, Clare Verrill, Alain Viari, David Vicente, Caterina Vicentini, K. VijayRaghavan, Juris Viksna, Ricardo E. Vilain, Izar Villasante, Anne Vincent-Salomon, Tapio Visakorpi, Douglas Voet, Paresh Vyas, Ignacio Vázquez-García, Nick M. Waddell, Nicola Waddell, Claes Wadelius, Lina Wadi, Rabea Wagener, Jeremiah A. Wala, Jian Wang, Jiayin Wang, Linghua Wang, Qi Wang, Wenyi Wang, Yumeng Wang, Zhining Wang, Paul M. Waring, Hans-Jörg Warnatz, Jonathan Warrell, Anne Y. Warren, Sebastian M. Waszak, David C. Wedge, Dieter Weichenhan, Paul Weinberger, John N. Weinstein, Joachim Weischenfeldt, Daniel J. Weisenberger, Ian Welch, Michael C. Wendl, Johannes Werner, Justin P. Whalley, David A. Wheeler, Hayley C. Whitaker, Dennis Wigle, Matthew D. Wilkerson, Ashley Williams, James S. Wilmott, Gavin W. Wilson, Julie M. Wilson, Richard K. Wilson, Boris Winterhoff, Jeffrey A. Wintersinger, Maciej Wiznerowicz, Stephan Wolf, Bernice H. Wong, Tina Wong, Winghing Wong, Youngchoon Woo, Scott Wood, Bradly G. Wouters, Adam J. Wright, Derek W. Wright, Mark H. Wright, Chin-Lee Wu, Dai-Ying Wu, Guanming Wu, Jianmin Wu, Kui Wu, Yang Wu, Zhenggang Wu, Liu Xi, Tian Xia, Qian Xiang, Xiao Xiao, Rui Xing, Heng Xiong, Qinying Xu, Yanxun Xu, Hong Xue, Shinichi Yachida, Sergei Yakneen, Rui Yamaguchi, Takafumi N. Yamaguchi, Masakazu Yamamoto, Shogo Yamamoto, Hiroki Yamaue, Fan Yang, Huanming Yang, Jean Y. Yang, Liming Yang, Lixing Yang, Shanlin Yang, Tsun-Po Yang, Yang Yang, Xiaotong Yao, Marie-Laure Yaspo, Lucy Yates, Christina Yau, Chen Ye, Kai Ye, Venkata D. Yellapantula, Christopher J. Yoon, Sung-Soo Yoon, Fouad Yousif, Jun Yu, Kaixian Yu, Willie Yu, Yingyan Yu, Ke Yuan, Yuan Yuan, Denis Yuen, Christina K. Yung, Olga Zaikova, Jorge Zamora, Marc Zapatka, Jean C. Zenklusen, Thorsten Zenz, Nikolajs Zeps, Cheng-Zhong Zhang, Fan Zhang, Hailei Zhang, Hongwei Zhang, Hongxin Zhang, Jiashan Zhang, Jing Zhang, Junjun Zhang, Xiuqing Zhang, Xuanping Zhang, Yan Zhang, Zemin Zhang, Zhongming Zhao, Liangtao Zheng, Xiuqing Zheng, Wanding Zhou, Yong Zhou, Bin Zhu, Hongtu Zhu, Jingchun Zhu, Shida Zhu, Lihua Zou, Xueqing Zou, Anna deFazio, Nicholas van As, Carolien H. M. van Deurzen, Marc J. van de Vijver, L. van’t Veer, and Christian von Mering
Extended data
is available for this paper at 10.1038/s41586-020-1970-0.
Supplementary information
is available for this paper at 10.1038/s41586-020-1970-0.
References
- 1.Weinhold, N., Jacobsen, A., Schultz, N., Sander, C. & Lee, W. Genome-wide analysis of noncoding regulatory mutations in cancer. Nat. Genet. 46, 1160–1165 (2014). [DOI] [PMC free article] [PubMed] [Google Scholar]
- 2.Owens, M. A., Horten, B. C. & Da Silva, M. M. HER2 amplification ratios by fluorescence in situ hybridization and correlation with immunohistochemistry in a cohort of 6556 breast cancer tissues. Clin. Breast Cancer5, 63–69 (2004). [DOI] [PubMed] [Google Scholar]
- 3.Climente-González, H., Porta-Pardo, E., Godzik, A. & Eyras, E. The functional impact of alternative splicing in cancer. Cell Reports20, 2215–2226 (2017). [DOI] [PubMed] [Google Scholar]
- 4.Faderl, S. et al. The biology of chronic myeloid leukemia. N. Engl. J. Med. 341, 164–172 (1999). [DOI] [PubMed] [Google Scholar]
- 5.The ICGC/TCGA Pan-Cancer Analysis of Whole Genomes Network. Pan-cancer analysis of whole genomes. Nature10.1038/s41586-020-1969-6 (2020).
- 6.Gerstung, M. et al. The evolutionary history of 2,658 cancers. Nature10.1038/s41586-019-1907-7 (2020). [DOI] [PMC free article] [PubMed]
- 7.Li, Y. et al. Patterns of somatic structural variation in human cancer genomes. Nature10.1038/s41586-019-1913-9 (2020). [DOI] [PMC free article] [PubMed]
- 8.Rheinbay, E. et al. Analyses of non-coding somatic drivers in 2,693 cancer whole genomes. Nature10.1038/s41586-020-1965-x (2020). [DOI] [PMC free article] [PubMed]
- 9.Alexandrov, L. B. et al. The repertoire of mutational signatures in human cancer. Nature10.1038/s41586-020-1943-3 (2020). [DOI] [PMC free article] [PubMed]
- 10.GTEx Consortium. Genetic effects on gene expression across human tissues. Nature550, 204–213 (2017). [DOI] [PMC free article] [PubMed] [Google Scholar]
- 11.Kilpinen, H. et al. Common genetic variation drives molecular heterogeneity in human iPSCs. Nature546, 370–375 (2017). [DOI] [PMC free article] [PubMed] [Google Scholar]
- 12.Fredriksson, N. J., Ny, L., Nilsson, J. A. & Larsson, E. Systematic analysis of noncoding somatic mutations and gene expression alterations across 14 tumor types. Nat. Genet. 46, 1258–1263 (2014). [DOI] [PubMed] [Google Scholar]
- 13.Gong, J. et al. PancanQTL: systematic identification of cis-eQTLs and trans-eQTLs in 33 cancer types. Nucleic Acids Res. 46, D971–D976 (2018). [DOI] [PMC free article] [PubMed] [Google Scholar]
- 14.Bajrami, I. et al. Genome-wide profiling of genetic synthetic lethality identifies CDK12 as a novel determinant of PARP1/2 inhibitor sensitivity. Cancer Res. 74, 287–297 (2014). [DOI] [PMC free article] [PubMed] [Google Scholar]
- 15.Havelange, V. et al. IRF4 mutations in chronic lymphocytic leukemia. Blood118, 2827–2829 (2011). [DOI] [PMC free article] [PubMed] [Google Scholar]
- 16.Roadmap Epigenomics Consortium et al. Integrative analysis of 111 reference human epigenomes. Nature518, 317–330 (2015). [DOI] [PMC free article] [PubMed] [Google Scholar]
- 17.Zheng, C. L. et al. Transcription restores DNA repair to heterochromatin, determining regional mutation rates in cancer genomes. Cell Reports9, 1228–1234 (2014). [DOI] [PMC free article] [PubMed] [Google Scholar]
- 18.Hanafusa, T., Mohamed, A. E. A., Domae, S., Nakayama, E. & Ono, T. Serological identification of Tektin5 as a cancer/testis antigen and its immunogenicity. BMC Cancer12, 520 (2012). [DOI] [PMC free article] [PubMed] [Google Scholar]
- 19.Alexandrov, L. B. et al. Signatures of mutational processes in human cancer. Nature500, 415–421 (2013). [DOI] [PMC free article] [PubMed] [Google Scholar]
- 20.Milacic, M. et al. Annotating cancer variants and anti-cancer therapeutics in reactome. Cancers (Basel)4, 1180–1211 (2012). [DOI] [PMC free article] [PubMed] [Google Scholar]
- 21.Fabregat, A. et al. The Reactome pathway Knowledgebase. Nucleic Acids Res. 44, D481–D487 (2016). [DOI] [PMC free article] [PubMed] [Google Scholar]
- 22.Kvam, E. & Tyrrell, R. M. The role of melanin in the induction of oxidative DNA base damage by ultraviolet A irradiation of DNA or melanoma cells. J. Invest. Dermatol. 113, 209–213 (1999). [DOI] [PubMed] [Google Scholar]
- 23.Jimbow, K., Chen, H., Park, J. S. & Thomas, P. D. Increased sensitivity of melanocytes to oxidative stress and abnormal expression of tyrosinase-related protein in vitiligo. Br. J. Dermatol. 144, 55–65 (2001). [DOI] [PubMed] [Google Scholar]
- 24.Pilger, A. & Rüdiger, H. W. 8-Hydroxy-2′-deoxyguanosine as a marker of oxidative DNA damage related to occupational and environmental exposures. Int. Arch. Occup. Environ. Health80, 1–15 (2006). [DOI] [PubMed] [Google Scholar]
- 25.Premi, S. & Brash, D. E. Unanticipated role of melanin in causing carcinogenic cyclobutane pyrimidine dimmers. Mol. Cell. Oncol. 3, e1033588 (2015). [DOI] [PMC free article] [PubMed] [Google Scholar]
- 26.Morison, I. M., Ramsay, J. P. & Spencer, H. G. A census of mammalian imprinting. Trends Genet. 21, 457–465 (2005). [DOI] [PubMed] [Google Scholar]
- 27.Lindeboom, R. G. H., Supek, F. & Lehner, B. The rules and impact of nonsense-mediated mRNA decay in human cancers. Nat. Genet. 48, 1112–1118 (2016). [DOI] [PMC free article] [PubMed] [Google Scholar]
- 28.Demircioğlu, D. et al. A pan-cancer transcriptome analysis reveals pervasive regulation through alternative promoters. Cell178, 1465–1477.e17 (2019). [DOI] [PubMed] [Google Scholar]
- 29.Reyes, A. & Huber, W. Alternative start and termination sites of transcription drive most transcript isoform differences across human tissues. Nucleic Acids Res. 46, 582–592 (2018). [DOI] [PMC free article] [PubMed] [Google Scholar]
- 30.Feng, G. et al. Ubiquitously expressed genes participate in cell-specific functions via alternative promoter usage. EMBO Rep. 17, 1304–1313 (2016). [DOI] [PMC free article] [PubMed] [Google Scholar]
- 31.Huang, F. W. et al. Highly recurrent TERT promoter mutations in human melanoma. Science339, 957–959 (2013). [DOI] [PMC free article] [PubMed] [Google Scholar]
- 32.Oltean, S. & Bates, D. O. Hallmarks of alternative splicing in cancer. Oncogene33, 5311–5318 (2014). [DOI] [PubMed] [Google Scholar]
- 33.Jung, H. et al. Intron retention is a widespread mechanism of tumor-suppressor inactivation. Nat. Genet. 47, 1242–1248 (2015). [DOI] [PubMed] [Google Scholar]
- 34.Kahles, A. et al. Comprehensive analysis of alternative splicing across tumors from 8,705 patients. Cancer Cell34, 211–224.e6 (2018). [DOI] [PMC free article] [PubMed] [Google Scholar]
- 35.Shiraishi, Y. et al. A comprehensive characterization of cis-acting splicing-associated variants in human cancer. Genome Res. 28, 1111–1125 (2018). [DOI] [PMC free article] [PubMed] [Google Scholar]
- 36.Sorek, R. The birth of new exons: mechanisms and evolutionary consequences. RNA13, 1603–1608 (2007). [DOI] [PMC free article] [PubMed] [Google Scholar]
- 37.Mertens, F., Johansson, B., Fioretos, T. & Mitelman, F. The emerging complexity of gene fusions in cancer. Nat. Rev. Cancer15, 371–381 (2015). [DOI] [PubMed] [Google Scholar]
- 38.Melé, M. et al. Human genomics. The human transcriptome across tissues and individuals. Science348, 660–665 (2015). [DOI] [PMC free article] [PubMed] [Google Scholar]
- 39.Matsubara, D. et al. Identification of CCDC6-RET fusion in the human lung adenocarcinoma cell line, LC-2/ad. J. Thorac. Oncol. 7, 1872–1876 (2012). [DOI] [PubMed] [Google Scholar]
- 40.Carneiro, B. A. et al. FGFR3-TACC3: a novel gene fusion in cervical cancer. Gynecol Oncol Rep13, 53–56 (2015). [DOI] [PMC free article] [PubMed] [Google Scholar]
- 41.Lee, M. et al. ChimerDB 3.0: an enhanced database for fusion genes from cancer transcriptome and literature data mining. Nucleic Acids Res. 45 (D1), D784–D789 (2017). [DOI] [PMC free article] [PubMed] [Google Scholar]
- 42.Knezevich, S. R., McFadden, D. E., Tao, W., Lim, J. F. & Sorensen, P. H. A novel ETV6-NTRK3 gene fusion in congenital fibrosarcoma. Nat. Genet. 18, 184–187 (1998). [DOI] [PubMed] [Google Scholar]
- 43.Nacu, S. et al. Deep RNA sequencing analysis of readthrough gene fusions in human prostate adenocarcinoma and reference samples. BMC Med. Genomics4, 11 (2011). [DOI] [PMC free article] [PubMed] [Google Scholar]
- 44.Jia, Y., Xie, Z. & Li, H. Intergenically spliced chimeric RNAs in cancer. Trends Cancer2, 475–484 (2016). [DOI] [PMC free article] [PubMed] [Google Scholar]
- 45.Greger, L. et al. Tandem RNA chimeras contribute to transcriptome diversity in human population and are associated with intronic genetic variants. PLoS ONE 9, e104567 (2014). [DOI] [PMC free article] [PubMed] [Google Scholar]
- 46.Tomlins, S. A. et al. Recurrent fusion of TMPRSS2 and ETS transcription factor genes in prostate cancer. Science310, 644–648 (2005). [DOI] [PubMed] [Google Scholar]
- 47.Koboldt, D. C. et al. VarScan 2: somatic mutation and copy number alteration discovery in cancer by exome sequencing. Genome Res. 22, 568–576 (2012). [DOI] [PMC free article] [PubMed] [Google Scholar]
- 48.Lawrence, M. S. et al. Mutational heterogeneity in cancer and the search for new cancer-associated genes. Nature499, 214–218 (2013). [DOI] [PMC free article] [PubMed] [Google Scholar]
- 49.Eilertsen, I. A. et al. Alternative splicing expands the prognostic impact of KRAS in microsatellite stable primary colorectal cancer. Int. J. Cancer144, 841–847 (2019). [DOI] [PMC free article] [PubMed] [Google Scholar]
- 50.Ji, X. et al. αCP binding to a cytosine-rich subset of polypyrimidine tracts drives a novel pathway of cassette exon splicing in the mammalian transcriptome. Nucleic Acids Res. 44, 2283–2297 (2016). [DOI] [PMC free article] [PubMed] [Google Scholar]
- 51.Stransky, N., Cerami, E., Schalm, S., Kim, J. L. & Lengauer, C. The landscape of kinase fusions in cancer. Nat. Commun. 5, 4846 (2014). [DOI] [PMC free article] [PubMed] [Google Scholar]
- 52.Cancer Genome Atlas Research Network. Comprehensive molecular profiling of lung adenocarcinoma. Nature511, 543–550 (2014). [DOI] [PMC free article] [PubMed] [Google Scholar]
- 53.Forbes, S. A. et al. COSMIC: somatic cancer genetics at high-resolution. Nucleic Acids Res. 45 (D1), D777–D783 (2017). [DOI] [PMC free article] [PubMed] [Google Scholar]
- 54.Blazek, D. et al. The Cyclin K/Cdk12 complex maintains genomic stability via regulation of expression of DNA damage response genes. Genes Dev. 25, 2158–2172 (2011). [DOI] [PMC free article] [PubMed] [Google Scholar]
- 55.Menghi, F. et al. The tandem duplicator phenotype is a prevalent genome-wide cancer configuration driven by distinct gene mutations. Cancer Cell34, 197–210.e5 (2018). [DOI] [PMC free article] [PubMed] [Google Scholar]
- 56.Dawson, M. A. & Kouzarides, T. Cancer epigenetics: from mechanism to therapy. Cell150, 12–27 (2012). [DOI] [PubMed] [Google Scholar]
- 57.Zhang, X. et al. Identification of focally amplified lineage-specific super-enhancers in human epithelial cancers. Nat. Genet. 48, 176–182 (2016). [DOI] [PMC free article] [PubMed] [Google Scholar]
- 58.Dobin, A. et al. STAR: ultrafast universal RNA-seq aligner. Bioinformatics29, 15–21 (2013). [DOI] [PMC free article] [PubMed] [Google Scholar]
- 59.Kim, D. et al. TopHat2: accurate alignment of transcriptomes in the presence of insertions, deletions and gene fusions. Genome Biol. 14, R36 (2013). [DOI] [PMC free article] [PubMed] [Google Scholar]
- 60.Harrow, J. et al. GENCODE: the reference human genome annotation for The ENCODE Project. Genome Res. 22, 1760–1774 (2012). [DOI] [PMC free article] [PubMed] [Google Scholar]
- 61.Fonseca, N. A., Petryszak, R., Marioni, J. & Brazma, A. iRAP - an integrated RNA-seq analysis pipeline. Preprint at https://www.bioRxiv.org/content/10.1101/005991v1 (2014).
- 62.Bioinformatics, B. FastQC: a quality control tool for high throughput sequence data; http://www.bioinformatics.babraham.ac.uk/projects/fastqc (2011).
- 63.Cancer Genome Atlas Research Network. The molecular taxonomy of primary prostate cancer. Cell163, 1011–1025 (2015). [DOI] [PMC free article] [PubMed] [Google Scholar]
- 64.Li, H. et al. The Sequence Alignment/Map format and SAMtools. Bioinformatics25, 2078–2079 (2009). [DOI] [PMC free article] [PubMed] [Google Scholar]
- 65.Anders, S., Pyl, P. T. & Huber, W. HTSeq—a Python framework to work with high-throughput sequencing data. Bioinformatics31, 166–169 (2015). [DOI] [PMC free article] [PubMed] [Google Scholar]
- 66.Bray, N. L., Pimentel, H., Melsted, P. & Pachter, L. Near-optimal probabilistic RNA-seq quantification. Nat. Biotechnol. 34, 525–527 (2016). [DOI] [PubMed] [Google Scholar]
- 67.Mortazavi, A., Williams, B. A., McCue, K., Schaeffer, L. & Wold, B. Mapping and quantifying mammalian transcriptomes by RNA-Seq. Nat. Methods5, 621–628 (2008). [DOI] [PubMed] [Google Scholar]
- 68.Krijthe, J. H. Rtsne: t-distributed stochastic neighbor embedding using barnes-hut implementation; https://github.com/jkrijthe/Rtsne (2015).
- 69.Dentro, S. C. et al. Portraits of genetic intra-tumour heterogeneity and subclonal selection across cancer types. Preprint at https://www.biorxiv.org/content/10.1101/312041v4 (2018).
- 70.Kahles, A., Ong, C. S., Zhong, Y. & Rätsch, G. SplAdder: identification, quantification and testing of alternative splicing events from RNA-Seq data. Bioinformatics32, 1840–1847 (2016). [DOI] [PMC free article] [PubMed] [Google Scholar]
- 71.Pedregosa, F. et al. Scikit-learn: machine learning in python. J. Mach. Learn. Res. 12, 2825–2830 (2011). [Google Scholar]
- 72.Stegle, O., Parts, L., Piipari, M., Winn, J. & Durbin, R. Using probabilistic estimation of expression residuals (PEER) to obtain increased power and interpretability of gene expression analyses. Nat. Protocols7, 500–507 (2012). [DOI] [PMC free article] [PubMed] [Google Scholar]
- 73.GTEx Consortium. The Genotype-Tissue Expression (GTEx) project. Nat. Genet. 45, 580–585 (2013). [DOI] [PMC free article] [PubMed] [Google Scholar]
- 74.The Gene Ontology Consortium. Gene Ontology: tool for the unification of biology. Nat. Genet. 25, 25–29 (2000). [DOI] [PMC free article] [PubMed] [Google Scholar]
- 75.The Gene Ontology Consortium. Gene Ontology Consortium: going forward. Nucleic Acids Res. 43, D1049–D1056 (2015). [DOI] [PMC free article] [PubMed] [Google Scholar]
- 76.Durinck, S., Spellman, P. T., Birney, E. & Huber, W. Mapping identifiers for the integration of genomic datasets with the R/Bioconductor package biomaRt. Nat. Protocols4, 1184–1191 (2009). [DOI] [PMC free article] [PubMed] [Google Scholar]
- 77.Durinck, S. et al. BioMart and Bioconductor: a powerful link between biological databases and microarray data analysis. Bioinformatics21, 3439–3440 (2005). [DOI] [PubMed] [Google Scholar]
- 78.Yu, G., Wang, L.-G., Han, Y. & He, Q.-Y. clusterProfiler: an R package for comparing biological themes among gene clusters. OMICS16, 284–287 (2012). [DOI] [PMC free article] [PubMed] [Google Scholar]
- 79.Yu, G. & He, Q.-Y. ReactomePA: an R/Bioconductor package for reactome pathway analysis and visualization. Mol. Biosyst. 12, 477–479 (2016). [DOI] [PubMed] [Google Scholar]
- 80.Li, H. A statistical framework for SNP calling, mutation discovery, association mapping and population genetical parameter estimation from sequencing data. Bioinformatics27, 2987–2993 (2011). [DOI] [PMC free article] [PubMed] [Google Scholar]
- 81.Lippert, C., Casale, F. P., Rakitsch, B. & Stegle, O. LIMIX: genetic analysis of multiple traits. Preprint at https://www.bioRxiv.org/content/ 10.1101/003905v2 (2014).
- 82.Davis, J. R. et al. An efficient multiple-testing adjustment for eQTL studies that accounts for linkage disequilibrium between variants. Am. J. Hum. Genet. 98, 216–224 (2016). [DOI] [PMC free article] [PubMed] [Google Scholar]
- 83.Pers, T. H., Timshel, P. & Hirschhorn, J. N. SNPsnap: a Web-based tool for identification and annotation of matched SNPs. Bioinformatics31, 418–420 (2015). [DOI] [PMC free article] [PubMed] [Google Scholar]
- 84.Fan, Y. et al. MuSE: accounting for tumor heterogeneity using a sample-specific error model improves sensitivity and specificity in mutation calling from sequencing data. Genome Biol. 17, 178 (2016). [DOI] [PMC free article] [PubMed] [Google Scholar]
- 85.Quinlan, A. R. & Hall, I. M. BEDTools: a flexible suite of utilities for comparing genomic features. Bioinformatics26, 841–842 (2010). [DOI] [PMC free article] [PubMed] [Google Scholar]
- 86.Corces, M. R. et al. The chromatin accessibility landscape of primary human cancers. Science362, 362 (2018). [DOI] [PMC free article] [PubMed] [Google Scholar]
- 87.Zhang, W. et al. A global transcriptional network connecting noncoding mutations to changes in tumor gene expression. Nat. Genet. 50, 613–620 (2018). [DOI] [PMC free article] [PubMed] [Google Scholar]
- 88.Smith, K. S. et al. Signatures of accelerated somatic evolution in gene promoters in multiple cancer types. Nucleic Acids Res. 43, 5307–5317 (2015). [DOI] [PMC free article] [PubMed] [Google Scholar]
- 89.Fishilevich, S. et al. GeneHancer: genome-wide integration of enhancers and target genes in GeneCards. Database2017, 2017 (2017). [DOI] [PMC free article] [PubMed] [Google Scholar]
- 90.Haeussler, M. et al. The UCSC Genome Browser database: 2019 update. Nucleic Acids Res. 47, D853–D858 (2019). [DOI] [PMC free article] [PubMed] [Google Scholar]
- 91.ENCODE Project Consortium. An integrated encyclopedia of DNA elements in the human genome. Nature489, 57–74 (2012). [DOI] [PMC free article] [PubMed] [Google Scholar]
- 92.Wang, C. et al. Systematic identification of genes with a cancer-testis expression pattern in 19 cancer types. Nat. Commun. 7, 10499 (2016). [DOI] [PMC free article] [PubMed] [Google Scholar]
- 93.Wallace, C. Statistical testing of shared genetic control for potentially related traits. Genet. Epidemiol. 37, 802–813 (2013). [DOI] [PMC free article] [PubMed] [Google Scholar]
- 94.Baron, R. M. & Kenny, D. A. The moderator-mediator variable distinction in social psychological research: conceptual, strategic, and statistical considerations. J. Pers. Soc. Psychol. 51, 1173–1182 (1986). [DOI] [PubMed] [Google Scholar]
- 95.Preacher, K. J. & Hayes, A. F. SPSS and SAS procedures for estimating indirect effects in simple mediation models. Behav. Res. Methods Instrum. Comput. 36, 717–731 (2004). [DOI] [PubMed] [Google Scholar]
- 96.Rosseel, Y. lavaan: AnRPackage for structural equation modeling. J. Stat. Softw. 48, 2 (2012). [Google Scholar]
- 97.Tingley, D., Yamamoto, T., Hirose, K., Keele, L. & Imai, K. mediation:RPackage for causal mediation analysis. J. Stat. Softw. 59, 5 (2014). [Google Scholar]
- 98.Howie, B. N., Donnelly, P. & Marchini, J. A flexible and accurate genotype imputation method for the next generation of genome-wide association studies. PLoS Genet. 5, e1000529 (2009). [DOI] [PMC free article] [PubMed] [Google Scholar]
- 99.Nik-Zainal, S. et al. The life history of 21 breast cancers. Cell149, 994–1007 (2012). [DOI] [PMC free article] [PubMed] [Google Scholar]
- 100.McLaren, W. et al. The Ensembl variant effect predictor. Genome Biol. 17, 122 (2016). [DOI] [PMC free article] [PubMed] [Google Scholar]
- 101.Castel, S. E., Levy-Moonshine, A., Mohammadi, P., Banks, E. & Lappalainen, T. Tools and best practices for data processing in allelic expression analysis. Genome Biol. 16, 195 (2015). [DOI] [PMC free article] [PubMed] [Google Scholar]
- 102.Subramanian, A. et al. Gene set enrichment analysis: a knowledge-based approach for interpreting genome-wide expression profiles. Proc. Natl Acad. Sci. USA102, 15545–15550 (2005). [DOI] [PMC free article] [PubMed] [Google Scholar]
- 103.Frith, M. C. et al. A code for transcription initiation in mammalian genomes. Genome Res. 18, 1–12 (2008). [DOI] [PMC free article] [PubMed] [Google Scholar]
- 104.Signal, B., Gloss, B. S., Dinger, M. E. & Mercer, T. R. Machine learning annotation of human branchpoints. Bioinformatics34, 920–927 (2018). [DOI] [PubMed] [Google Scholar]
- 105.Mercer, T. R. et al. Genome-wide discovery of human splicing branchpoints. Genome Res. 25, 290–303 (2015). [DOI] [PMC free article] [PubMed] [Google Scholar]
- 106.Ge, H. et al. FusionMap: detecting fusion genes from next-generation sequencing data at base-pair resolution. Bioinformatics27, 1922–1928 (2011). [DOI] [PubMed] [Google Scholar]
- 107.Nicorici, D. et al. FusionCatcher - a tool for finding somatic fusion genes in paired-end RNA-sequencing data. Preprint at https://www.bioRxiv.org/content/10.1101/011650v1 (2014).
- 108.Han, L. et al. The Genomic Landscape and Clinical Relevance of A-to-I RNA Editing in Human Cancers. Cancer Cell28, 515–528 (2015). [DOI] [PMC free article] [PubMed] [Google Scholar]
- 109.Li, Q. et al. Caste-specific RNA editomes in the leaf-cutting ant Acromyrmex echinatior. Nat. Commun. 5, 4943 (2014). [DOI] [PMC free article] [PubMed] [Google Scholar]
- 110.Genome of the Netherlands Consortium. Whole-genome sequence variation, population structure and demographic history of the Dutch population. Nat. Genet. 46, 818–825 (2014). [DOI] [PubMed] [Google Scholar]
- 111.Wang, K., Li, M. & Hakonarson, H. ANNOVAR: functional annotation of genetic variants from high-throughput sequencing data. Nucleic Acids Res. 38, e164 (2010). [DOI] [PMC free article] [PubMed] [Google Scholar]
- 112.Stenson, P. D. et al. The Human Gene Mutation Database: towards a comprehensive repository of inherited mutation data for medical research, genetic diagnosis and next-generation sequencing studies. Hum. Genet. 136, 665–677 (2017). [DOI] [PMC free article] [PubMed] [Google Scholar]
- 113.Sanchez-Vega, F. et al. Oncogenic signaling pathways in the cancer genome atlas. Cell173, 321–337.e10 (2018). [DOI] [PMC free article] [PubMed] [Google Scholar]
- 114.Merico, D., Isserlin, R., Stueker, O., Emili, A. & Bader, G. D. Enrichment map: a network-based method for gene-set enrichment visualization and interpretation. PLoS ONE 5, e13984 (2010). [DOI] [PMC free article] [PubMed] [Google Scholar]
- 115.Gu, Z., Gu, L., Eils, R., Schlesner, M. & Brors, B. circlize implements and enhances circular visualization in R. Bioinformatics30, 2811–2812 (2014). [DOI] [PubMed] [Google Scholar]
- 116.Liberzon, A. et al. Molecular signatures database (MSigDB) 3.0. Bioinformatics27, 1739–1740 (2011). [DOI] [PMC free article] [PubMed] [Google Scholar]
- 117.Leiserson, M. D. M., Reyna, M. A. & Raphael, B. J. A weighted exact test for mutually exclusive mutations in cancer. Bioinformatics32, i736–i745 (2016). [DOI] [PMC free article] [PubMed] [Google Scholar]
- 118.Rafnar, T. et al. Sequence variants at the TERT-CLPTM1L locus associate with many cancer types. Nat. Genet. 41, 221–227(2009). [DOI] [PMC free article] [PubMed] [Google Scholar]
- 119.Bojesen, S. E. et al. Multiple independent variants at the TERT locus are associated with telomere length and risks of breast and ovarian cancer. Nat. Genet. 45, 371–384 (2013). [DOI] [PMC free article] [PubMed] [Google Scholar]
- 120.Ye, K. et al. Systematic discovery of complex insertions and deletions in human cancers. Nat. Med. 22, 97–104 (2016). [DOI] [PMC free article] [PubMed] [Google Scholar]
Associated Data
This section collects any data citations, data availability statements, or supplementary materials included in this article.
Supplementary Materials
This file contains Supplementary Results, 26 Supplementary Figures, and Supplementary Notes.
This zipped file contains Supplementary Tables 1-24 and a Supplementary Table Guide.
This file contains a full list of the PCAWG consortium.
Data Availability Statement
Somatic and germline variant calls, mutational signatures, subclonal reconstructions, and other core data generated by the ICGC and TCGA PCAWG Consortium are described in an accompanying Article5 and are available for download at https://dcc.icgc.org/releases/PCAWG. Additional information on accessing the data, including raw read files, can be found at https://docs.icgc.org/pcawg/data/. In accordance with the data access policies of the ICGC and TCGA projects, most molecular, clinical and specimen data are in an open tier that does not require access approval. To access potentially identification information, such as germline alleles and underlying sequencing data, researchers will need to apply to the TCGA data access committee via dbGaP (https://dbgap.ncbi.nlm.nih.gov/aa/wga.cgi?page=login) for access to the TCGA portion of the dataset, and to the ICGC data access compliance office (http://icgc.org/daco) for the ICGC portion of the dataset. In addition, to access somatic SNVs derived from TCGA donors, researchers will also need to obtain dbGaP authorization. Data derived specifically from RNA-seq analysis can be found at https://dcc.icgc.org/releases/PCAWG/transcriptome. Subfolders contain identification and quantification of alternative promoter usage, alternative splicing, RNA fusions, gene expression, transcript-level expression and RNA editing. Identified eQTLs are in https://dcc.icgc.org/releases/PCAWG/transcriptome/eQTL and a binarized table indicating all RNA and DNA alterations for each gene can be found in the subfolder https://dcc.icgc.org/releases/PCAWG/transcriptome/recurrence_analyses/. In addition, quality-control metrics and metadata are also included. Some datasets are denoted with synXXXXX accession numbers and available at Synapse (https://www.synapse.org/).
The core computational pipelines used by the PCAWG Consortium for alignment, quality control and variant calling are available to the public at https://dockstore.org/search?search=pcawg under the GNU General Public License v.3.0, which allows for reuse and distribution. Further details on code availability are in the Supplementary Information.


