

Abstract
With the current practice of therapeutic hypothermia for neonatal encephalopathy, disability rates and the severity spectrum of cerebral palsy are reduced. Nevertheless, safe and effective adjunct therapies are needed to optimize outcomes. This study’s objective was to assess if 18 mg/kg melatonin given rapidly over 2 h at 1 h after hypoxia-ischemia with cooling from 1–13 h was safe, achieved therapeutic levels within 3 h and augmented hypothermic neuroprotection. Following hypoxia-ischemia, 20 newborn piglets were randomized to: (i) Cooling 1–13 h (HT; n = 6); (ii) HT+ 2.5% ethanol vehicle (HT+V; n = 7); (iii) HT + Melatonin (HT+M; n = 7). Intensive care was maintained for 48 h; aEEG was acquired throughout, brain MRS acquired at 24 and 48 h and cell death (TUNEL) evaluated at 48 h. There were no differences for insult severity. Core temperature was higher in HT group for first hour after HI. Comparing HT+M to HT, aEEG scores recovered more quickly by 19 h (p < 0.05); comparing HT+V to HT, aEEG recovered from 31 h (p < 0.05). Brain phosphocreatine/inorganic phosphate and NTP/exchangeable phosphate were higher at 48 h in HT+M versus HT (p = 0.036, p = 0.049 respectively). Including both 24 h and 48 h measurements, the rise in Lactate/N-acetyl aspartate was reduced in white (p = 0.030) and grey matter (p = 0.038) after HI. Reduced overall TUNEL positive cells were observed in HT+M (47.1 cells/mm2) compared to HT (123.8 cells/mm2) (p = 0.0003) and HT+V (97.5 cells/mm2) compared to HT (p = 0.012). Localized protection was seen in white matter for HT+M versus HT (p = 0.036) and internal capsule for HT+M compared to HT (p = 0.001) and HT+V versus HT (p = 0.006). Therapeutic melatonin levels (15–30mg/l) were achieved at 2 h and were neuroprotective following HI, but ethanol vehicle was partially protective.
Subject terms: Neuroscience, Physiology
Introduction
Intrapartum-related neonatal encephalopathy (NE) is a major healthcare problem. Worldwide in 2010, NE accounted for 287,000 deaths and 400,000 survivors with impairment1. NE cannot be prevented in most cases and therapies are limited. The incidence of NE in Western Europe is 1–3/1000 term births and in low- and mid-resource settings the incidence is ~10 times higher1,2. Over the last 2 decades, in settings with neonatal intensive care facilities, therapeutic hypothermia (HT) is routinely used for moderate-to-severe NE, improving survival and reducing disability3. However, although the severity of cerebral palsy has reduced with HT4, survivors have significantly lower cognitive scores which are on average 14 IQ points lower than matched peers even in the absence of cerebral palsy at school-age5. Further adjustments to HT protocols do not improve outcome6,7, therefore adjunct therapies to augment HT protection are urgently needed.
Pre-clinical studies suggest that melatonin (N-acetyl-5-methoxytryptamine) in pharmacologic levels is safe and neuroprotective for hypoxic-ischemic injury in the adult8 and neonatal9 brain, mediated by anti-oxidant, anti-apoptotic and anti-inflammatory properties10,11. Extrapolating from in vitro12 and pre-clinical piglet studies13,14 showing melatonin reduces cell death in a concentration-dependent manner, we deduce that a plasma level 15–30 mg/l is required for optimal protection. As melatonin is sparingly soluble, solubility enhancers, such as ethanol, are used. Ethanol could confound previous studies of melatonin protection13,15–19, as low-dose ethanol ~4 h after HI is protective in adult models of stroke20–22. In a previous piglet study, we observed augmentation of HT protection with 30 mg/kg/24 h melatonin with ethanol excipient when started 10 mins after hypoxia-ischemia (HI), reaching blood levels >15 mg/l within 1 h13. In a subsequent study using a proprietary melatonin formulation (15 mg/kg), without ethanol excipient, given 2–8 h after HI, there was less clear protection with therapeutic levels reached only at 8 h14. In this same study, no protection was seen with 5 mg/kg melatonin started at 2 h (blood melatonin <4 mg/l)14. Taken together, these studies suggest melatonin protection is dose-dependent, time critical and influenced by excipient. With the aim to achieve therapeutic levels within 3 h of HI, we subsequently performed pharmacokinetic (PK) modelling, suggesting optimised melatonin dosing would be 18 mg/kg/24 h over 2 h started 1 h after HI14.
We used a piglet model with similar protocols to our neonatal intensive care unit and similar sequences for magnetic resonance spectroscopy (MRS) as NE babies. Our objective was to assess safety, efficacy and PK of an optimized melatonin-dosing regimen based on prior PK-modelling. We hypothesized that 18 mg/kg melatonin started 1 h after HI, infused over 2 h would reach therapeutic levels within 3 h and augment HT. To clarify any influence of ethanol vehicle on neuroprotection, we studied ethanol with and without melatonin. Primary outcome measures were: (i) Cerebral MRS biomarkers (proton (1H) and phosphorus (31P) MRS). Thalamic lactate/N-acetyl aspartate (Lac/NAA) is the most accurate outcome biomarker at 2-years23,24, used in clinical neuroprotection trials25, with clear superiority over other MR methods24. 31P MRS is less accessible on MRI systems but has defined secondary energy failure in NE26 and its relation with 1-year brain growth and outcome27; (ii) aEEG recovery; aEEG is used in NE babies during cooling and recovery predicts outcome28; (iii) Quantitative cell death in 8 brain regions (TUNEL-positive cells) at 48 h.
Materials and Methods
Animal experiments, surgical preparation and randomization
All animal experiments were approved by the UCL Ethics Committee and performed according to UK Home Office Guidelines [Animals (Scientific Procedures) Act, 1986]. The study complies with ARRIVE guidelines. Large White male piglets were anesthetized, surgically prepared and intensive care maintained as described previously29. Criteria for study entry were: (i) normal aEEG/EEG at baseline after surgery; (ii) no pyrexia; (iii) no aEEG recovery within 1 h of HI. The experimental plan is shown in Fig. 1.
Figure 1.

Study time-line. Following baseline data acquisition, piglets underwent cerebral HI. At the end of HI (time t = 0), piglets were randomized to (i) HT (33.5 °C) from 1–13 h with saline bolus at 1–3 and 25–27 h or (ii) HT+vehicle (HT+V; 2.5% ethanol); (iii) HT+melatonin (HT+M;18 mg/kg dissolved in 2.5% ethanol) at 1–3 and 25–27 h. Intensive care support was given for 48 h following HI. aEEG/continuous video EEG was acquired. MRI/MRS was performed at 3 T at 24 and 48 h. The experiment was terminated at 48 h and brain immunohistochemistry analyzed.
Following HI and resuscitation, animals were randomized to (i) Therapeutic hypothermia 1–13 h (HT) (0.9% saline (7.2 ml/kg/h) at 1–3 h and 25–27 h); (ii) HT+Vehicle (HT+V) (2.5% ethanol (7.2 ml/kg/h) at 1–3 h and 25–27 h); (iii) HT+ Melatonin (HT+M) (18 mg/kg (7.2 ml/kg/h) at 1–3 h and 25–27 h). Intensive care support for the animal throughout 48 h and complications were managed in accordance with local neonatal intensive care guidelines.
Transient cerebral hypoxia ischemia
Compared to the original studies based on assessment of NTP reduction during HI on 31P MRS29, the monitoring and titration of the HI insult were modified recently in this and other studies30. Baseline physiological observations and aEEG were monitored prior to HI. Carotid occluders were inflated and fraction of inspired oxygen (FiO2) reduced simultaneously at the start of the insult. FiO2 was decreased to 6% over the first 3 min and titrated to mean blood pressure and EEG. Oxygen delivery was increased in the event of a mean BP <27 mmHg and restricted further if recovery of EEG activity was observed during the insult. Blood gas analysis was performed at 5 min intervals during HI. Total duration of HI was anticipated to be 20–25 min, depending on the duration of isoelectric EEG, hypotension (mean BP <30 and <25 mmhg), total reduction in FiO2 (AUC FiO2) and severity of acidosis on blood gas analysis. At the end of the insult, the animal was resuscitated, occluders deflated and FiO2 increased to air.
Melatonin administration
Melatonin preparation and delivery
Melatonin (Sigma-Aldrich) was dissolved in ethanol and 0.9% NaCl (2.5% v/v vehicle) in the dark shortly before administration. 18 mg/kg melatonin (7.2 ml/kg/h) was infused intravenously over 2 h starting at 1 h after HI and at 25 h after HI. Blood was sampled at baseline and 2, 3, 6, 24, 26, 27, 36, 42, 48 h after time 0 (end of HI).
Magnetic resonance spectroscopy
31P and 1H MRS was performed at 24 and 48 h after HI in a Philips clinical 3 T MRI scanner. 31P metabolites were measured over whole brain (see supplementary file). 1H MRS metabolites were measured in white matter in the right subcortical region (8 × 8 × 15 mm) and deep grey matter (15 × 15 × 10 mm) in the thalamus (Fig. 2). Data was analyzed using jMRUI and Lac/NAA peak area ratio calculated.
Figure 2.

Representative spectra and voxel positions for 1H MRS. Spectroscopy data were collected from voxels located in the dorsal right subcortical white matter at the centrum semiovale level and from two voxels in the deep grey matter centred on both thalami.
Amplitude integrated electroencephalogram (aEEG)
A multichannel EEG and aEEG (Nicolet) was acquired at baseline and continued for 48 h post-insult. The aEEG score was based on pattern classification31; isoelectric (0), continuous low voltage (1), burst suppression (2), discontinuous normal voltage (3) and continuous normal voltage (4).
Immunohistochemistry
At 48 h after HI, piglets were euthanized with pentobarbital and the brain fixed by cardiac perfusion with cold 4% paraformaldehyde, dissected out and post-fixed at 4 °C in 2% paraformaldehyde for 7 days. Coronal slices (5 mm thick) of the right hemisphere, starting from anterior to the optic chiasma, were embedded in paraffin, sectioned to 8 µm thickness and stained with hematoxylin and eosin to validate the bregma for analysis. For each animal, 2 sections (bregma 00 and −2.0) were stained and 8 brain regions were examined: cingulate cortex, sensorimotor cortex, hippocampus, internal capsule, periventricular white matter, caudate, putamen and thalamus. Histological analysis was performed by an investigator blinded to treatment allocation32.
Please see Supplementary file for details on immunohistochemistry methodology and statistical analysis.
Results
One piglet (HT+M) died at 21 h and one piglet (HT) was excluded due to aEEG recovery within 1 h of HI, suggesting mild HI. Twenty piglets were included; HT (n = 6), HT+V (n = 7); HT+M (n = 7).
Physiological data and insult severity
There were no intergroup differences for bodyweight, baseline heart rate, MABP and core temperature (Table 1). The arterial gases at baseline were similar. Considering HI severity, the duration of (i) hypoxia and carotid occlusion, (ii) isoelectric EEG and (iii) MABP <25 and <30 mmHg were similar (Table 1). At the end of HI, blood pH, lactate, base excess and AUC FiO2 reduction below 21% were similar (Table 1).
Table 1.
Physiological parameters for the piglets in each group.
| Parameter | HT LS Mean (SEM) | HT+Vehicle LS Mean (SEM) | HT+Melatonin LS Mean (SEM) | P value |
|---|---|---|---|---|
| Weight (kg) | 2.1 (0.05) | 2.1 (0.04) | 2.0 (0.05) | 0.776 |
| Hypoxic ischemic insult | ||||
| Duration of HI insult (min) | 21.3 (1.1) | 20.0 (1.0) | 23.1 (1.0) | 0.103 |
| Duration of isoelectric EEG during HI (min) | 19 (0.08) | 18.3 (0.8) | 20.9 (0.8) | 0.081 |
| Duration of blood pressure <30 mmHg (min) | 8.7 (1.4) | 10.7 (1.3) | 6.9 (1.3) | 0.150 |
| Duration of blood pressure <25 mmHg (min) | 2.3 (1.2) | 3.2 (1.1) | 0.7 (1.1.) | 0.321 |
| Nadir pH | 7.2 (0.03) | 7.2 (0.03) | 7.2 (0.03) | 0.433 |
| Nadir Lactate (mmol/l) | 14.3 (0.7) | 11.9 (0.7) | 13.3 (0.7) | 0.070 |
| Area under the curve FiO2 | 287.2 (19.6) | 271.6 (18.2) | 322.4 (18.2) | 0.160 |
| Nadir base excess (mmol/l) | −13.2 (2.94) | −9.7 (1.2) | −9.6 (1.2) | 0.103 |
| Heart rate (min−1) | ||||
| Baseline | 179.9 (8.2) | 166.2 (7.6) | 175.4 (7.6) | 0.471 |
| 0–1 h after insult | 200 (10.0) | 197.6 (9.2) | 192.6 (9.2) | 0.857 |
| 1–13 h | 181.8 (6.82) | 171.3 (6.3) | 171.0 (6.3) | 0.445 |
| 13–25 h | 202 (11.5) | 195.6 (10.6) | 181.4 (10.6) | 0.416 |
| 25–48 h | 212.4 (9.4) | 182.1 (7.9) | 187.1 (7.9) | 0.061 |
| Mean arterial blood pressure (mmHg) | ||||
| Baseline | 52 (2.6) | 51.2 (2.4) | 50.2 (2.4) | 0.875 |
| 0–1 h after insult | 53.3 (5.0) | 44.3 (4.6) | 45.4 (4.6) | 0.384 |
| 1–13 h | 46 (1.6) | 42.4 (1.5) | 45.8 (1.5) | 0.191 |
| 13–25 h | 45.8 (2.5) | 42.6 (2.3) | 50.3 (2.3) | 0.091 |
| 25–48 h | 55.0 (2.1) | 49.4 (1.8) | 52.6 (1.8) | 0.152 |
| Rectal temperature (°C) | ||||
| Baseline | 38.1 (0.3) | 38.3 (0.3) | 38.0 (0.3) | 0.777 |
| 0–1 h after insult | 38.9 (0.2) | 38.5 (0.1) | 38.2 (0.1) | 0.020 |
| 1–13 h | 34.0 (0.05) | 34 (0.05) | 33.9 (0.05) | 0.615 |
| 13–25 h | 36.2 (0.1) | 36.5 (0.1) | 36.4 (0.1) | 0.295 |
| 25–48 h | 38.4 (0.09) | 38.5 (0.08) | 38.4 (0.08) | 0.794 |
| PaO2 (kPa) | ||||
| Baseline | 11.1 (1.3) | 9.9 (1.2) | 14.2 (1.2) | 0.067 |
| End of insult (time 0) | 9.3 (1.2) | 6.4 (1.1) | 7.6 (1.1) | 0.241 |
| 12 h after time 0 | 11.5 (1.0) | 11.3 (0.9) | 10.8 (0.9) | 0.879 |
| 24 h after time 0 | 11.5 (1.0) | 11.4 (0.9) | 12.8 (0.9) | 0.469 |
| 48 h after time 0 | 14.1 (0.7) | 12.0 (0.6) | 12.7 (0.6) | 0.119 |
| PaCO2 (kPa) | ||||
| Baseline | 5.6 (0.4) | 6 (0.4) | 5.4 (0.4) | 0.506 |
| End of insult (time 0) | 5.6 (0.4) | 6.1 (0.4) | 6 (0.4) | 0.628 |
| 12 h after time 0 | 4.8 (0.5) | 5.4 (0.5) | 5.6 (0.5) | 0.521 |
| 24 h after time 0 | 7 (0.3) | 5.6 (0.3) | 5.5 (0.3) | 0.003 |
| 48 h after time 0 | 5 (0.3) | 4.5 (0.3) | 5.2 (0.3) | 0.311 |
| Blood pH | ||||
| pH_Baseline | 7.4 (0.03) | 7.4 (0.03) | 7.5 (0.03) | 0.301 |
| End of insult (time 0) | 7.2 (0.04) | 7.2 (0.03) | 7.2 (0.03) | 0.960 |
| 12 h after time 0 | 7.5 (0.04) | 7.5 (0.03) | 7.5 (0.03) | 0.641 |
| 24 h after time 0 | 7.3 (0.03) | 7.4 (0.02) | 7.5 (0.02) | 0.009 |
| 48 h after time 0 | 7.5 (0.02) | 7.5 (0.02) | 7.5 (0.02) | 0.743 |
| Base excess (mmol/l) | ||||
| Baseline | 1.8 (1.7) | 3.3 (1.6) | 5.4 (1.6) | 0.319 |
| End of insult (time 0) | −10.0 (1.7) | −9.7 (1.6) | −9.6 (1.6) | 0.982 |
| 12 h after time 0 | 5.7 (1.5) | 4.7 (1.4) | 5.7 (1.4) | 0.845 |
| 24 h after time 0 | 2.2 (2.6) | −0.4 (2.2) | 5.1 (2.2) | 0.222 |
| 48 h after time 0 | 2.8 (1.3) | 1.9 (1.1) | 3.1 (1.1) | 0.689 |
| Lactate (mmol/l) | ||||
| Baseline | 5.2 (0.7) | 3.8 (0.7) | 4.1 (0.7) | 0.347 |
| End of insult (time 0) | 12.9 (1.0) | 12.3 (0.9) | 13.3 (0.9) | 0.756 |
| 12 h after time 0 | 3.1 (0.6) | 3.9 (0.6) | 3.1 (0.6) | 0.543 |
| 24 h after time 0 | 3.3 (1.5) | 5.3 (1.3) | 2.1 (1.3) | 0.227 |
| 48 h after time 0 | 1.2 (0.3) | 1.7 (0.2) | 1.5 (0.2) | 0.425 |
| Glucose (mmol/l) | ||||
| Baseline | 6.4 (0.5) | 6 (0.5) | 5.6 (0.5) | 0.493 |
| End of insult (time 0) | 9.3 (1.1) | 9.2 (1.0) | 9.7 (1.2) | 0.942 |
| 12 h after time 0 | 15.2 (1.6) | 13.3 (1.5) | 11.3 (1.5) | 0.254 |
| 24 h after time 0 | 17 (3.9) | 13.2 (3.3) | 8.9 (3.3) | 0.307 |
| 48 h after time 0 | 7.2 (1.0) | 6.4 (0.9) | 6 (0.9) | 0.657 |
Time zero = time of resuscitation after HI. Least square mean values (SEM) are presented for the three groups: (i) HT (n = 6), (ii) HT+Vehicle(Ethanol) (n = 7), and (iii) HT+Melatonin (n = 7). An analysis of variance (ANOVA) model was fitted to each group at each time point. No differences were observed between any groups at any time point or ranges following Bonferonni multiplicity correction (p < 0.001). Bold figures represent those measurements that are significantly different between groups.
In the first hour after HI, the mean core temperature was higher in HI versus HI+M (38.9 °C versus 38.2 °C, p = 0.006), although temperatures were within 0.4 °C of normal piglet temperature (38.5 °C). For the remainder of the study, there was no temperature difference. The blood pH was more alkalotic and PaCO2 lower at 24 h after HI in HT+M (p = 0.001) and HT+V (p = 0.003) versus HT.
There was no difference in saline boluses. Inotropic use with Dopamine and Dobutamine was higher in HT and HT+V versus HT+M. Noradrenaline and adrenaline use did not differ (Table 2).
Table 2.
Average total volume replacement and inotrope infusion for the piglets in the HT, HT+V, HT+M groups during the 48 h after HI.
| Infusions | HT | HT+V | HT+M | P value | |||
|---|---|---|---|---|---|---|---|
| Mean (SD) | Mean (SD) | Mean (SD) | |||||
| Dopamine (µg/kg/min) | 15.3 | 4.5 | 16.7 | 3.5 | 8.9 | 4.1 | 0.005 |
| Dobutamine (µg/kg/min) | 2.7 | 5.4 | 7.1 | 6.4 | 0.7 | 1.9 | 0.07 |
| Noradrenaline (ng/kg/min) | 13.0 | 23.2 | 43.5 | 70.3 | 17.9 | 47.4 | 0.53 |
| Adrenaline (ng/kg/min) | 157.0 | 348.5 | 192.4 | 477.9 | 14.2 | 37.6 | 0.60 |
| 10 ml/kg Saline Bolus (n) | 0.2 | 0.4 | 0.4 | 1.1 | 0.1 | 0.4 | 0.73 |
aEEG recovery and seizures
aEEG background activity scores were 4 (normal) in all piglets before HI and 0 during HI. Following HI, the mean hourly aEEG scores were higher in HT+M versus HT+V and HT from 19–24 h (p = 0.037 and p = 0.025 respectively) and 25–30 h (p = 0.022 and p = 0.010) after HI, indicating faster recovery of electrical activity with melatonin-augmented cooling. From 31 h, the vehicle treated group’s brain electrical activity recovered and there was no difference between HT+M and HT+V. aEEG background voltage did not recover in HT and was lower than both HT+V and HT+M, with scores of <1 from 31 h until the study end (Fig. 3).
Figure 3.
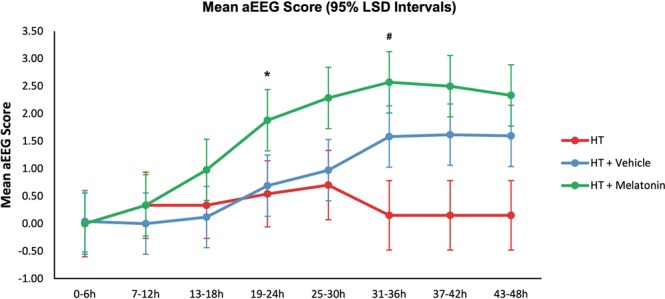
Amplitude-integrated electroencephalogram (aEEG) background activity at baseline, during HI and following HI. The grouped mean hourly aEEG scores per 6 h period with 95% Least Significant Difference (LSD) are shown. Non-overlapping bars show evidence of a significant difference. The mean hourly aEEG scores were significantly higher in the HT+M group versus HT+V and HT from 19–24 h (p = 0.037 and p = 0.025 respectively) and 25–30 h (p = 0.022 and p = 0.010 respectively) after HI, indicating faster recovery of brain electrical activity. From 31 h onwards, the vehicle treated group’s brain electrical activity recovered and there was no difference between the HT+M and HT+V groups. The aEEG background voltage did not recover in the HT group and was significantly lower than both HT+V and HT+M groups, with scores of <1 from 31 h until the end of the study. *Shows when the HT+M group aEEG recovered compared to HT+V and HT groups. #Shows when the HT+V group aEEG recovered compared to the HT group.
One piglet in HT and 3 piglets each in HT+V and HT+M had seizures. All electrographic seizures were treated with 20 mg/kg phenobarbitone; short clinical seizures with no electrographic evidence of seizures were not treated. One animal in HT and HT+M and 3 animals in HT+V received phenobarbitone.
3T MRS
48 h after HI, comparing HT+M to HT, there was higher PCr/Pi (p = 0.036) and NTP/epp (p = 0.049). Comparing HT+M to HT including 24 and 48 h data, Lac/NAA was lower in the white matter (p = 0.30) and grey matter (p = 0.038). There were no differences in MRS comparing HT and HT+V or HT+V and HT+M (Fig. 4).
Figure 4.

1H Magnetic resonance spectroscopy of the brain at 24 and 48 h after HI. Least square mean plots with 95% Least Significant Difference (LSD) bars for the NTP/epp and PCr/Pi in whole-forebrain, and Lac/NAA in thalamus and white matter; non-overlapping bars show evidence of a significant difference. NTP/epp (A) and PCr/Pi (B) means were significantly higher in the HT+M group compared to HT at 48 h (p = 0.049 and 0.036 respectively). Comparing the HT+M group to the HT group including both 24 and 48 h, Lac/NAA was lower in the white matter (p = 0.30) and grey matter (p = 0.038). There were no significant differences in MRS measures comparing HT and HT+V groups and HT+V and HT+M groups. epp = exchangeable phosphate pool; Lac = lactate; NAA = N-acetyl aspartate; Thal = thalamus; WM = white matter; HI = hypoxia ischemia; M = melatonin *p < 0.05.
Immunohistochemistry
TUNEL
TUNEL-positive cells/mm2 for treatment groups are shown in Fig. 5 with group comparison in Table 3. Over all regions, TUNEL-positive cells/mm2 were 123.8 cells/mm2 in HT, 97.5 cells/mm2 in HT+V and 47.1 cells/mm2 in HT+M groups. There were lower TUNEL-positive cells comparing HT+M versus HT+V (p = 0.024) and HT+M versus HT (p = 0.001). For regional differences; there were lower TUNEL-positive cells in the IC in HT+M (12.2 cells/mm2) versus HT (259.6 cells/mm2; p < 0.001). In the same region, there was a partial protective effect with ethanol with lower TUNEL-positive cells in HT+V (98.1 cells/mm2) versus HT (259.6 cells/mm2; p = 0.006). In the pvWM there were less TUNEL-positive cells in HT+M (9.7 cells/mm2) versus HT (133.4cells/mm2; p = 0.036).
Figure 5.
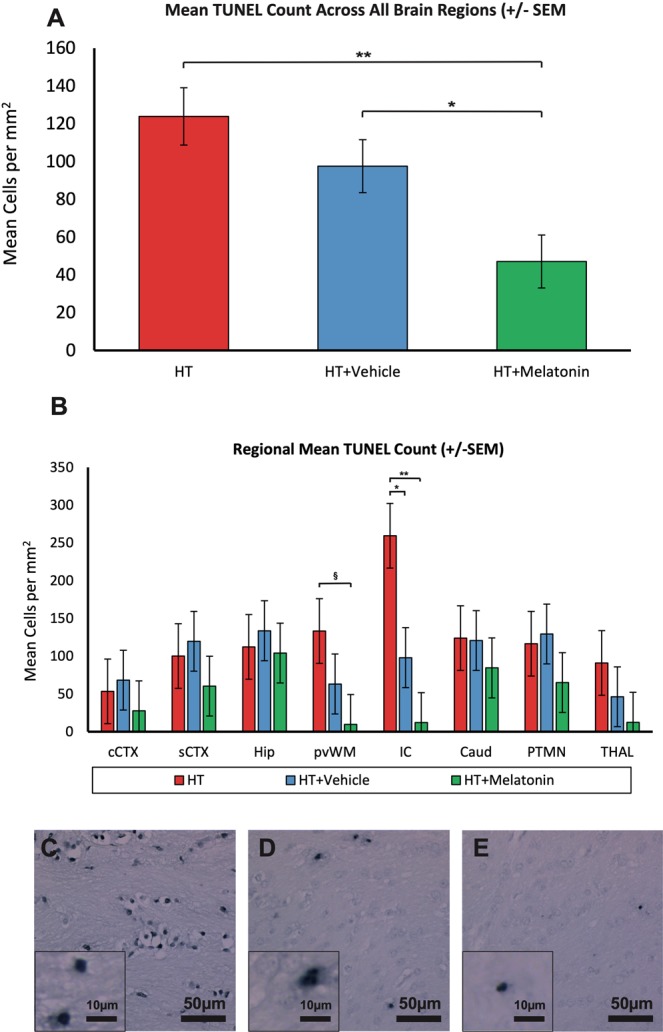
(A) TUNEL immunohistochemistry, all brain regions. Co-treatment of cooling with melatonin decreased overall TUNEL positive cell death at 48 h after HI when compared to cooling and vehicle (p = 0.012) and cooling alone (p = 0.003). *p = 0.012 HT+M versus HT+V. **p = 0.003 HT+M versus HT. (B) TUNEL immunohistochemistry from 8 brain regions. There were less TUNEL-positive cells in the IC in HT+M compared to both HT+V and HT groups. There were fewer TUNEL-positive cells in the pvWM in the HT+M group versus HT alone. **p < 0.001 HT+M versus HT. *p < 0.01 HT+V versus HT. §p > 0.05 HT+M versus HT. Internal capsule = IC; pvWM = periventricular white matter. Error bars represent standard error.
Table 3.
Least Square mean (SEM) TUNEL positive cells (per mm2) in each brain region and overall.
| TUNEL positive cells per mm2 Least square mean (SEM) | |||||
|---|---|---|---|---|---|
| HT | HT+V | HT+M | P values for difference in means | ||
| cCTX | 53.4 (42.8) | 68.3 (39.6) | 27.7 (39.6) | HT v HT+M | p = 0.47 |
| HT v HT+V | p = 0.80 | ||||
| HT+V v HT+M | p = 0.66 | ||||
| sCTX | 100.2 (42.8) | 119.7 (39.6) | 60.4 (39.6) | HT v HT+M | p = 0.50 |
| HT v HT+V | p = 0.74 | ||||
| HT+V v HT+M | p = 0.29 | ||||
| Hip | 112.4 (42.8) | 133.7 (39.6) | 104.3 (39.6) | HT v HT+M | p = 0.89 |
| HT v HT+V | p = 0.72 | ||||
| HT+V v HT+M | p = 0.60 | ||||
| pvWM | 133.4 (42.8) | 63.3 (39.6) | 9.7 (39.6) | HT v HT+M | p = 0.036 |
| HT v HT+V | p = 0.23 | ||||
| HT+V v HT+M | p = 0.34 | ||||
| IC | 259.6 (42.8) | 98.1 (39.6) | 12.2 (39.6) | HT v HT+M | p = 0.001 |
| HT v HT+V | p = 0.006 | ||||
| HT+V v HT+M | p = 0.13 | ||||
| Caudate | 124.1 (42.8) | 120.8 (39.6) | 84.6 (39.6) | HT v HT+M | p = 0.50 |
| HT v HT+V | p = 0.96 | ||||
| HT+V v HT+M | p = 0.52 | ||||
| Putamen | 116.6 (42.8) | 129.4 (39.6) | 65.1 (39.6) | HT v HT+M | p = 0.38 |
| HT v HT+V | p = 0.83 | ||||
| HT+V v HT+M | p = 0.25 | ||||
| Thalamus | 91.0 (42.8) | 46.4 (30.6) | 12.6 (39.6) | HT v HT+M | p = 0.18 |
| HT v HT+V | p = 0.45 | ||||
| HT+V v HT+M | p = 0.55 | ||||
| Overall | 123.8 (15) | 97.5 (14) | 47.1 (14) | HT v HT+M | p = 0.0003 |
| HT v HT+V | p = 0.200 | ||||
| HT+V v HT+M | p = 0.012 | ||||
P values for the difference in means are shown in the right hand column; significant values are shown in bold. SEM = standard error of the mean; cCTX = cingulate cortex; sCTX = sensorimotor cortex; pvWM = periventricular white matter; IC = internal capsule.
Iba1
There was no difference in overall ramification index (higher index suggests less activation) in HT+M versus HT+V or HT (Fig. 6A). On regional analysis the caudate showed increased IBA1 ramification index in HT+V versus HT (Fig. 6E).
Figure 6.

Overall and regional immunohistochemistry for HT, HT+V and HT+M groups for IBA1 ramification index, GFAP luminosity, Cleaved Caspase 3 (CC3) and OLIG2. For IBA1 ramification index, there was no difference in overall ramification index in the HT+M versus HT+V or HT alone (A). On regional analysis the caudate showed an increase in IBA1 ramification index in the HT+V versus HT (E). Representative photomicrographs are shown for HT (I), HT+V (M) and HT+M (Q). There was no difference in overall astrogliosis (GFAP) (B), but localized increases in astrogliosis in the cCTX, IC and caudate as shown (F). Representative GFAP photomicrographs are shown for HT (J), HT+V (M) and HT+M (R). There was an overall increase in CC3 in the HT+M versus HT and HT+M versus HT+V (C). Localized differences with increased CC3 mainly in the HT+M group were compared to both HT+V and HT alone were seen in cCTX, sCTX, pvWM, caudate, putamen, thalamus (G). Representative CC3 photomicrographs are shown for HT (K), HT+V (O) and HT+M (S). There was an overall increase in OLIG2 counts in the HT+M and HT+V compared to HT (D). Localised differences were seen with increased OLIG2 mainly in the IC and pvWM (H). Representative OLIG2 photomicrographs are shown for HT (L), HT+V (P) and HT+M (T). Cingulate cortex = cCTX; Sensorimotor cortex = sCTX; Hippocampus = HIP; Periventricular white matter = PvWM; Internal capsule = IC; Caudate = CAUD; Putamen = PTMN; Thalamus = THAL. Error bars represent standard error ***p < 0.001, **p < 0.01, *p < 0.05.
GFAP
On GFAP luminosity, there was no difference in overall astrogliosis (Fig. 6B), but localized increases in cCTX, IC and caudate (Fig. 6F).
Cleaved caspase 3 (CC3)
There was an overall increase in CC3 in HT+M versus HT and HT+M versus HT+V (Fig. 6C). Localized differences with increased CC3 mainly in HT+M versus HT+V and HT were seen in cCTX, sCTX, pvWM, caudate, putamen, thalamus (Fig. 6G).
OLIG2
The estimated mean OLIG2 cells/mm2 for are shown in Fig. 6D. Over all brain regions, OLIG2 cells/mm2 were 324.8 cells/mm2 in HT, 532.0 cells/mm2 in HT+V and 496.5 cell/mm2 in HT+M. There were higher numbers of OLIG2 cells in HT+V and HT+M versus HT (both p < 0.0001). For regional differences, there were higher OLIG2 counts in internal capsule in HT+V (1204.5 cells/mm2) versus HT (831.2 cells/mm2; p < 0.0001) and HT+M (1204.9 cells/mm2) versus HT (831.2 cells/mm2; p < 0.0001) (Fig. 6H). There were higher OLIG2 counts in the pvWM in HT+V (1451.6 cells/mm2) versus HT (716.3 cells/mm2; p < 0.0001) and HT+M (1316.4 cells/mm2) versus HT (831.2 cells/mm2; p < 0.0001). Excluding IC and pvWM regions (variability was larger than other regions), we observed higher OLIG2 counts in: hippocampus, HT+V (260.9 cells/mm2) versus HT (142.3 cells/mm2; p = 0.041); putamen, HT+V (259.7cells/mm2) versus HT (137.6 cells/mm2; p = 0.036) and thalamus, HT+V (441.1 cells/mm2) versus HT (242.0 cells/mm2; p = 0.001) and HT+M (372.3 cells/mm2) versus HT (242.0 cellsmm2; p = 0.02).
Pharmacokinetics
18 mg/kg melatonin infusion over 2 h starting at 1 h after HI led to plasma target therapeutic levels of melatonin at 2 h after HI. The peak melatonin level in the first 24 h was at 3 h after HI (18.84 µg/ml) and in the 2nd 24 h at 27 h after HI (21.84 µg/ml). Individual subject profiles are in Fig. 7A and mean group plasma levels with 95% CI are in Fig. 7B.
Figure 7.
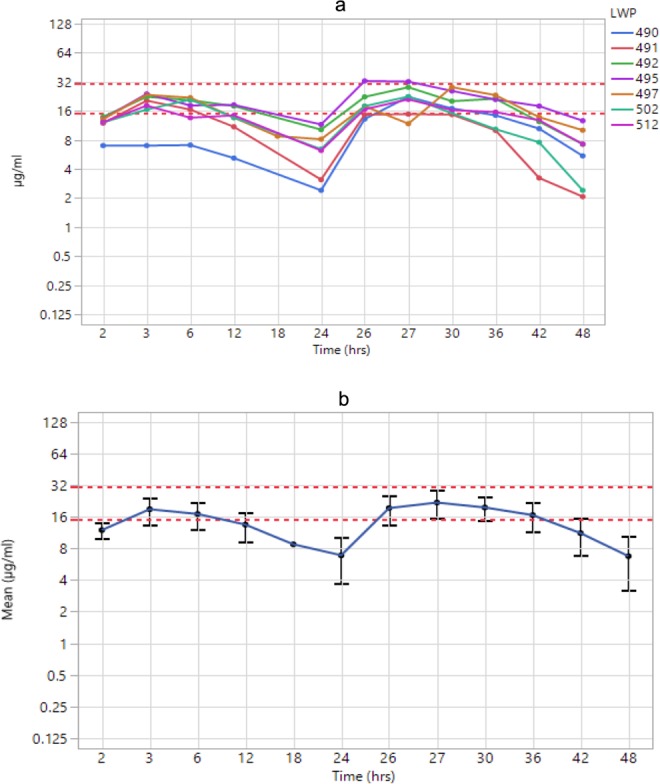
Melatonin plasma levels for individual piglets (A) and Mean (95% CI) Melatonin levels for the HT+M group (B). Melatonin reached the target therapeutic range at 2 h and 26 h after HI (1 h after each infusion started) and remained within this range for up to 18 h.
Discussion
Compared to therapeutic hypothermia alone, we observed improved cerebral protection with the addition of 18 mg/kg melatonin given intravenously at 1 h and 25 h after HI, based on aEEG recovery from 19 h, improved cerebral energy metabolism at 48 h on 31P and 1H MRS and reduced TUNEL-positive cells (estimated mean 47.1 cells/mm2 in HT+M versus 123.8 cells/mm2 in HT). An important finding was that in HT+V, ethanol, used to improve melatonin solubility, was associated with partial protection, based on aEEG recovery from 31 h and reduced TUNEL- positive cells (97.5 cell/mm2, midway between HT and HT+M). Increased oligodendrocytes were seen in both HT+V and HT+M versus HT, suggesting ethanol drove oligodendrocyte protection. Melatonin levels reached the putative therapeutic range (15–30 mg/l) at 2 h and 26 h after HI and remained within range 12–18 h after each infusion.
Melatonin was safe and did not lead to any physiological change at this high dose with a rapid infusion rate. Indeed, more dopamine and dobutamine were required to maintain the mean blood pressure in HT and HT+V versus HT+M, but there was no difference in fluid bolus requirements. Our previous piglet studies did not observe any effect of melatonin on blood pressure at doses up to 30 mg/kg13,14. Melatonin therapeutic levels (15–30 mg/l) were reached at 2 h using this rapid infusion started 1 h after HI. It is feasible that in babies with NE, resuscitation would be completed and venous access in place by 1 h, enabling the start of melatonin infusion. Oral melatonin has been used in NE babies undergoing HT and is absorbed33,34, however for rapid achievement of therapeutic levels and optimal protection, intravenous administration is more reliable. In the piglet model we have observed that brain protection is dependent on the time after HI that therapeutic levels are achieved14. This fits with melatonin’s diverse anti-oxidative effects which act upstream in the neurotoxic cascade to prevent free radical-induced oxidative damage to the electron transport chain and mitochondrial DNA35. The newborn infant is at heightened risk for free radical production and injury from oxidative stress. Melatonin and its metabolites work as free radical scavengers, by enhancing anti-oxidant enzyme expression and activity36. Further downstream, melatonin maintains mitochondrial energy production by increasing complex I and IV electron transport chain activity37. Melatonin subsequently prevents apoptosis by preventing nitro-oxidative damage to membrane lipids and inhibiting pro-apoptotic proteins such as BAX; these actions prevent cytochrome c leakage and propagation of intrinsic apoptotic cascades.
aEEG is used to monitor babies undergoing HT and the aEEG background voltage and rate of recovery after HI predict outcome28,38. In our study, mean aEEG scores recovered more quickly in HT+M versus HT from 19 h, but surprisingly, we saw improvement in HT+V versus HT from 30 h, corresponding to partial protection also seen with TUNEL-positive cells with HT+V.
MRS biomarkers predict 2-year neurodevelopmental outcome in NE infants23,24. Higher NTP and PCr on 31P MRS is associated with better 2-year outcome in clinical studies26; we saw higher ATP and PCr in HT+M versus HT at 48 h. 1H MRS Lac/NAA is a validated translational biomarker; high levels of thalamic Lac/NAA on MRS in NE babies predict poor 2-year outcomes23,24. We saw lower Lac/NAA on WM MRS with HT+M at 24 and 48 h and in grey matter at 48 h versus HT.
We saw an overall reduced number of TUNEL-positive cells in HT+M versus HT+V and HT. On regional assessment, most protection was observed in IC and pvWM. The high level of protection in these regions may relate to their increased vulnerability to free radical attack, localised severe injury and the early achievement of therapeutic melatonin levels. Although excitotoxic mediated injury may affect all neuronal cells, the myelin-producing oligodendrocytes are particularly vulnerable to injury. We observed that ethanol is likely to have particularly driven the oligodendrocyte protection in IC and pvWM. Other regions with lower levels of injury, such as the hippocampus, putamen and thalamus, also showed preserved oligodendrocytes with ethanol vehicle, but the effect was smaller. Here we did not measure changes in immature or mature oligodendrocytes or myelination. As melatonin is highly lipophyllic and easily penetrates brain and organelles, protection is unlikely to be due to vascular factors39. Protection of IC and pvWM with melatonin-augmented cooling as seen here would lead to improvements in cognitive and language outcomes with preservation of brain growth.
Compared to our recent study where therapeutic levels were achieved at 8 h after HI14, earlier administration of melatonin and therapeutic levels by 2 h in this current study provided enhanced protection. Here, pvWM and IC protection were similar to that achieved with melatonin administered at 10 mins after HI previously where we also saw protection in grey matter regions13. Such widespread protection may have been related to the overall more severe injury, expanding the potential for brain protection with melatonin-augmented cooling. Taken together, it is likely melatonin-augmented cooling would be effective in severe injuries and protect both white and grey matter.
There was clear partial protection seen with HT+V (ethanol) whereby mean TUNEL-positive cells/mm2 (97.5) were midway between HT (123.8) and HT+M (47.1). There was preservation of oligodendrocytes with HT+V mainly in IC and pvWM and ethanol is likely to have driven protection seen with HT+M in these regions. Ethanol vehicle protection was maximal in IC where injury was most severe. Ethanol has been used as a vehicle for several melatonin neuroprotection pre-clinical and clinical studies, including the piglet13, fetal sheep15,18,19 and human baby16. Ethanol modulates GABA and increases GABAergic neurotransmission40, this being inhibitory in adults but excitatory in immature brain41. Neuroprotection with acute low-dose ethanol given up to 4 h after middle cerebral artery occlusion is described in adult stroke studies with 1.0–1.5 g/kg ethanol producing blood levels of 80–100 g/dl22. In adolescent but not adult rats, high ethanol doses to model binge drinking, upregulated Toll like receptor signalling (TLRS) and increased proinflammatory cytokines42, supporting the concept that the immature brain is more vulnerable to ethanol’s toxic effects. This increased vulnerability of the developing brain to ethanol, related to inhibition of cortical activity43, mandates ethanol-free medicines for newborn infants44.
Therefore, it is likely that ethanol influenced protection in one13 but not another14 previous piglet study and in fetal sheep neuroprotection studies15,17–19,45. Only one fetal sheep study15 had an ethanol-only control group where ethanol exposure was associated with improved neuronal survival in striatum but reduced survival in hippocampus. In this study, ethanol was associated with suppression of cell proliferation and increased microglial activation, suggesting it is imperative to study melatonin with safe excipients in future studies.
We saw no effect of HT+M versus HT on brain microglial activation13,14. It is possible that, despite no visible change, gene expression was altered13. There was no effect of HT+M on GFAP. There were clear increases in CC3 in HT+M versus HT+V and HT. Such CC3 increases were evident throughout the brain; this may reflect caspase’s non-apoptotic functions, promoting microglial and lymphocyte function, cell differentiation and autophagy46–48. Increased CC3 expression, not linked the cell death, has been observed in the contralateral hemisphere in a unilateral hypoperfusion P7-rat model49. We have previously observed discrepancies between TUNEL-positive cell death and CC3 in our piglet model32. The use of male piglets may partly explain these data; cell death is dimorphic, and in males, apoptosis occurs via caspase-independent pathways50,51. It is likely that the observed TUNEL-positive cell death occurred independently of caspase 347, such as necrosis, necroptosis, and non-caspase mediated apoptosis52. CC3 is therefore a poor cell death/apoptotic marker in this male piglet model.
There are limitations to this study. The inclusion of male piglets only was to minimize variability; inclusion of both sexes is necessary for future development of the model. Termination at 48 h, may not have allowed sufficient time for evolution of apoptotic cell death. Importantly, the rectal temperature was higher in HI versus HI+M (38.9 °C versus 38.2 °C). This is a potential confounder; cooling trials have shown that death/disability is increased 3.6–4.0 fold for each 1 °C increase in temperature in controls53. Duration of temperature rise influences outcome; the difference in our study was only 1 h; over the next 48 h, there was no difference. Nevertheless, temperature rise after HI, exacerbates injury54,55; and this could have worsened brain injury in HT. The blood pH was more alkalotic and PaCO2 lower at 24 h after HI in HT+M and HT+V versus HT. High variability in CO2, in particular hypocapnia56,57, is associated with NE adverse outcome and this could exacerbate HT+M brain injury. The contribution of phenobarbitone to brain injury is unclear58,59.
In the search for safe and effective therapies to improve outcomes in NE babies, it will be important to tailor therapies based on sex, inflammatory state and injury severity60. Melatonin may be an intervention which targets severe injury if started early enough. With its potent anti-oxidative effects at high dose, low side effect profile and lack of cold-chain storage requirement, melatonin has potential to improve NE outcomes. Phase I safety studies and careful incremental dose studies are needed prior to RCTs. There is a growing interest in the combination of agents with different neuroprotection profiles; melatonin with erythropoietin in preterm brain injury shows promise61.
In conclusion, 18 mg/kg melatonin 1 h after HI, combined with cooling, reduced brain injury based on faster aEEG recovery 19 h after HI, improved brain energy metabolism on 31P and 1H MRS over 48 h and reduced TUNEL positive cells with particular protection in most severely damaged regions, IC and pvWM. The vehicle, ethanol, used to improve melatonin solubility, led to partial protection based on aEEG recovery 31 h after HI, reduced TUNEL positive cells and increased oligodendrocytes in IC and pvWM versus HT. Melatonin is a promising and safe neuroprotective agent which augments HT if target therapeutic levels are achieved ~2 h after HI. It is imperative to study melatonin with ethanol-free excipients in future pre-clinical and clinical neuroprotection studies.
Supplementary information
Acknowledgements
This project was supported by the Medical Research Council (MR/M006743/1) and the National Institute for Health Research, University College London Hospitals Biomedical Research Centre.
Author contributions
N.J.R. wrote the grant for funding of the project, N.J.R., X.G., P.G., B.F., B.K. contributed to the concept and design, L.S., C.M., K.M., I.L., A.A.-B., M.H., A.B., M.S., D.P., M.T. acquired the data, N.J.R. and C.M. analyzed and interpreted the data, N.J.R. and L.S. wrote the first draft of the manuscript, all authors have critically reviewed and approved the article.
Competing interests
The authors declare no competing interests.
Footnotes
Publisher’s note Springer Nature remains neutral with regard to jurisdictional claims in published maps and institutional affiliations.
Supplementary information
is available for this paper at 10.1038/s41598-020-60858-x.
References
- 1.Lee A, et al. Intrapartum-related neonatal encephalopathy incidence and impairment at regional and global levels for 2010 with trends from 1990. Pediatr. Res. 2013;74(Suppl 1):50–72. doi: 10.1038/pr.2013.206. [DOI] [PMC free article] [PubMed] [Google Scholar]
- 2.Kurinczuk J, White-Koning M, Badawi N. Epidemiology of neonatal encephalopathy and hypoxic-ischaemic encephalopathy. Early Hum. Dev. 2010;86(6):329–338. doi: 10.1016/j.earlhumdev.2010.05.010. [DOI] [PubMed] [Google Scholar]
- 3.Jacobs S, et al. Cooling for newborns with hypoxic ischaemic encephalopathy. Cochrane Database Sys. Rev. 2013;1:CD003311. doi: 10.1002/14651858.CD003311.pub3. [DOI] [PMC free article] [PubMed] [Google Scholar]
- 4.Jary S, et al. Motor performance and cognitive correlates in children cooled for neonatal encephalopathy without cerebral palsy at school age. Acta Paediatr. 2019;108(10):1773–1780. doi: 10.1111/apa.14780. [DOI] [PubMed] [Google Scholar]
- 5.Lee-Kelland R, et al. School-age outcomes of children without cerebral palsy cooled for neonatal hypoxic-ischaemic encephalopathy in 2008–2010. Arch. Dis. Child. Fetal Neonatal Ed. 2020;105(1):8–13. doi: 10.1136/archdischild-2018-316509. [DOI] [PubMed] [Google Scholar]
- 6.Shankaran S, et al. Effect of depth and duration of cooling on deaths in the NICU among neonates with hypoxic ischemic encephalopathy: a randomized clinical trial. JAMA. 2014;312(24):2629–2639. doi: 10.1001/jama.2014.16058. [DOI] [PMC free article] [PubMed] [Google Scholar]
- 7.Shankaran S, et al. Effect of Depth and Duration of Cooling on Death or Disability at Age 18 Months Among Neonates With Hypoxic-Ischemic Encephalopathy: A Randomized Clinical Trial. JAMA. 2017;318(1):57–67. doi: 10.1001/jama.2017.7218. [DOI] [PMC free article] [PubMed] [Google Scholar]
- 8.Macleod M, O’Collins T, Horky L, Howells D, Donnan G. Systematic review and meta-analysis of the efficacy of melatonin in experimental stroke. J. Pineal Res. 2005;38(1):35–41. doi: 10.1111/j.1600-079X.2004.00172.x. [DOI] [PubMed] [Google Scholar]
- 9.Husson I, et al. Melatoninergic neuroprotection of the murine periventricular white matter against neonatal excitotoxic challenge. Ann. Neurol. 2002;51(1):82–92. doi: 10.1002/ana.10072. [DOI] [PubMed] [Google Scholar]
- 10.Kilic U, Kilic E, Reiter R, Bassetti C, Hermann D. Signal transduction pathways involved in melatonin-induced neuroprotection after focal cerebral ischemia in mice. J. Pineal Res. 2005;38(1):67–71. doi: 10.1111/j.1600-079X.2004.00178.x. [DOI] [PubMed] [Google Scholar]
- 11.Luchetti F, et al. Melatonin signaling and cell protection function. FASAB J. 2010;24(10):3603–3624. doi: 10.1096/fj.10-154450. [DOI] [PubMed] [Google Scholar]
- 12.Carloni, S., Fachinetti, F., Pelizzi, N., Buonocore, G. & Balduini, W. Melatonin acts in synergy with hypothermia to reduce oxygen-glucose deprivation (OGD) in rat hippocampus organotypic slice cultures. Neonatology. 2018;in press. [DOI] [PubMed]
- 13.Robertson N, et al. Melatonin Augments Hypothermic Neuroprotection in a Perinatal Asphyxia Piglet Model. Brain. 2013;136(Pt 1):90–105. doi: 10.1093/brain/aws285. [DOI] [PubMed] [Google Scholar]
- 14.Robertson N, et al. Melatonin as an adjunct to therapeutic hypothermia in a piglet model of neonatal encephalopathy: A translational study. Neurobiol. Dis. 2019;121:240–251. doi: 10.1016/j.nbd.2018.10.004. [DOI] [PubMed] [Google Scholar]
- 15.Drury P, et al. Partial neural protection with prophylactic low-dose melatonin after asphyxia in preterm fetal sheep. J. Cereb. Blood Flow. Metab. 2014;34(1):126–135. doi: 10.1038/jcbfm.2013.174. [DOI] [PMC free article] [PubMed] [Google Scholar]
- 16.Fulia F, et al. Increased levels of malondialdehyde and nitrite/nitrate in the blood of asphyxiated newborns: reduction by melatonin. J. Pineal Res. 2005;31(4):343–349. doi: 10.1034/j.1600-079X.2001.310409.x. [DOI] [PubMed] [Google Scholar]
- 17.Welin A, et al. Melatonin reduces inflammation and cell death in white matter in the mid-gestation fetal sheep following umbilical cord occlusion. Pediatr. Res. 2007;61(2):153–158. doi: 10.1203/01.pdr.0000252546.20451.1a. [DOI] [PubMed] [Google Scholar]
- 18.Yawno T, et al. The Beneficial Effects of Melatonin Administration Following Hypoxia-Ischemia in Preterm Fetal Sheep. Front. Cell Neurosci. 2017;11:296. doi: 10.3389/fncel.2017.00296. [DOI] [PMC free article] [PubMed] [Google Scholar]
- 19.Aridas James D. S., Yawno Tamara, Sutherland Amy E., Nitsos Ilias, Ditchfield Michael, Wong Flora Y., Hunt Rod W., Fahey Michael C., Malhotra Atul, Wallace Euan M., Jenkin Graham, Miller Suzanne L. Systemic and transdermal melatonin administration prevents neuropathology in response to perinatal asphyxia in newborn lambs. Journal of Pineal Research. 2018;64(4):e12479. doi: 10.1111/jpi.12479. [DOI] [PMC free article] [PubMed] [Google Scholar]
- 20.Su F, et al. Low-Dose Ethanol Preconditioning Protects Against Oxygen-Glucose Deprivation/Reoxygenation-Induced Neuronal Injury By Activating Large Conductance, Ca2+−Activated K+ Channels In Vitro. Neurosci. Bulletin. 2017;33(1):28–40. doi: 10.1007/s12264-016-0080-3. [DOI] [PMC free article] [PubMed] [Google Scholar]
- 21.Aronowski J, Strong R, Shirzadi A, Grotta J. Ethanol plus caffeine (caffeinol) for treatment of ischemic stroke: preclinical experience. Stroke. 2003;34(5):1246–1251. doi: 10.1161/01.STR.0000068170.80517.B3. [DOI] [PubMed] [Google Scholar]
- 22.Wang F, et al. Neuroprotective effect of acute ethanol administration in a rat with transient cerebral ischemia. Stroke. 2012;43(1):205–210. doi: 10.1161/STROKEAHA.111.629576. [DOI] [PubMed] [Google Scholar]
- 23.Mitra S, et al. Proton magnetic resonance spectroscopy lactate/N-acetylaspartate within 2 weeks of birth accurately predicts 2-year motor, cognitive and language outcomes in neonatal encephalopathy after therapeutic hypothermia. Arch. Dis. Child. Fetal Neonatal. 2018 doi: 10.1136/archdischild-2018-315478). [DOI] [PubMed] [Google Scholar]
- 24.Lally, P. et al. Magnetic resonance spectroscopy assessment of brain injury after moderate hypothermia in neonatal encephalopathy: a prospective multicentre cohort study. Lancet Neurol. 2018;pii: S1474-4422(18)30325-9. [DOI] [PMC free article] [PubMed]
- 25.Azzopardi D, et al. Moderate hypothermia within 6 h of birth plus inhaled xenon versus moderate hypothermia alone after birth asphyxia (TOBY-Xe): a proof-of-concept, open-label, randomised controlled trial. Lancet Neurol. 2015;S1474-4422(15):00347–6. doi: 10.1016/S1474-4422(15)00347-6. [DOI] [PMC free article] [PubMed] [Google Scholar]
- 26.Azzopardi D, et al. Prognosis of newborn infants with hypoxic-ischemic brain injury assessed by phosphorus magnetic resonance spectroscopy. Pediatr. Res. 1989;25(5):445–451. doi: 10.1203/00006450-198905000-00004. [DOI] [PubMed] [Google Scholar]
- 27.Roth S, et al. Relation between cerebral oxidative metabolism following birth asphyxia, and neurodevelopmental outcome and brain growth at one year. Dev. Med. Child. Neurol. 1992;34(4):285–295. doi: 10.1111/j.1469-8749.1992.tb11432.x. [DOI] [PubMed] [Google Scholar]
- 28.Thoresen M, Hellström-Westas L, Liu X, de Vries L. Effect of hypothermia on amplitude-integrated electroencephalogram in infants with asphyxia. Pediatrics. 2010;126(1):e131–139. doi: 10.1542/peds.2009-2938. [DOI] [PubMed] [Google Scholar]
- 29.Lorek A, et al. Delayed (“secondary”) cerebral energy failure after acute hypoxia-ischemia in the newborn piglet: continuous 48-hour studies by phosphorus magnetic resonance spectroscopy. Pediatr. Res. 1994;36:699–706. doi: 10.1203/00006450-199412000-00003. [DOI] [PubMed] [Google Scholar]
- 30.Lingam I, et al. Short-term effects of early initiation of magnesium infusion combined with cooling after hypoxia-ischemia in term piglets. Pediatr. Res. 2019;86(6):699–708. doi: 10.1038/s41390-019-0511-8. [DOI] [PubMed] [Google Scholar]
- 31.de Vries L, Hellström-Westas L. Role of cerebral function monitoring in the newborn. Arch. Dis. Child. Fetal Neonatal Ed. 2005;90(3):F201–207. doi: 10.1136/adc.2004.062745. [DOI] [PMC free article] [PubMed] [Google Scholar]
- 32.Martinello K, et al. Acute LPS sensitization and continuous infusion exacerbates hypoxic brain injury in a piglet model of neonatal encephalopathy. Sci. Rep. 2019;15(91):10184. doi: 10.1038/s41598-019-46488-y. [DOI] [PMC free article] [PubMed] [Google Scholar]
- 33.Aly H, et al. Melatonin use for neuroprotection in perinatal asphyxia: a randomized controlled pilot study. J. Perinatol. 2015;35(3):186–191. doi: 10.1038/jp.2014.186. [DOI] [PubMed] [Google Scholar]
- 34.Balduini W, et al. Melatonin pharmacokinetics and dose extrapolation after enteral infusion in neonates subjected to hypothermia. J. Pineal Res. 2019;66(4):e12565. doi: 10.1111/jpi.12565. [DOI] [PubMed] [Google Scholar]
- 35.Reiter R, et al. Melatonin as an antioxidant: under promises but over delivers. J. Pineal Res. 2016;61(3):253–278. doi: 10.1111/jpi.12360. [DOI] [PubMed] [Google Scholar]
- 36.Galano A, Tan D, Reiter R. On the free radical scavenging activities of melatonin’s metabolites, AFMK and AMK. J. Pineal Res. 2013;54(3):245–257. doi: 10.1111/jpi.12010. [DOI] [PubMed] [Google Scholar]
- 37.Leon J, et al. Melatonin and mitochondrial function. Life Sci. 2004;75(7):765–790. doi: 10.1016/j.lfs.2004.03.003. [DOI] [PubMed] [Google Scholar]
- 38.Csekő A, et al. Accuracy of amplitude-integrated electroencephalography in the prediction of neurodevelopmental outcome in asphyxiated infants receiving hypothermia treatment. Acta Paediatr. 2013;102(7):707–711. doi: 10.1111/apa.12226. [DOI] [PubMed] [Google Scholar]
- 39.Paradies G, Petrosillo G, Paradies V, Reiter R. Ruggiero F. Melatonin, cardiolipin and mitochondrial bioenergetics in health and disease. J. Pineal Res. 2010;48(4):297–310. doi: 10.1111/j.1600-079X.2010.00759.x. [DOI] [PubMed] [Google Scholar]
- 40.Kelm M, Criswell H, Breese G. Ethanol-enhanced GABA release: a focus on G protein-coupled receptors. Brain Res. Rev. 2011;65(2):113–123. doi: 10.1016/j.brainresrev.2010.09.003. [DOI] [PMC free article] [PubMed] [Google Scholar]
- 41.Ben-Ari Y, Khalilov I, Kahle K, Cherubini E. The GABA excitatory/inhibitory shift in brain maturation and neurological disorders. Neuroscientist. 2012;18(5):467–486. doi: 10.1177/1073858412438697. [DOI] [PubMed] [Google Scholar]
- 42.Pascual M, Pla A, Miñarro J, Guerri C. Neuroimmune activation and myelin changes in adolescent rats exposed to high-dose alcohol and associated cognitive dysfunction: a review with reference to human adolescent drinking. Alcohol. Alcohol. 2014;49(2):187–192. doi: 10.1093/alcalc/agt164. [DOI] [PubMed] [Google Scholar]
- 43.Lotfullina N, Khazipov R. Ethanol and the Developing Brain: Inhibition of Neuronal Activity and Neuroapoptosis. Neuroscientist. 2018;24(2):130–141. doi: 10.1177/1073858417712667. [DOI] [PubMed] [Google Scholar]
- 44.Whittaker A, et al. Toxic additives in medication for preterm infants. Arch. Dis. Child. Fetal Neonatal Ed. 2009;94(4):F236–240. doi: 10.1136/adc.2008.146035. [DOI] [PubMed] [Google Scholar]
- 45.Miller S, Yan E, Castillo-Meléndez M, Jenkin G, Walker D. Melatonin provides neuroprotection in the late-gestation fetal sheep brain in response to umbilical cord occlusion. Dev. Neurosci. 2005;27(2-4):200–210. doi: 10.1159/000085993. [DOI] [PubMed] [Google Scholar]
- 46.Abraham M, Shaham S. Death without caspases, caspases without death. Trends Cell Biol. 2004;14(4):184–193. doi: 10.1016/j.tcb.2004.03.002. [DOI] [PubMed] [Google Scholar]
- 47.Northington F, Chavez-Valdez R, Martin L. Neuronal cell death in neonatal hypoxia-ischemia. Ann. Neurol. 2011;69(5):743–758. doi: 10.1002/ana.22419. [DOI] [PMC free article] [PubMed] [Google Scholar]
- 48.McComb S, Mulligan R, Sad S. Caspase-3 is transiently activated without cell death during early antigen driven expansion of CD8(+) T cells in vivo. PLoS One. 2010;22(5):e15328. doi: 10.1371/journal.pone.0015328. [DOI] [PMC free article] [PubMed] [Google Scholar]
- 49.Villapol S, et al. Unilateral blood flow decrease induces bilateral and symmetric responses in the immature brain. Am. J. Pathol. 2009;175(5):2111–2120. doi: 10.2353/ajpath.2009.090257. [DOI] [PMC free article] [PubMed] [Google Scholar]
- 50.Zhu C, et al. Different apoptotic mechanisms are activated in male and female brains after neonatal hypoxia-ischaemia. J. Neurochem. 2006;96(4):1016–1027. doi: 10.1111/j.1471-4159.2005.03639.x. [DOI] [PubMed] [Google Scholar]
- 51.Charriaut-Marlangue C, et al. Sex differences in the effects of PARP inhibition on microglial phenotypes following neonatal stroke. Brain Behav. Immun. 2018;73:375–389. doi: 10.1016/j.bbi.2018.05.022. [DOI] [PubMed] [Google Scholar]
- 52.Zhu C, et al. Involvement of apoptosis-inducing factor in neuronal death after hypoxia-ischemia in the neonatal rat brain. J. Neurochem. 2003;86(2):306–317. doi: 10.1046/j.1471-4159.2003.01832.x. [DOI] [PubMed] [Google Scholar]
- 53.Laptook A, et al. Elevated temperature after hypoxic-ischemic encephalopathy: risk factor for adverse outcomes. Pediatrics. 2008;122(3):491–499. doi: 10.1542/peds.2007-1673. [DOI] [PMC free article] [PubMed] [Google Scholar]
- 54.Yager J, Armstrong E, Jaharus C, Saucier D, Wirrell E. Preventing hyperthermia decreases brain damage following neonatal hypoxic-ischemic seizures. Brain Res. 2004;1011(1):48–57. doi: 10.1016/j.brainres.2004.02.070. [DOI] [PubMed] [Google Scholar]
- 55.Mishima K, et al. Effects of hypothermia and hyperthermia on attentional and spatial learning deficits following neonatal hypoxia-ischemic insult in rats. Behav. Brain Res. 2004;15(1-2):209–217. doi: 10.1016/j.bbr.2003.08.018. [DOI] [PubMed] [Google Scholar]
- 56.Lopez Laporte M, et al. Association between hypocapnia and ventilation during the first days of life and brain injury in asphyxiated newborns treated with hypothermia. J. Matern. Fetal Neonatal Med. 2019;32(8):1312–1320. doi: 10.1080/14767058.2017.1404980. [DOI] [PubMed] [Google Scholar]
- 57.Lingappan K, Kaiser J, Srinivasan C, Gunn A. Relationship between PCO2 and unfavorable outcome in infants with moderate-to-severe hypoxic ischemic encephalopathy. Pediatr. Res. 2016;80(2):204–208. doi: 10.1038/pr.2016.62. [DOI] [PubMed] [Google Scholar]
- 58.Torolira D, Suchomelova L, Wasterlain C, Niquet J. Phenobarbital and midazolam increase neonatal seizure-associated neuronal injury. Ann. Neurol. 2017;82(1):115–120. doi: 10.1002/ana.24967. [DOI] [PMC free article] [PubMed] [Google Scholar]
- 59.Krishna S, Hutton A, Aronowitz E, Moore H, Vannucci S. The effects of adding prophylactic phenobarbital to therapeutic hypothermia in the term-equivalent hypoxic-ischemic rat. Pediatr. Res. 2018;83(2):506–513. doi: 10.1038/pr.2017.266. [DOI] [PubMed] [Google Scholar]
- 60.Hassell J, EzzatI M, Alonso-Alconada D, Hausenloy D, Robertson N. New Horizons for Newborn Brain Protection:enhancing endogenous neuroprotection. Arch. Dis. Child. Fetal Neonatal Ed. 2015;100(6):F541–552. doi: 10.1136/archdischild-2014-306284. [DOI] [PMC free article] [PubMed] [Google Scholar]
- 61.Robinson S, et al. Extended Combined Neonatal Treatment With Erythropoietin Plus Melatonin Prevents Posthemorrhagic Hydrocephalus of Prematurity in Rats. Front. Cell Neurosci. 2018;12:322. doi: 10.3389/fncel.2018.00322. [DOI] [PMC free article] [PubMed] [Google Scholar]
Associated Data
This section collects any data citations, data availability statements, or supplementary materials included in this article.