Abstract
Lactococcus petauri CF11 was originally isolated from the gut of healthy humans. To determine the underlying molecular and genetic mechanisms of the probiotic potential of CF11, we performed complete genome sequencing, annotation, and comparative genome analysis. The complete genome of L. petauri CF11 comprised of 1,997,720 bp, with a DNA G+C content of 38.21 mol% containing 1982 protein coding genes and 16 rRNA operons. We found that 1206 genes (56.05%) were assigned a putative function using the gene ontology (GO) resource. The gene products of CF11 were primarily concentrated in molecular function and biological processes, such as catalysis, binding, metabolism, and cellular processes. Furthermore, 1,365 (68.87%) genes were assigned an illative function using COGs. CF11 proteins were associated with carbohydrate transport and metabolism, and amino acid transport and metabolism. This indicates that CF11 bacteria can perform active energy exchange. We classified 1,111 (56.05%) genes into six KEGG functional categories; fructose-bisphosphate aldolase and the phosphoenol pyruvate:phosphotransferase system (PTS), which are necessary in producing short-chain fatty acids (SCFAs), were excited in the carbohydrate metabolic pathway. This suggests that L. petauri CF11 produces SCFAs via glycolysis. The genomic island revealed that some regions contain fragments of antibiotic resistance and bacteriostatic genes. In addition, ANI analysis showed that L. petauri CF11 had the closest relationship with L. petauri 159469T, with an average nucleotide consistency of 98.03%. Taken together, the present study offers further insights into the functional and potential role of L. petauri CF11 in health care.
Keywords: Lactococcus petauri, complete genome, insight, second-generation sequence, third-generation sequence
Introduction
The intestinal tract is the largest microecosystem in the human body. It contains a significant number of intestinal microbes, which are known as the intestinal flora. The ecological community of commensal, symbiotic, and pathogenic microorganisms share space in the human gut. Intestinal flora plays an important role in human health and disease prevention because they provide nutrition and energy to the host by producing short chain fatty acids (SCFAs), vitamins, and amino acids (Nicholson et al., 2012). Intestinal flora is closely related to many physiological functions, such as immunity and metabolism, which play a significant role in host health (Lynch and Pedersen, 2016; Thaiss et al., 2016).
The genus Lactococcus is a genus of lactic acid bacteria, which are members of the family Streptococcaceae. Most members of this genus are very helpful for making fermented dairy products, including cheese, yogurt, and butter (Fusco et al., 2019). Lactococcus also exists in the human gut. It is found that Lactococcus lactis was present in the gastrointestinal tract of the infant on the first day of the life (Park et al., 2005). Lactococcus petauri has the closest relationship with L. garvieae and is a facultative anaerobic, non-motile, non-spore forming, Gram-positive cocci (Goodman et al., 2017). To date, L. petauri has been obtained in a facial abscess of a sugar glider alone, and no functional evidence was published. Microbial genomics can offer further understanding of functional gene characteristics, metabolic pathways of functional genes, and interactive mechanisms between regulatory factors. Therefore, deep understanding of the genome sequence of L. petauri strains was required.
Sequencing technology can truly reflect the genetic information of genomic DNA, providing important functional predictions. The Pacific Bio Sciences (Pac Bio) sequencing platform, which is a single molecular sequencing technology (Iso-Seq), offers significant improvements over current sequencing technologies because of its high throughput nature, fast speed, and longer reads (Qi et al., 2019). However, the error rate of Pac Bio is higher than in second-generation sequencing (SGS) technologies, leading to a reduced accuracy of assembly (Koren et al., 2012). Therefore, short Illumina reads from second-generation data are used to assist the correction of the long-read third-generation data to improve the accuracy of genome assembly without increasing the cost of sequencing. Following this, hybrid assembly is performed in whole-genome sequences (Rahman et al., 2013; Pootakham et al., 2017).
In this study, L. petauri CF11 was sequenced using the second- and third-generation sequencing technologies. The hybrid assembly genome was obtained based on short Illumina reads and long Pac Bio reads. These data offer a good foundation for the future research on genome function annotation, comparative genome analysis, and re-sequencing.
Materials and Methods
Isolation and Genomic Sequencing of Strain
Fresh fecal samples were gathered from the large intestines of four healthy persons, 0.1 g feces was suspended in 1.0 mL PBS buffer. 100 μL suspension was coated evenly on MRS solid medium. The fastest-growing single colony was named CF11. The strain was reserved at −80°C until next experiments.
This strain was inoculated in MRS solid medium at 37°C in anaerobic culture for 24 h. A single colony was harvested into 3 × 100 mL MRS liquid medium to create an enriched culture at 37 °C for 24 h. The thalli were harvested by centrifugation at 5000 rpm at 4°C for 10 min and then incubated in liquid nitrogen for 10 min. The total genomic DNA of CF11 was extracted and purified using a QIAGEN DNA Investigator Kit, according to the manufacturer's instructions. A whole genome shotgun strategy was used for sequencing. Briefly, we built a library with different inserts, and the whole genome sequences were obtained based on the Illumina MiSeq and real-time single molecule sequencing technology (Besser et al., 2018). The sequencing work was complete in Nextomics Biosciences Co., Ltd (Wuhan, China). Reads were assembled using Canu-SMART de novo, after quality control (Koren et al., 2017) and corrected using Pilon version 1.22 (Walker et al., 2014) combined with second-generation sequencing data. MECAT could also be used for fast mapping, error correction, and de novo assembly (Xiao et al., 2017). After the assembly, data were compared with the genome using Minimap2 (Li, 2018). The sequencing depth of each site was counted using SAMtools (Li et al., 2009). DNA modifications, such as 5 mC and 6 mA, could be detected by deep recurrent neural network on sequencing data (Xiao et al., 2018; Liu et al., 2019).
Genome Annotation
The coding gene was predicted with prodigal (Hyatt et al., 2010) and the complete coding region was retained. Prediction results were integrated with their own scripts, and the locus tag numbers were assigned according to the gene sequence for subsequent analysis. In this experiment, tRNA genes were compared and predicted using tRNAscan-SE (Lowe and Chan, 2016). rRNA genes were predicted using RNAmmer (Lagesen et al., 2007). We used Infernal (Nawrocki and Eddy, 2013) to search the Rfam database (Kalvari et al., 2018) to compare and predict ncRNA. We found that >80% of the sequence length in the database was retained.
After extracting the encoded protein, Interroscan was used for annotation (Jones et al., 2014). We extracted the annotation information from TIGFAMs, Pham, and GO database (Haft et al., 2013). The GO annotation of coding genes in L. petauri CF11 was predicted using BLAST2 GO software. Pathway analyses were performed using the Genomes (KEGG) (Kanehisa et al., 2014) annotation service. The best results, with >30% coverage, were retained and mapped to the corresponding KEGG Pathway. Encoded proteins were compared with the COG database (Galperin et al., 2015) using rpsblast for COG functional annotation. Following this, protein coding genes that corresponded to COG functional numbers with the best consistency were selected. We categorized COG functional proteins according to the corresponding relationship between the number and classification directory. After the completion of both structural and functional annotation, we integrated the results to generate a final gff3 comment file. Next, tbl2asn was used to convert the comment and genome information into gb and sqn format files that were uploaded to NCBI directly. Sequencing depth, GC distribution, GC-skew, and genome structure were analysed using self-contained scripts. Finally, the ring map was drawn using Circos (Krzywinski et al., 2009).
Phylogenetic Analysis of L. petauri CF11
The 16s rRNA sequence of L. petauri CF11 was compared with the NCBI database to discover strains similar to CF11. The 16s rRNA sequence phylogenetic tree of CF11 was constructed using MEGA X software (Kumar et al., 2018). The evolutionary relationship of the whole genome sequence was evaluated from different sources of strains using OrthoANI (https://www.ezbiocloud.net/tools/ani). The ANI values of the eight strains were calculated on the http://enve-omics.ce.gatech.edu/ani/index. DNA-DNA hybridization (DDH) was calculated using GGDC 2.1(http://ggdc.dsmz.de/ggdc.php).
Results and Discussion
General Genome Features of L. petauri CF11
There were 2,350,677,266 bp raw data outputs and 2,067,135,965 bp that underwent quality control in this study. And totally 217,153 reads were determined as valid with N50 of 12,313 bp. The longest reads was 98,214 bp. We obtained the genome of L. petauri CF11, which was comprised of 1 contig consisting of 1,997,720 bp, with an average G+C content of 38.21 mol% of the genome ( Table 1 ). L. petauri CF11 has a small genome size and high G+C content relative to ten Lactococcus species/subspecies, where total genome size ranges from 1.99 (L. plantarum) to 2.46 Mb (L. lactis subsp. lactis). In addition, G+C content ranges from 34.81 (L. lactis subsp. hordniae) to 39.67 mol% (L. raffinolactis) (Yu et al., 2017). To date, one other study has reported the gene characterisation of L. petauri before this report. Furthermore, a genomic island was identified in the genome of L. petauri CF11, which was related to the bacterial fitness and virulence (Wu et al., 2014). We selected previously reported whole genome sequences for a comparative analysis, including contained L. lactis subsp. lactis ATCC 19435T, L. lactis subsp. hordriae LMG 8520T, L. lactis subsp. cremoris LMG 6897T, L. petauri 159469T, L. garvieae NBRC 100934T, L. raffinolactis NBRC 100932T, L. chungangensis DSM 22330T, and L. plantarum NBRC 100936T. L. petauri CF11 is composed of a complete chromosome and the gene content is similar to that of L. plantarum NBRC 100936T and L. garvieae NBRC 100934T ( Table 2 ). L. petauri CF11 has a smaller genome size and lower number of predicated genes when compared with L. petauri 159469T. The isolated source is important parameter in assessing strain function. L. garvieae is as a pathogen found in diseased buffalos, cows, cats, dogs, and poultry. In contrast, L. garvieae isolated from healthy animals or the environment act as a probiotic (Vendrell et al., 2006). In this study, we obtained CF11 from the intestines of healthy individuals; therefore, its potential function as a probiotic should be investigated further.
Table 1.
Basic genomic characteristics of L. petauri CF11.
| Feature | Chromosome | % genome |
|---|---|---|
| Genome size (bp) | 1,997,720 | 100 |
| G + C content | 763,344 | 38.21 |
| 5S rRNA genes | 6 | 0.03 |
| 16S rRNA genes | 5 | 0.38 |
| 23S rRNA genes | 5 | 0.72 |
| Open reading frames (ORFs) | 1982 | 87.65 |
| Genomic island | 1 | 1.79 |
Table 2.
Comparative genome features of strain CF11 and the most closely related strains.
| Strain | Size(bp) | G+C mol% | Predicated gene number |
Isolated source |
|---|---|---|---|---|
| Lactococcus petauri CF11 | 1997720 | 38.2 | 1982 | Human intestines |
| Lactococcus lactis subsp. lactis ATCC 19435 T | 2514221 | 35.2 | 2665 | Milk (dairy starter) |
| Lactococcus lactis subsp. hordriae LMG 8520 T | 2435575 | 34.8 | 2523 | Leaf hopper (insect) |
| Lactococcus lactis subsp. cremoris LMG 6897 T | 2367195 | 35.5 | 2469 | Cheese starter |
| Lactococcus petauri 159469 T | 2397176 | 37.7 | 2356 | Facial abscess in a sugar glider |
| Lactococcus garvieae NBRC100934 T | 2028352 | 38.5 | 2054 | Water buffalos |
| Lactococcus raffinolactis NBRC100932 T | 2179192 | 39.8 | 2157 | Sour milk |
| Lactococcus chungangensis CAU28 T | 2214941 | 38.6 | 2185 | Activated sludge |
| Lactococcus plantarum NBRC100936 T | 1977763 | 36.7 | 1896 | Frozen pea |
All data were created from NCBI GenBank nucleotide database except for strain CF11.
Genome Annotation
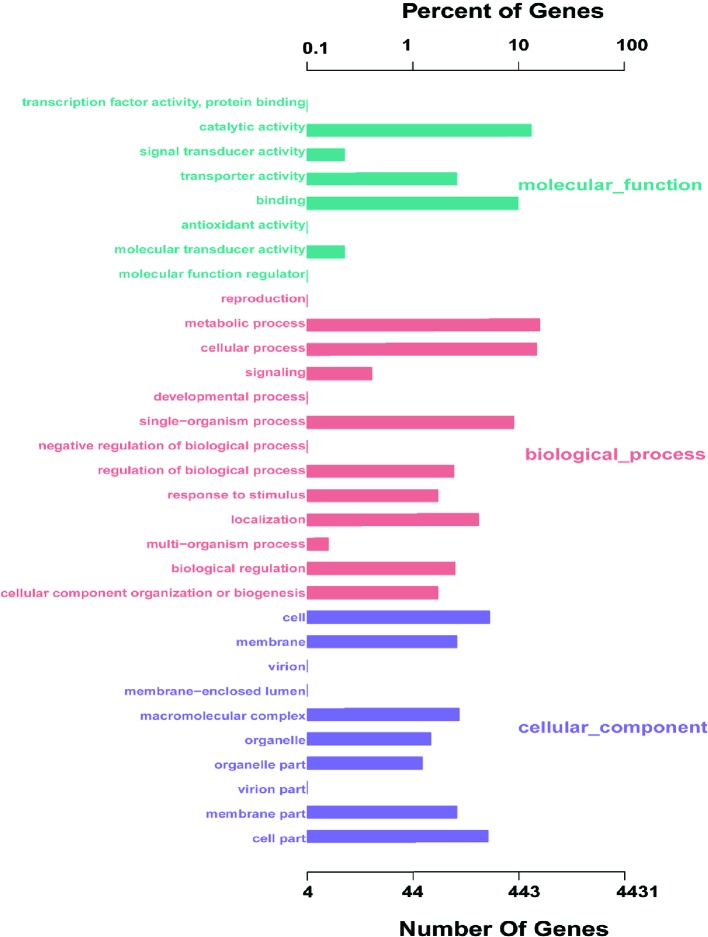
The coding sequence of L. petauri CF11 was predicted, with a total of 1982 coding sequences (CDSs) in the identified genome. We assigned 1206 genes (56.05%) to a putative function by Gene Ontology (GO). Interestingly, 87.56%, 33.08%, and 40.29% of the genes encoded for molecular functions, cellular components, and biological processes, respectively ( Figure 1 ). These results showed that the gene products of CF11 were linked with molecular functions, such as catalytic activity, binding, and transporter activity.
Figure 1.
L. petauri CF11 genome-encoded protein GO functional annotation. The green, red, and purple bars represent the molecular functions, biological processes, and the cellular components of the genes, respectively.
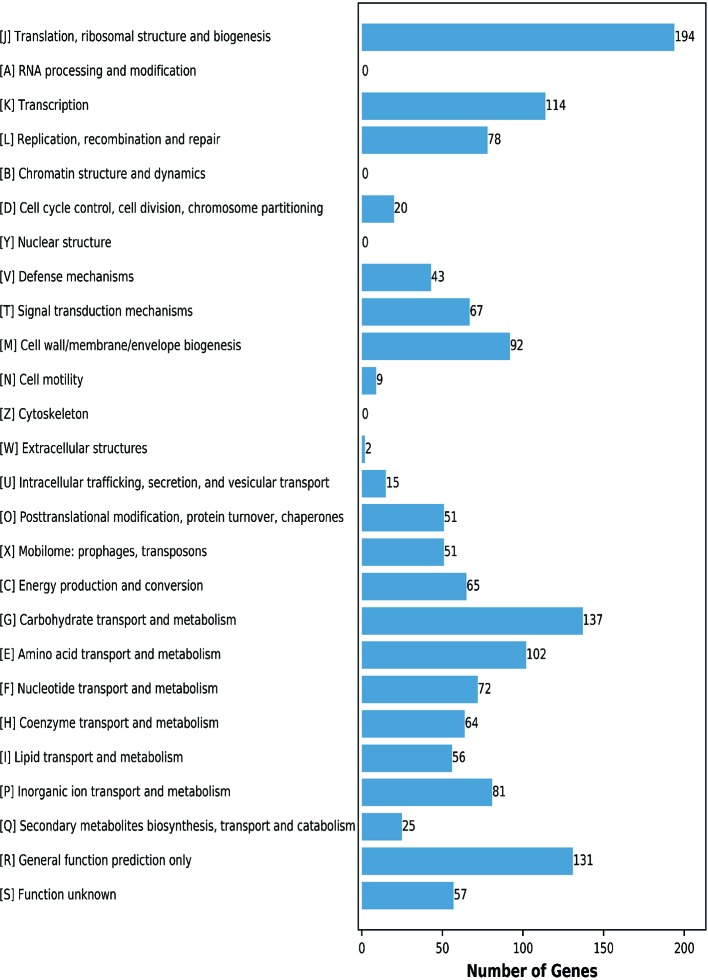
This analysis assigned 1365 genes (68.87%) to an illative function by the Clusters of Orthologous Groups (COGs) database. The CF11 proteins were classified into functional categories for translation, ribosomal structure, and biogenesis (J,194 genes); carbohydrate transport and metabolism (G,137 genes); transcription (K, 114 genes); and amino acid transport and metabolism (E, 102 genes) ( Figure 2 ). These regulators act on specific genes to control their expression and confer an advantage when present in the gut, which can assess the mechanisms employed to survive in this harsh environment (Zhang et al., 2019). We predicted that 9.60% of genes were associated with general functions, while 4.18% of the proteins were poorly characterized. Further analysis is required to elucidate their underlying mechanisms. In addition, 31.13% of the genes were not annotated by COG.
Figure 2.
COG functional annotation of the genomic encoding proteins in L. petauri CF11. A–Z letters represent different COG functions. A: RNA processing and modification; B: Chromatin structure and dynamics; C: Energy production and conversion; D: Cell cycle control, cell division, and chromosome partitioning; E: Amino acid transport and metabolism; F: Nucleotide transport and metabolism; G: Carbohydrate transport and metabolism; H: Coenzyme transport and metabolism; I: Lipid transport and metabolism; J: Translation, ribosomal structure, and biogenesis; K: Transcription; L: Replication, recombination, and repair; M: Cell wall/membrane/envelope biogenesis; N: Cell motility; O: Posttranslational modification, protein turnover, chaperones; P: Inorganic ion transport and metabolism; Q: Secondary metabolites biosynthesis, transport, and catabolism; R: General function prediction; S: Function unknown.
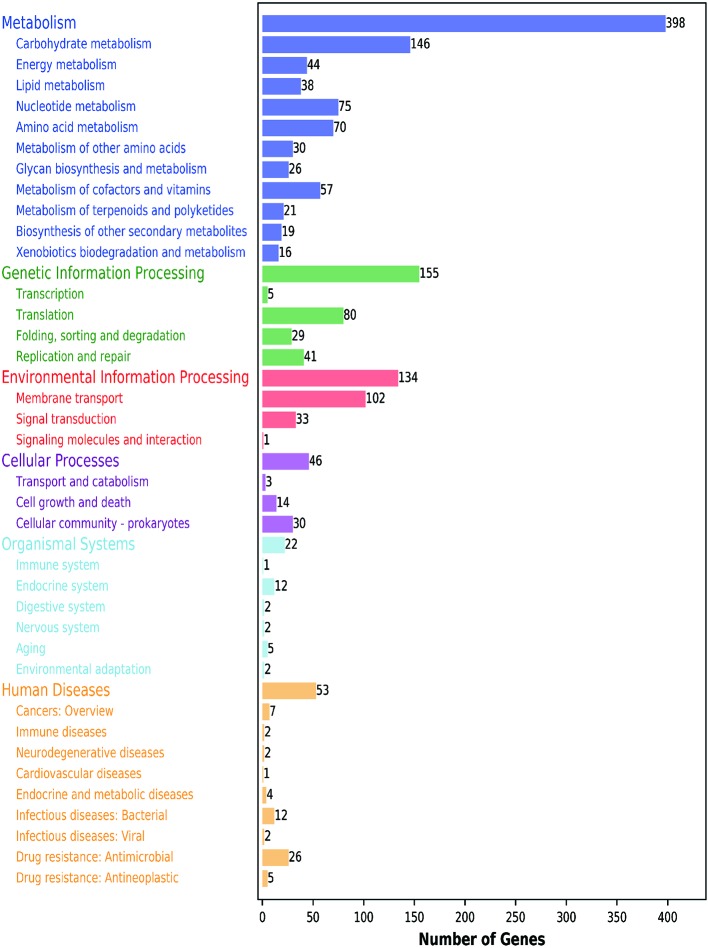
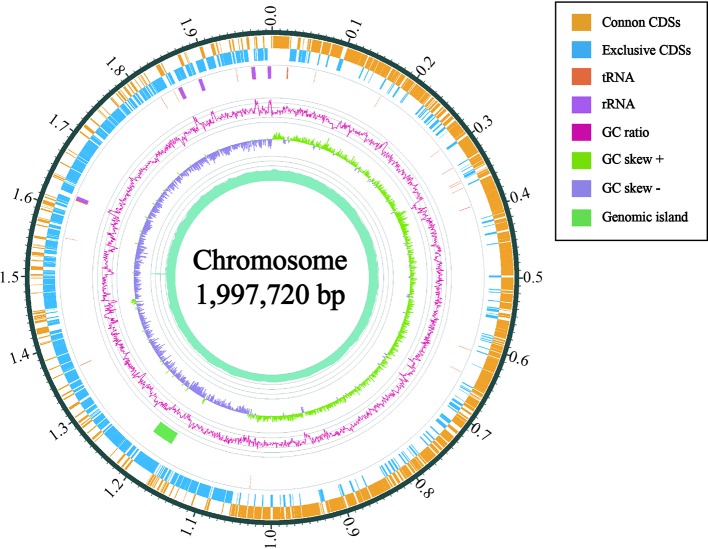
Furthermore, 1111 genes (56.05%) were classified into six KEGG functional categories ( Figure 3 ). These were primarily linked with metabolism (35.82%), genetic information processing (13.95%), environmental information processing (12.06%), cellular processes (4.14%), organismal systems (1.98%), and human diseases (4.77%). Each category contains its own metabolic processes. We found that 41 genes related to the viability of the bacteria were mapped to five KEGG pathways (phage replication initiation proteins; DNA replication proteins; replication initiation and membrane attachment proteins; ribosomal proteins; and the DNA replication and repair protein, RecF). This indicates that these genes play a vital role in these five pathways. In addition, we found that 11 out of 398 metabolic genes were associated with the pyruvate pathway, in which pyruvate metabolites are synthesized. Further, 13.14% of genes were linked to the carbohydrate transport metabolism. The gene coding for a key enzyme of glycolysis pathway, fructose-bisphosphate aldolase, exists in the genome containing all the genes that are required to degrade glucose to pyruvate. Pyruvate can be converted into lactic acid via the lactic dehydrogenase gene. Interestingly, several enzymes relating to pyruvate conversion, such as α-acetolactate synthetase, pyruvate-formate cleavage synthase, and lactate dehydrogenase, were confirmed in the genome of CF11 ( Figure 4 ). The CF11 genome encoded 35 phosphoenol pyruvate-dependent PTS EII complexes related to the transport of carbon sources, including cellobiose, fructose, galactitol, lactose, mannose, sucrose, trehalose, mannitol, and maltose. The PTS is related to catalyze sugar transport as well as sugar phosphorylation (Saier, 2015). This suggests that L. petauri CF11 produces SCFAs via glycolysis.
Figure 3.
KEGG functional annotation of genome-encoding protein in L. petauri CF11. Blue: metabolism; Green: genetic information processing; Red: environmental information processing; Purple: cellular process; Light blue: biological system; Yellow: human disease.
Figure 4.
Circular map of the chromosome of L. petauri CF11. From outside to inside are the encoding genes (positive chains), encoding genes (negative chains), tRNA (orange) and rRNA (purple), genomic island (green), GC ratio (pink; mean GC is the reference line, the lines protruding outward and inward are above and below the mean, respectively; the GC-skew purple and green indicate <0 and >0, respectively.
Phylogenetic Comparison of L. petauri CF11
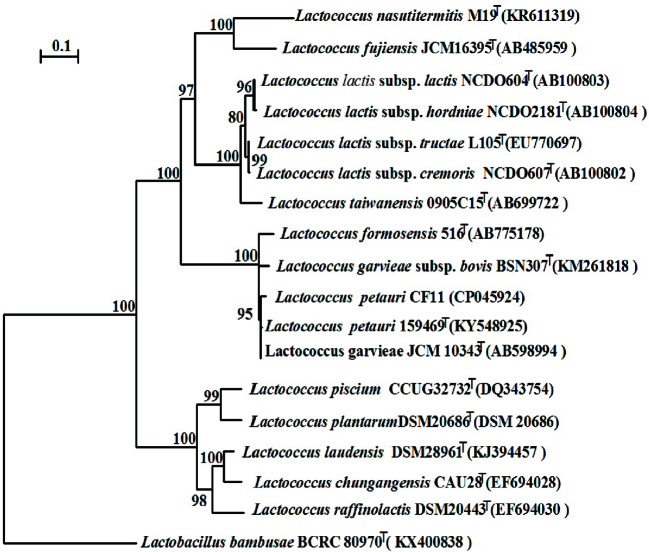
We constructed a phylogenetic tree based on the 16S rRNA gene sequence. The most closely related trains were L. garvieae NBRC 100934T and L. petauri 159469T, with similarities above 99.7% and 99.5%, respectively ( Figure 5 ). The 16S rRNA gene similarities were significantly higher than the proposed species delimitation threshold 98.65% (Kim et al., 2014). But we can’t confirm the strain CF11 should be L. garvieae or L. petauri. So, the genomic analysis must be performed. L. petauri CF11 had the closest relationship with L. petauri 159469T, with OrthoANIu and ANI values of 98.04% and 98.02%, respectively, at the genome level ( Table 3 ). An ANI value of 97% is a species threshold; therefore, L. petauri CF11 and L. petauri 159469T may be same species (Richter and Rosselló-Móra, 2009). The highest DDH value (DDH = 81.80%) was obtained for the isolates, L. petauri CF11 and L. petauri 159469T. The gold standard threshold for species boundaries is a DDH of 70% similarity (Meier-Kolthoff et al., 2013). This offers further confirmation that CF11 belongs to the already described species, L. petauri. The other cluster contained seven isolates with ANI and DDH values of 77–94% and 22–55%, respectively. The 16S rRNA gene phylogenetic result cannot be used as an evaluation indicator alone for strain taxonomic position, the more gene or genomic level comparation is very essential.
Figure 5.
Neighbor-joining phylogenetic tree based on the 16S rRNA gene sequences of CF11 and closely related species within the genus Lactococcus. Bootstrap values (>70%) based on 1000 replications are listed as percentages at the branching points. The bar represents 0.1 substitutions per nucleotide position. Lactobacillus banbusae BCRC 80970T is presented as the outgroup.
Table 3.
Results of ANI calculations and in silico DDH (isDDH) of the strain CF11 compared with the several related species.
| Strains | Ortho ANIu (%) | ANI (%) | isDDH (%) |
|---|---|---|---|
| Lactococcus lactis subsp. lactis ATCC19435T | 72.69 | 78.88 | 22.70 |
| Lactococcus lactis subsp. hordriae LMG8520 T | 72.39 | 78.92 | 22.70 |
| Lactococcus lactis subsp. cremoris LMG6897 T | 72.76 | 79.18 | 24.60 |
| Lactococcus petauri 159469 T | 98.04 | 98.02 | 81.80 |
| Lactococcus garvieae NBRC100934 T | 93.61 | 93.27 | 54.30 |
| Lactococcus raffinolactis NBRC100932 T | 68.93 | 77.88 | 24.10 |
| Lactococcus chungangensis DSM22330 T | 69.18 | 77.39 | 24.90 |
| Lactococcus plantarum NBRC100936 T | 69.11 | 77.48 | 22.80 |
Data Availability Statement
The datasets generated for this study can be found in GenBank. The Whole-genome sequence accession No: CP045924.
Ethics Statement
This study was approved by the Ethical Committee of Southern Medical University, Guangzhou. The participants provided their written informed consent to participate when providing stool samples.
Author Contributions
S-TF and G-XZ conceived and designed the experiments. S-TF, Q-QR, J-GW, and Y-XJ carried out the experiment of this study. S-TF, Y-JO, G-XZ, Y-RC, YZ, and D-DW participated and analyzed data in the experiment. Y-JO and G-XZ prepared the manuscript. All authors have read and approved the manuscript in its final form.
Funding
This work was supported by the National Science Foundation of China (NSFC 31500076), Science and Technology Program of Guangzhou, China (201904010161) and Guangzhou Municipal Science and Technology Project (20191A011063).
Conflict of Interest
The authors declare that the research was conducted in the absence of any commercial or financial relationships that could be construed as a potential conflict of interest.
References
- Besser J., Carleton H. A., Gerner-Smidt P., Lindsey R. L., Trees E. (2018). Next-generation sequencing technologies and their application to the study and control of bacterial infections. Clin. Microbiol. Infect. 24, 335–341. 10.1016/j.cmi.2017.10.013 [DOI] [PMC free article] [PubMed] [Google Scholar]
- Fusco V., Quero G. M., Poltronieri P., Morea M., Baruzzi F. (2019). Autochthonous and probiotic lactic acid bacteria employed for production of “advanced traditional cheeses”. Foods 8, E412. 10.3390/foods8090412 [DOI] [PMC free article] [PubMed] [Google Scholar]
- Galperin M. Y., Makarova K. S., Wolf Y. I., Koonin E. V. (2015). Expanded microbial genome coverage and improved protein family annotation in the COG database. Nucleic Acids Res. 43, 261–269. 10.1093/nar/gku1223 [DOI] [PMC free article] [PubMed] [Google Scholar]
- Goodman L. B., Lawton M. R., Franklin-Guild R. J., Anderson R. R., Schaan L., Thachil A. J., et al. (2017). Lactococcus petauri sp. nov., isolated from an abscess of a sugar glider. Int. J. Syst. Evol. Microbiol. 67, 4397–4404. 10.1099/ijsem.0.002303 [DOI] [PMC free article] [PubMed] [Google Scholar]
- Haft D. H., Selengut J. D., Richter R. A., Harkins D., Basu M. K., Beck E. (2013). TIGRFAMs and genome properties in 2013. Nucleic Acids Res. 41, 387–395. 10.1093/nar/gks1234 [DOI] [PMC free article] [PubMed] [Google Scholar]
- Hyatt D., Chen G. L., Locascio P. F., Land M. L., Larimer F. W., Hauser L. J. (2010). Prodigal: prokaryotic gene recognition and translation initiation site identification. BMC Bioinf. 11, 119. 10.1186/1471-2105-11-119 [DOI] [PMC free article] [PubMed] [Google Scholar]
- Jones P., Binns D., Chang H. Y., Fraser M., Li W., McAnulla C., et al. (2014). InterProScan 5: genome-scale protein function classification. Bioinformatics 30, 1236–1240. 10.1093/bioinformatics/btu031 [DOI] [PMC free article] [PubMed] [Google Scholar]
- Kalvari I., Argasinska J., Quinones-Olvera N., Nawrocki E. P., Rivas E., Eddy S. R., et al. (2018). Rfam 13.0: shifting to a genome-centric resource for non-coding RNA families. Nucleic Acids Res. 46, 335–342. 10.1093/nar/gkx1038 [DOI] [PMC free article] [PubMed] [Google Scholar]
- Kanehisa M., Goto S., Sato Y., Kawashima M., Furumichi M., Tanabe M. (2014). Data, information, knowledge and principle: back to metabolism in KEGG. Nucleic Acids Res. 42, 199–205. 10.1093/nar/gkt1076 [DOI] [PMC free article] [PubMed] [Google Scholar]
- Kim M., Oh H. S., Park S. C., Chun J. (2014). Towards a taxonomic coherence between average nucleotide identity and 16S rRNA gene sequence similarity for species demarcation of prokaryotes. Int. J. Syst. Evol. Microbiol. 64, 345–351. 10.1099/ijs.0.059774-0 [DOI] [PubMed] [Google Scholar]
- Koren S., Schatz M. C., Walenz B. P., Martin J., Howard J. T., Ganapathy G., et al. (2012). Hybrid error correction and de novo assembly of single-molecule sequencing reads. Nat. Biotechnol. 30, 693–700. 10.1038/nbt.2280 [DOI] [PMC free article] [PubMed] [Google Scholar]
- Koren S., Walenz B. P., Berlin K., Miller J. R., Bergman N. H., Phillippy A. M. (2017). Canu: scalable and accurate long-read assembly via adaptive k-mer weighting and repeat separation. Genome Res. 27, 722–736. 10.1101/gr.215087.116 [DOI] [PMC free article] [PubMed] [Google Scholar]
- Krzywinski M., Schein J., Birol I., Connors J., Gascoyne R., Horsman D., et al. (2009). Circos: an information aesthetic for comparative genomics. Genome Res. 19, 1639–1645. 10.1101/gr.092759.109 [DOI] [PMC free article] [PubMed] [Google Scholar]
- Kumar S., Stecher G., Li M., Knyaz C., Tamura K. (2018). MEGA X: molecular evolutionary genetics analysis across computing platforms. Mol. Biol. Evol. 35, 1547–1549. 10.1093/molbev/msy096 [DOI] [PMC free article] [PubMed] [Google Scholar]
- Lagesen K., Hallin P., Rødland E. A., Staerfeldt H. H., Rognes T., Ussery D. W. (2007). RNAmmer: consistent and rapid annotation of ribosomal RNA genes. Nucleic Acids Res. 35, 3100–3108. 10.1093/nar/gkm160 [DOI] [PMC free article] [PubMed] [Google Scholar]
- Li H., Handsaker B., Wysoker A., Fennell T., Ruan J., Homer N., et al. (2009). The sequence alignment/map format and SAMtools. Bioinformatics 25, 2078–2079. 10.1093/bioinformatics/btp352 [DOI] [PMC free article] [PubMed] [Google Scholar]
- Li H. (2018). Minimap2: pairwise alignment for nucleotide sequences. Bioinformatics 34, 3094–3100. 10.1093/bioinformatics/bty191 [DOI] [PMC free article] [PubMed] [Google Scholar]
- Liu Q., Fang L., Yu G., Wang D., Xiao C. L., Wang K. (2019). Detection of DNA base modifications by deep recurrent neural network on Oxford Nanoporesequencing data. Nat. Commun. 10, 2449. 10.1038/s41467-019-10168-2 [DOI] [PMC free article] [PubMed] [Google Scholar]
- Lowe T. M., Chan P. P. (2016). tRNAscan-SE On-line: integrating search and context for analysis of transfer RNA genes. Nucleic Acids Res. 44, w54–w57. 10.1093/nar/gkw413 [DOI] [PMC free article] [PubMed] [Google Scholar]
- Lynch S. V., Pedersen O. (2016). The human intestinal microbiome in health and disease. N. Engl. J. Med. 375, 2369–2379. 10.1056/NEJMra1600266 [DOI] [PubMed] [Google Scholar]
- Meier-Kolthoff J. P., Göker M., Spröer C., Klenk H. P. (2013). When should a DDH experiment be mandatory in microbial taxonomy? Arch. Microbiol. 195, 413–418. 10.1007/s00203-013-0888-4 [DOI] [PubMed] [Google Scholar]
- Nawrocki E. P., Eddy S. R. (2013). Infernal 1.1: 100-fold faster RNA homology searches. Bioinformatics 29, 2933–2935. 10.1093/bioinformatics/btt509 [DOI] [PMC free article] [PubMed] [Google Scholar]
- Nicholson J. K., Holmes E., Kinross J., Burcelin R., Gibson G., Jia W., et al. (2012). Host-gut microbiota metabolic interactions. Science 336, 1262–1267. 10.1126/science.1223813 [DOI] [PubMed] [Google Scholar]
- Park H. K., Shim S. S., Kim S. Y., Park J. H., Park S. E., Kim H. J., et al. (2005). Molecular analysis of colonized bacteria in a human newborn infant gut. J. Microbiol. 43, 345–353. [PubMed] [Google Scholar]
- Pootakham W., Sonthirod C., Naktang C., Ruang-Areerate P., Yoocha T., Sangsrakru D., et al. (2017). De novo hybrid assembly of the rubber tree genome reveals evidence of paleotetraploidy in Hevea species. Sci. Rep. 7, 41457. 10.1038/srep41457 [DOI] [PMC free article] [PubMed] [Google Scholar]
- Qi W., Colarusso A., Olombrada M., Parrilli E., Patrignani A., Tutino M. L., et al. (2019). New insights on Pseudoalteromonas haloplanktis TAC125 genome organization and benchmarks of genome assembly applications using next and third generation sequencing technologies. Sci. Rep. 9, 16444. 10.1038/s41598-019-52832-z [DOI] [PMC free article] [PubMed] [Google Scholar]
- Rahman A. Y., Usharraj A. O., Misra B. B., Thottathil G. P., Jayasekaran K., Feng Y., et al. (2013). Draft genome sequence of the rubber tree Hevea brasiliensis. BMC. Genomics 14, 75. 10.1186/1471-2164-14-75 [DOI] [PMC free article] [PubMed] [Google Scholar]
- Richter M., Rosselló-Móra R. (2009). Shifting the genomic gold standard for the prokaryotic species definition. Proc. Natl. Acad. Sci. U. S. A. 106, 19126–19131. 10.1073/pnas.0906412106 [DOI] [PMC free article] [PubMed] [Google Scholar]
- Saier M. H. J. (2015). The bacterial phosphotransferase system: new frontiers 50 years after its discovery. J. Mol. Microbiol. Biotechnol. 25, 73–78. 10.1159/000381215 [DOI] [PMC free article] [PubMed] [Google Scholar]
- Thaiss C. A., Zmora N., Levy M., Elinav E. (2016). The microbiome and innate immunity. Nature 535, 65–74. 10.1038/nature18847 [DOI] [PubMed] [Google Scholar]
- Vendrell D., Balcázar J. L., Ruiz-Zarzuela I., de Blas I., Gironés O., Múzquiz J. L. (2006). Lactococcus garvieae in fish: a review. Comp. Immunol. Microbiol. Infect. Dis. 29, 177–198. 10.1016/j.cimid.2006.06.003 [DOI] [PubMed] [Google Scholar]
- Walker B. J., Abeel T., Shea T., Priest M., Abouelliel A., Sakthikumar S., et al. (2014). Pilon: an integrated tool for comprehensive microbial variant detection and genome assembly improvement. PLoS One 9, e112963. 10.1371/journal.pone.0112963 [DOI] [PMC free article] [PubMed] [Google Scholar]
- Wu Z., Wang W., Tang M., Shao J., Dai C., Zhang W., et al. (2014). Comparative genomic analysis shows that Streptococcus suis meningitis isolate SC070731 contains a unique 105K genomic island. Genetics 535, 156–164. 10.1016/j.gene.2013.11.044 [DOI] [PubMed] [Google Scholar]
- Xiao C. L., Chen Y., Xie S. Q., Chen K. N., Wang Y., Han Y., et al. (2017). MECAT: fast mapping, error correction, and de novo assembly for single-molecule sequencingreads. Nat. Methods 14, 1072–1074. 10.1038/nmeth.4432 [DOI] [PubMed] [Google Scholar]
- Xiao C. L., Zhu S., He M., Chen D., Zhang Q., Chen Y., et al. (2018). N6-Methyladenine DNA modification in the human genome. Mol. Cell. 71, 306–318. 10.1016/j.molcel.2018.06.015 [DOI] [PubMed] [Google Scholar]
- Yu J., Song Y., Ren Y., Qing Y., Liu W., Sun Z. (2017). Genome-level comparisons provide insight into the phylogeny and metabolic diversity of species within the genus Lactococcus . BMC Microbiol. 17, 213. 10.1186/s12866-017-1120-5 [DOI] [PMC free article] [PubMed] [Google Scholar]
- Zhang W., Wang J., Zhang D., Liu H., Wang S., Wang Y., et al. (2019). Complete genome sequencing and comparative genome characterization of Lactobacillus johnsonii ZLJ010, a potential probiotic with health-promoting properties. Front. Genet. 10, 812. 10.3389/fgene.2019.00812 [DOI] [PMC free article] [PubMed] [Google Scholar]
Associated Data
This section collects any data citations, data availability statements, or supplementary materials included in this article.
Data Availability Statement
The datasets generated for this study can be found in GenBank. The Whole-genome sequence accession No: CP045924.


