

Abstract
Due to the difference of raw materials and brewing technology, the quality and flavours of vinegar are different. Different kinds of vinegar have different functions and effects. Therefore, it is important to classify the vinegar varieties correctly. This work presented a new fuzzy feature extraction algorithm, called fuzzy Foley–Sammon transformation (FFST), and designed the electronic nose (E-nose) system for classifying vinegar varieties successfully. Principal component analysis (PCA) and standard normal variate (SNV) were used as the data preprocessing algorithms for the E-nose system. FFST, Foley–Sammon transformation (FST) and linear discriminant analysis (LDA) were used to extract discriminant information from E-nose data, respectively. Then, K nearest neighbor (KNN) served as a classifier for the classification of vinegar varieties. The highest identification accuracy rate was 96.92% by using the FFST and KNN. Therefore, the E-nose system combined with the FFST was an effective method to identify Chinese vinegar varieties and this method has wide application prospects.
Keywords: E-nose, Chinese vinegar, Fuzzy Foley–Sammon transformation (FFST), LDA, KNN
Introduction
Nowadays, Chinese people consume a lot of vinegar every day, and vinegar is already an indispensable spice in people’s life. Eating vinegar is regularly beneficial to the health of the human body. It has the functions of antioxidant (Verzelloni et al. 2007), promoting fatigue recovery and regulating blood sugar and blood pressure (Johnston et al. 2013). However, the inferior vinegar not only damages consumer rights and interests, but also does harm to the body. At present, there are many types of vinegar on the market, and their quality is very different (Ali et al. 2018, 2019). Therefore, it is becoming increasingly important to develop a rapid and accurate identification system for the vinegar.
Traditionally, the detection of vinegar quality and the identification of vinegar varieties rely mainly on instrumental analysis, such as gas chromatography–mass spectrometry (Tahir et al. 2016; Zhu et al. 2016), electrochemical analysis and potentiometric titration (Mo et al. 2008; Hashimoto et al. 2008). The total acid of vinegar was determined by potentiometric titration. Electrochemical analysis can make a specific analysis of organic compounds in vinegar. Although these methods can effectively identify the type and quality of vinegar, they need the professional personnel, a long detection period, and the expensive detection instruments. Therefore, these methods are not conducive to the promotion in the market. It is necessary to design a simple, rapid and effective system to detect vinegar. The electronic nose (E-nose) system is a good choice because it is fit for the flavour signal processing (Dai et al. 2018). Due to the difference in the raw materials and brewing process of vinegar, different kinds of vinegar have different flavour. Flavour is an important symbol of the quality of vinegar. The E-nose system can distinguish different types of vinegar and detect the inferior vinegar according to the flavour of vinegar.
The E-nose system is commonly referred to as the artificial olfactory system (Balasubramanian et al. 2012), and it is usually composed of a selective electrochemical sensor array and pattern recognition algorithms. It can identify simple or complex flavour, and get consistent results with human sensory evaluation. Therefore, the E-nose system can be used to identify the variety and the quality of vinegar according to the flavour of vinegar. Compared with traditional methods, the E-nose system has the unique advantages in analysis of vinegar, so it is easy to identify the types and quality of vinegar quickly and accurately. In addition, the structure of the E-nose system and detecting process are not complicated, and it costs less in detection.
E-nose was gradually applied in product analysis. Using the electronic nose, the origin and authenticity of products can be determined according to the aroma produced by some products. According to the characteristics of products and the E-nose system, above 80% classification accuracy can be obtained by choosing different classification methods. In some cases, even 100% classification accuracy could be achieved with appropriate pattern recognition algorithms and the E-nose system (Gliszczynska-Swiglo and Chmielewski 2017). E-nose could also be used as a new tool to predict and monitor the content of food additives (Qiu and Wang 2017). Furthermore, electronic nose could detect fruit quality according to the perception of fruit odors (Ucar and Ozalp 2017). Combined with feature fusion methods, an E-nose system was used employed in quality classification of Xihu-Longjing tea (Dai et al. 2015). In addition, the E-nose system coupled with pattern recognition algorithms was used to identify the quality and variety of Chinese spirit (Zeng et al. 2012), coffee (Brudzewski et al. 2012), Chinese liquors (Wu et al. 2019), fish and meat (Guney and Atasoy 2015; Kodogiannis 2017; Wojnowski et al. 2017). In general, the E-nose system is effective in detecting the quality of foods. Meanwhile, its process is very simple in the detection of food.
The pattern recognition algorithm is an important part of the E-nose system. The pattern recognition algorithm directly affects the performance of the E-nose system. There are many pattern recognition algorithms have been used in the E-nose system, such as principal component analysis (PCA) (Cheng et al. 2013; Ziyatdinov et al. 2010), linear discriminant analysis (LDA) (Amari et al. 2014; Fei et al. 2012), partial least square discrimination analysis (PLSDA) (Guan et al. 2014), K nearest neighbor (KNN) (Wang et al. 2017; Tang et al. 2010), support vector machines (SVM) (Vergara et al. 2013; Ramzi et al. 2014; Huang et al. 2018) and artificial neural network (ANN) (Sanaeifar et al. 2014; Guan et al. 2014; Abdullah et al. 2015). On the application of E-nose in identifying Chinese vinegar varieties, Zhang et al. (Zhang et al. 2006) proposed an approach to identify the 17 kinds of commercial Chinese vinegar. Cluster analysis (CA) and PCA were utilized to investigate the presence of classes in vinegar samples. Learning vector quantization (LVQ) neural network played an important role in the identification of Chinese vinegar varieties by E-nose. Zhang et al. (Zhang et al. 2008) adopted E-nose system, back-propagation artificial neural networks (BP-ANNs) and KNN to identify Chinese vinegar varieties. An optimization method of the sensor array was proposed in order to improve the accuracy of the identification of Chinese vinegar varieties by E-nose (Yin et al. 2014). Although the first two methods could be used to discriminate the type of vinegar, the classification accuracy was not high. The last method could improve the classification accuracy of the E-nose, but the types of vinegar samples were not enough in the experiment. Therefore, for the identification of vinegar varieties, the research of the E-nose system needs to be further improved.
The main purpose of this paper is to design an E-nose system and propose a fuzzy feature extraction algorithm to increase the classification accuracy in identifying five types of Chinese vinegar. The hardware part of the E-nose system contains ten gas sensors, two power supplies, and a data acquisition card. Furthermore, the new feature extraction algorithm called fuzzy Foley–Sammon transformation (FFST) was proposed for extracting the fuzzy discriminant information from the E-nose signal of vinegar samples. The FFST was a combination of the fuzzy theory and Foley–Sammon transformation (FST) (Foley and Sammon 1975), and it could use the multiple orthogonal discriminant vectors to obtain the fuzzy discriminant information which was beneficial to improve the classification accuracy.
Materials and methods
Vinegar samples
We purchased five different kinds of Chinese vinegars (Zhenjiangxiangcu, Zhenjiangchencu, Baoningcu, Hengshunxiangcu and Shanxichencu) at a local supermarket. Each kind of vinegar samples included 51 samples, and a total of 255 vinegar samples were prepared. The detailed information of experimental vinegars was described in Table 1.
Table 1.
The details of vinegar samples in this experiment
| Sample name | Type | Raw materials | Fermentation method | Production area |
|---|---|---|---|---|
| Hengshunxiangcu | Aromatic vinegar | Sticky rice, sugar, salt, water, sodium benzoate | Solid fermentation | Jiangsu province |
| Zhenjiangchencu | Mature vinegar | Water, sticky rice, wheat bran, sugar, salt | Solid fermentation | Jiangsu province |
| Shanxichencu | Mature vinegar | Sorghum, barley, pea, bran, water, rice bran, edible salt | Solid fermentation | Shanxi province |
| Zhenjiangxiangcu | Aromatic vinegar | Water, glutinous rice, wheat bran, white sugar, Daqu, edible salt | Solid fermentation | Jiangsu province |
| Baoningcu | Bran vinegar | Water, bran, wheat, rice, glutinous rice | Solid fermentation | Sichuan province |
E-nose system and experimental devices
The hardware part of the E-nose system consisted of data acquisition card, gas sensor array and power supply. The gas sensor array included Tagushi gas sensors (TGS) and metal oxide (MQ) gas sensors. TGS sensors are made in Japan Figaro, which can measure the current by oxidizing or reducing an object gas at an electrode to obtain a target gas concentration. The gas sensitive material of MQ gas sensors are made in China (Weisheng Electronics Technology Co., Ltd.). The sensitive material of MQ gas sensors is a highly active metal-oxide semiconductor. MQ gas sensors can detect a variety of flammable gases. TGS sensors and MQ gas sensors can be used to detect the main components of volatile gases in vinegar. The gas sensor array in our designed E-nose system included TGS-2600, TGS-2602, TGS-2610, TGS-2611, TGS-2620, TGS-813, TGS-822, TGS-822TF, MQ-135 and MQ-3. The heater voltage of the entire sensors was 5 V. The 10 V was served as the circuit voltage of TGS-813, TGS-822 and TGS-822TF and the 5 V for the remaining sensors.
The data acquisition card (MP4623) made in China (Beijing Shuangnuo Measurement and Control Technology Co., Ltd.) contains a 12-bit 500 kHz high-speed acquisition module based on USB2.0 bus. It has 15 single-ended inputs and automatic scanning channels, and it can transmit the sensor data to the computer.
In addition, we also prepared an experimental device for collecting the data. The experimental device was shown in Fig. 1. The sensor array, data acquisition card and power supply were all placed in the experimental device. A sample of vinegar and the gas sensor array were placed in the reaction chamber. Two ventilation fans were used to clean the gas in the reaction chamber.
Fig. 1.

The experimental device
In order to power the E-nose sensor array and ventilation fans, we prepared two power supplies: one provided a regulated 5 voltage and the other provided a regulated 10 voltage.
Experimental procedure
The experiments were carried out at laboratory (about 20 °C, 40% relative humidity). Because the vinegar is volatile, when it is placed in the air, its flavour molecules will be quickly in the surrounding air. The 15 ml of vinegar sample was placed in the reaction chamber in a beaker. The vinegar sample quickly volatilized in the reaction chamber and came into contact with the sensor array, and each sensor generated a voltage signal according to the flavour of vinegar. The response voltage of one sensor was served as a characteristic of a vinegar sample.
The E-nose data acquisition process was shown in Fig. 2. The specific steps for data collection of vinegar samples are described as follows.
Start the experimental setup.
Power on the E-nose and preheat the sensors for one hour in clean air.
Place the 15 ml of vinegar sample in the beaker and place it in the reaction chamber.
Write the computer program by LabVIEW for data collection and record at three time points as 60 min, 65 min, and 70 min, respectively.
Average the data collected at three time points as a result datum of one vinegar sample.
After completing the data collection of one vinegar sample, open the experimental device cover and use ventilation fans to clean the gas in the reaction chamber. When sensors return to the initial state, and repeat steps (3–6).
Fig. 2.
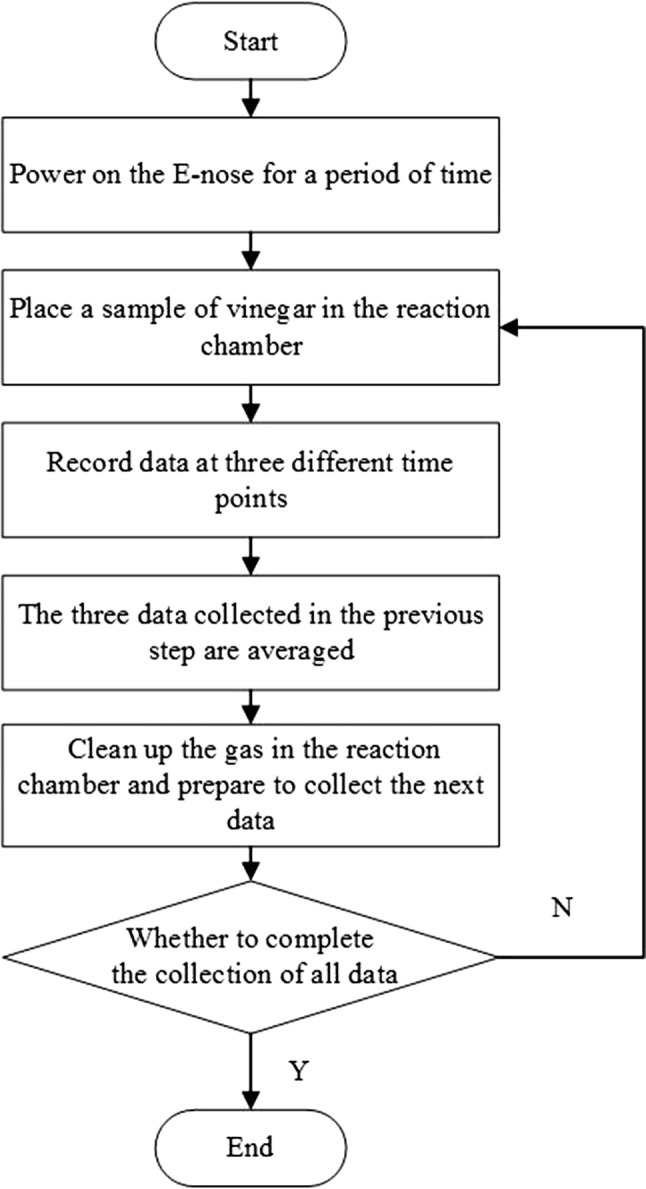
The E-nose data acquisition process
After all the vinegar sample data were collected, the data were processed by MATLAB. All vinegar samples were divided into training samples (the first 25 samples in one kind of vinegar samples) and test samples (the next 26 samples in one kind of vinegar samples). Cross-validation is a necessary method in the training of sample sets, and it can ensure generalization better. In this experiment, we used K-fold cross-validation to obtain the optimal model.
Foley–Sammon transformation and fuzzy Foley–Sammon transformation (FFST)
In this section, a new method called fuzzy Foley–Sammon transformation (FFST) was proposed for feature extraction. Based on fuzzy theory, FFST was inspired by the Foley–Sammon transformation (FST) which was proposed by Foley and Sammon (1975).
Next, let us review the FST. Let X = {xi}, i = 1, 2,…n, be a set of q-dimensional samples. Supposing are c known pattern classes. . The Sb, Sw and St are the between-class scatter matrix, the within-class scatter matrix, and the total population scatter matrix respectively. They can be calculated according to Eqs. (1), (2) and (3), respectively.
| 1 |
| 2 |
| 3 |
| 4 |
| 5 |
In the above equations, is the mean of the samples in the ith class, and is a priori probability of the class . The mean vector m0 is the mean of all samples, and it can be obtained by the Eq. (5). The covariance matrix Ci of the ith class samples is calculated by the Eq. (4).
The Fisher criterion function defined by Eq. (6).
| 6 |
In the Eq. (6), is an arbitrary vector in q-dimensional space Rq. The maximum of corresponding to vector is the Fisher optimal discriminant direction. If a set of samples are projected on the direction , the patterns have the minimal within-class scatter and the maximal between-class scatter in the one-dimensional subspace spanned by .
The algorithm description of FST was given in Fig. 3. The Foley–Sammon transformation (FST) contains three steps.
Fig. 3.

The algorithm description of FST
Step 1 According to Eq. (7), calculating the Fisher’s vector and the corresponding maximum eigenvalue.
| 7 |
The is regarded as the first vector of the Foley–Sammon optimal discriminant vector set.
Step 2 Assuming the first r optimal discriminant vectors of FST are acquired. The vector can be computed by maximizing the Eq. (6) and the orthogonality constraints of Eq. (8).
| 8 |
Then, the eigenvector and the corresponding maximum eigenvalue λ are computed by the Eq. (9).
| 9 |
where
| 10 |
and I is the identity matrix.
Step 3 According to above calculations, the optimal discriminant vectors are obtained. Then, the linear transformation from Rq to Rp is called Foley–Sammon transformation.
| 11 |
By introducing fuzzy theory into FST, FFST can extract fuzzy features from data. Note that the values of fuzzy membership uik and the value vi of class center should be computed by the Eqs. (12) and (13) before the FFST is used for feature extraction.
| 12 |
| 13 |
uik is the fuzzy membership value of the xk sample belonging to class i in Eq. (12). vi is the central value of class i, and the n is the number of training samples in Eq. (13). is the mean of training samples in class i, and the is the weight index in Eq. (13).
The algorithm description of FFST was shown in Fig. 4. Then, FFST can extract the fuzzy features according to the following steps.
Fig. 4.
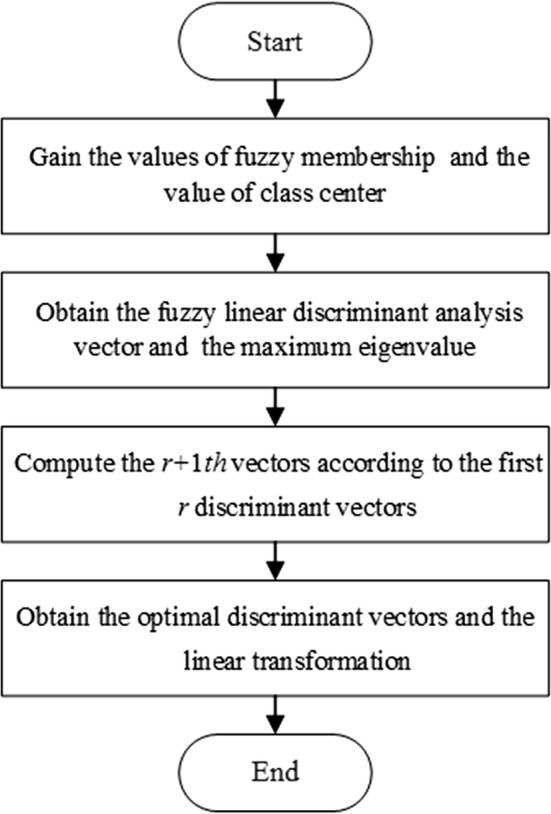
The algorithm description of FFST
Step 1 Compute the values of fuzzy membership uik and the value vi of class center by Eqs. (12) and (13), respectively.
Step 2 Obtain the fuzzy linear discriminant analysis (FLDA) vector according to Eq. (14) (Wu et al.2017), and is the maximum eigenvalue corresponding to . is regarded as the first vector of fuzzy Foley–Sammon optimal discriminant vector set.
| 14 |
Where SfB is the fuzzy between class scatter matrix
| 15 |
SfT is the fuzzy total class scatter matrix
| 16 |
c is the number of class; n is the number of training samples; m is the weight index.
Step 3 Assume the first r optimal discriminant vectors of FFST are acquired. The eigenvector can be computed according to Eq. (17).
| 17 |
In Eq. (17), .
; I is a unit matrix; and are the eigenvector and corresponding eigenvalue respectively.
Step 4 The optimal discriminant vectors are obtained according to the above calculations.
Then, the linear transformation from Rq to Rp is called fuzzy Foley–Sammon transformation (FFST).
| 18 |
Results and discussion
Optimal selection of sensor data
There were ten sensors in the E-nose system, and one collected datum had 10 variables from ten sensors in one experiment. However, some variables didn’t contribute much to the classification, so these variables could be eliminated. The sensor data were selected according to the ratio between the trace of the between-class scatter matrix and the trace of the within-class scatter matrix. When the ratio reached the maximum, the data could be classified well. The sensor data optimization process was shown in Fig. 5. The specific implementation steps are described as follows.
Input training set and test set.
Sensor data are randomly selected from all sensors. The selected number of sensors are 9, 8, 7, 6, 5 respectively. All the sensor combinations are recorded in the variables.
-
Between-class scatter matrix Sb, within-class scatter matrix Sw, trace of the between-class scatter matrix and the trace of the within-class scatter matrix should be calculated.
In the above, is the mean of samples in the ith class. is the mean of samples. xij is the jth sample of the ith class.
Calculate the ratio between the trace of the between-class scatter matrix and the trace of the within-class scatter matrix.
Find the sensor combination corresponding to the maximum value J.
Fig. 5.

The sensor data optimization process
According to the above calculation, when the number of sensors was set as 8, the value of J reached the maximum as 39018. The corresponding sensor models were TGS-2610, TGS-2620, TGS-2600, MQ-135, MQ-3, TGS-2602, TGS-813 and TGS-2611. At the same time, it showed that the sample data corresponding to the eight sensors can be classified and the classification accuracy was the highest.
Standard normal variate (SNV)
Standard normal variate (SNV) is one of the spectral pre-treatment methods, and it is designed to eliminate interference caused by scattering effects in the reflectance spectra. In this experiment, SNV was introduced to reduce the impact of experimental errors. At the same time, it could also reduce the magnitude and simplify calculations.
The distribution of raw data was shown in Fig. 6a. The distribution of data processed by the SNV was shown in Fig. 6b. In the Fig. 6a, b, one variable came from one datum of one sensor. The variables 1 to 8 represented sensors TGS-2610, TGS-2620, TGS-2600, MQ-135, MQ-3, TGS-2602, TGS-813 and TGS-2611, respectively. The ordinate represented the output data of the sensor. From the Fig. 6a, it could be seen that the output voltages ranged from about 2000 mV to 4000 mV. Due to the wide range of data distribution and the existence of abnormal values, it had a great influence on the accuracy and recognition speed of the E-nose system. After the SNV analysis, the distribution of data ranged from about − 2.5 to 1.5 mV in the Fig. 6b. At the same time, the impact of external interference on the data was reduced.
Fig. 6.

The distribution of E-nose data
Principal components analysis (PCA)
Principal components analysis (PCA) is typically used to obtain primary features for data and reduce the dimensionality of the high-dimensional data. In this experiment, PCA was utilized to process the data, and its result was shown in Fig. 7. The contribution rates of the first three principal components accounted for 99.21% of the variances (PC1, PC2 and PC3 accounted for 54.54%, 39.65%, and 5.02% respectively). As could be seen from Fig. 7, the distribution of data clusters of zhenjiangchencu, baoningcu zhenjiangxiangcu, hengshunxiangcu and shanxichengcu were relatively independent. The different brewing processes and production materials of vinegar could explain the difference in data cluster distribution. After the data clusters were processed by PCA, the dimensionality of the data was reduced from 8 to 6, and the cumulative contribution rate was 99.85%. While retaining the main information, PCA reduced the dimensionality of the high-dimensional data, but more importantly it removed noise signal after dimension reduction. It indicated that the data processed by PCA was very beneficial to the classification of vinegar varieties.
Fig. 7.
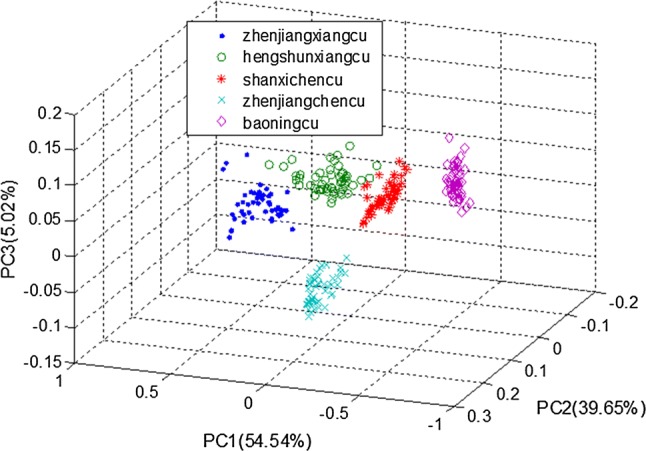
The scores plot of PCA
Feature extraction with FFST, FST and LDA
Fuzzy Foley–Sammon transformation (FFST), Foley–Sammon transformation (FST) and linear discriminant analysis (LDA) were used for feature extraction respectively, and KNN classifier was used as a classifier for classification of the data. FFST is different from FST which can use the orthogonal discriminant vectors to solve multi-class classification problems. Integrating fuzzy theory with FST, FFST can improve the performance of fuzzy feature extraction. Before FFST is applied, the fuzzy membership values should be calculated by training samples, and they were shown in Fig. 8. The data sets from top to bottom were zhenjiangxiangcu, hengshunxiangcu, shanxichengcu zhenjiangchencu and baoningcu, respectively. The abscissa represented the kth training sample and the ordinate represented the fuzzy membership value uik. If the uik is the maximal value in the ith class, the kth training sample belongs to the ith class. As could be seen from the Fig. 8, the relationship of each sample was clear. It was beneficial to obtain the main fuzzy discriminant information of each sample by the use of FFST. By using FFST for feature extraction, we could obtain four main features and formed an optimal discriminant vector set. Then, after the KNN classifier was used to classify the data, the highest classification accuracy was 96.99%. It indicated that FFST was an effective feature extraction method in processing E-nose signal data.
Fig. 8.
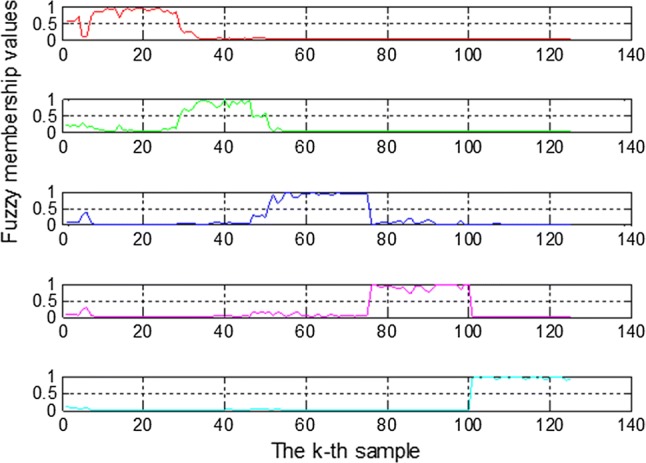
The fuzzy membership values of FFST
In order to compare the performance of the feature extraction methods, FST and LDA were also used for feature extraction, respectively. Similarly, we used FST and LDA to obtain four main features of vinegar samples and formed an optimal discriminant vector set, respectively. Then, the KNN classifier was used to classify the data, and the highest classification accuracy of FST or LDA was 94.62% which was slightly lower than that processed by FFST and KNN. It could be seen that FFST was more effective than FST and LDA for feature extraction of E-nose signal data.
Classification of vinegar varieties with KNN
Because the value of K has a greater impact on the classification results of the KNN classifier. Therefore, we chose the different values of K (1, 3, 5, 7, 9) when the KNN was used to classify the data. The classification accuracies of Chinese vinegar varieties were shown in Table 2. As could be seen from Table 2, the classification accuracy was highest when the value of K was 3 or 5. However, when the value of K changed, the accuracies of the classification by FFST were relatively high and changed little. It indicated that the performance of FFST was good for feature extraction, and FFST had the anti-interference ability.
Table 2.
The classification accuracies with the different values of K
| K | 1 (%) | 3 (%) | 5 (%) | 7 (%) | 9 (%) |
|---|---|---|---|---|---|
| PCA | 87.69 | 86.15 | 83.85 | 86.15 | 86.92 |
| LDA | 89.23 | 94.62 | 87.69 | 90.00 | 88.46 |
| FST | 93.08 | 94.62 | 87.69 | 86.15 | 83.08 |
| FFST | 93.08 | 92.31 | 96.92 | 93.85 | 93.85 |
Conclusion
In this study, a new feature extraction method, called fuzzy Foley–Sammon transformation (FFST), was proposed and applied in our designed E-nose system to deal with the E-nose signal data. The E-nose system coupled with SNV, PCA, FFST and KNN successfully identified the five kinds of Chinese vinegar, and the highest classification accuracy was 96.92%.
During the preprocessing of the data, the SNV and PCA were employed in the E-nose system. In feature extraction, FFST was used to extract the fuzzy features of the E-nose data. In addition, we compared the feature extraction methods: Foley–Sammon transformation (FST) and fuzzy Foley–Sammon transformation (FFST) in classification of data. From the results of the KNN classification, when the FFST and FST were used for feature extraction, the FFST had the higher classification accuracies than the FST for classifying different types of Chinese vinegar. At the same time, we also compared the identification accuracy rates of PCA, LDA and FFST. According to the experimental results, it could be found that the FFST was better than PCA and LDA when they were used in the E-nose system for distinguishing different kinds of Chinese vinegar.
In future study, the E-nose hardware system should be improved and more gas sensors will be applied in the sensor array. This E-nose sensor array can detect more gas features of vinegar samples so that it can distinguish more kinds of Chinese vinegar correctly. In addition, the machine learning algorithms should be further improved according to the features of the E-nose data. The E-nose system will have the high accuracy and fast speed in classification of different types of vinegar.
Funding
This study was supported by the project funded by National Science Foundation of China (31471413), Natural Science Foundation of Anhui colleges (KJ2018ZD064), Postgraduate Research & Practice Innovation Program of Jiangsu Province (SJCX17_0573) and Undergraduate Innovation and Entrepreneurship Training Program of Jiangsu University (201910299531X; 201810299274W).
Compliance with ethical standards
Conflict of interest
The authors declare that they have no conflicts of interest.
Human and animal rights
This article does not contain any studies with human participants or animals performed by any of the authors.
Informed consent
Not applicable.
Footnotes
Publisher's Note
Springer Nature remains neutral with regard to jurisdictional claims in published maps and institutional affiliations.
References
- Abdullah AH, Shakaff AYM, Zakaria A, Saad FSA, Abdul Shukor SA, Mat A. Application specific electronic nose (ASEN) for ganoderma boninense detection using artificial neural network. Int Conf Electron Des. 2015;24:148–152. [Google Scholar]
- Ali Z, Ma H, Ayim I, Wali A. Efficacy of new beverage made of dates vinegar and garlic juice in improving serum lipid profile parameters and inflammatory biomarkers of mildly hyperlipidemic adults: a double-blinded, randomized, placebo-controlled study. J Food Biochem. 2018;42(5):e12545. doi: 10.1111/jfbc.12545. [DOI] [Google Scholar]
- Ali Z, Ma H, Rashid MT, Wali A, Younas S. Preliminary study to evaluate the phytochemicals and physiochemical properties in red and black date’s vinegar. Food Sci Nutr. 2019;7(6):1976–1985. doi: 10.1002/fsn3.1009. [DOI] [PMC free article] [PubMed] [Google Scholar]
- Amari A, Bari NE, Bouchikhi B. Electronic nose for anchovy freshness monitoring based on sensor array and pattern recognition methods: principal components analysis linear discriminant analysis and support vector machine. J Reconstr Microsurg. 2014;29:141–148. [Google Scholar]
- Balasubramanian S, Amamcharla J, Panigrah S, Logue CM, Marchello M, Sherwood JS. Investigation of different gas sensor-based artificial olfactory systems for screening salmonella typhimurium contamination in beef. Food Bioprocess Technol. 2012;5:1206–1219. doi: 10.1007/s11947-010-0444-z. [DOI] [Google Scholar]
- Brudzewski K, Osowski S, Dwulit A. Recognition of coffee using differential electronic nose. IEEE Trans Instrum Meas. 2012;61:1803–1810. doi: 10.1109/TIM.2012.2184011. [DOI] [Google Scholar]
- Cheng H, Qin ZH, Guo XF, Hu XS, Wu JH. Geographical origin identification of propolis using GC-MS and electronic nose combined with principal component analysis. Food Res Int. 2013;51:813–822. doi: 10.1016/j.foodres.2013.01.053. [DOI] [Google Scholar]
- Dai Y, Zhi R, Zhao L, Gao H, Shi B, Wang H. Longjing tea quality classification by fusion of features collected from e-nose. Chemometr Intell Lab. 2015;144:63–70. doi: 10.1016/j.chemolab.2015.03.010. [DOI] [Google Scholar]
- Dai CX, Huang XY, Lv RQ, Zhang ZC, Sun J, Aheto JH. Analysis of volatile compounds of Tremella aurantialba fermentation via electronic nose and HS-SPME-GC-MS. J Food Saf. 2018;38(6):e12555. doi: 10.1111/jfs.12555. [DOI] [Google Scholar]
- Fei YJ, Bai X, Kang XH. Optimizition for sensor array of electronic nose system by linear discriminant analysis. Food Mach. 2012;28:97–100. [Google Scholar]
- Foley DH, Sammon JW. An optimal set of discriminant vectors. IEEE Comput Soc. 1975;24:281–289. [Google Scholar]
- Gliszczynska-Swiglo A, Chmielewski J. Electronic nose as a tool for monitoring the authenticity of food. Food Anal Method. 2017;10:1800–1816. doi: 10.1007/s12161-016-0739-4. [DOI] [Google Scholar]
- Guan BB, Zhao JW, Lin H, Zou XB. Characterization of volatile organic compounds of vinegars with novel electronic nose system combined with multivariate analysis. Food Anal Method. 2014;7(5):1073–1082. doi: 10.1007/s12161-013-9715-4. [DOI] [Google Scholar]
- Guney S, Atasoy A. Study of fish species discrimination via electronic nose. Comput Electron Agr. 2015;119:83–91. doi: 10.1016/j.compag.2015.10.005. [DOI] [Google Scholar]
- Hashimoto H, Chuda Y, Suzuki T, Yasui A. Method validation for determination of total acid in vinegar based on potentiometric titration by interlaboratory study. Bunseki Kagaku. 2008;57:453–459. doi: 10.2116/bunsekikagaku.57.453. [DOI] [Google Scholar]
- Huang XY, Pan SH, Sun ZY, Ye WT, Aheto JH. Evaluating quality of tomato during storage using fusion information of computer vision and electronic nose. J Food Process Eng. 2018;41:e12832. doi: 10.1111/jfpe.12832. [DOI] [Google Scholar]
- Johnston CS, Quagliano S, White S. Vinegar ingestion at mealtime reduced fasting blood glucose concentrations in healthy adults at risk for type 2 diabetes. J Funct Foods. 2013;5:2007–2011. doi: 10.1016/j.jff.2013.08.003. [DOI] [Google Scholar]
- Kodogiannis VS. Application of an electronic nose coupled with fuzzy-wavelet network for the detection of meat spoilage. Food Bioprocess Technol. 2017;10:1–20. doi: 10.1007/s11947-016-1851-6. [DOI] [Google Scholar]
- Mo SM, Liang LN, Cai YQ, Mu SF. Determination of content of amino acids in table vinegar by chromatography with electrochemical detection. Phys Test Chem Anal Part B (Chem Anal) 2008;44:336–338. [Google Scholar]
- Qiu S, Wang J. The prediction of food additives in the fruit juice based on electronic nose with chemometrics. Food Chem. 2017;230:208–214. doi: 10.1016/j.foodchem.2017.03.011. [DOI] [PubMed] [Google Scholar]
- Ramzi P, Samadzadegan F, Reinartz P. Classification of hyperspectral data using an adaboost svm technique applied on band clusters. IEEE J-Stars. 2014;7:2066–2079. [Google Scholar]
- Sanaeifar A, Mohtasebi SS, G-Varnamkhasti M, Siadat M (2014) Application of an electronic nose system coupled with artificial neural network for classification of banana samples during shelf-life process. In: International conference on control, pp 753–757
- Tahir HE, Zou XB, Huang XW, Shi JY, Mariod AA. Discrimination of honeys using colorimetric sensor arrays sensory analysis and gas chromatography techniques. Food Chem. 2016;206:37–43. doi: 10.1016/j.foodchem.2016.03.032. [DOI] [PubMed] [Google Scholar]
- Tang KT, Lin YS, Shyu JM. A local weighted nearest neighbor algorithm and a weighted and constrained least-squared method for mixed odor analysis by electronic nose systems. Sensors. 2010;10:10467–10483. doi: 10.3390/s101110467. [DOI] [PMC free article] [PubMed] [Google Scholar]
- Ucar A, Ozalp R. Efficient android electronic nose design for recognition and perception of fruit odors using kernel extreme learning machines. Chemometr Intell Lab. 2017;166:69–80. doi: 10.1016/j.chemolab.2017.05.013. [DOI] [Google Scholar]
- Vergara A, Fonollosa J, Mahiques J, Trincavelli M, Rulkov N, Huerta R. On the performance of gas sensor arrays in open sampling systems using inhibitory support vector machines. Sens Actuators B-Chem. 2013;185:462–477. doi: 10.1016/j.snb.2013.05.027. [DOI] [Google Scholar]
- Verzelloni E, Tagliazucchi D, Conte A. Relationship between the antioxidant properties and the phenolic and flavonoid content in traditional balsamic vinegar. Food Chem. 2007;105:564–571. doi: 10.1016/j.foodchem.2007.04.014. [DOI] [Google Scholar]
- Wang Z, Sun X, Miao J, Wang Y, Luo Z, Li G. Conformal prediction based on k-nearest neighbors for discrimination of ginsengs by a home-made electronic nose. Sensors. 2017;17:1869. doi: 10.3390/s17081869. [DOI] [PMC free article] [PubMed] [Google Scholar]
- Wojnowski W, Majchrzak T, Dymerski T, Gebicki J, Namiesnik J. Electronic noses: powerful tools in meat quality assessment. Meat Sci. 2017;131:119–131. doi: 10.1016/j.meatsci.2017.04.240. [DOI] [PubMed] [Google Scholar]
- Wu XH, Wu B, Sun J, Yang N. Classification of apple varieties using near infrared reflectance spectroscopy and fuzzy discriminant c-means clustering model. J Food Process Eng. 2017;40:e12355. doi: 10.1111/jfpe.12355. [DOI] [Google Scholar]
- Wu XH, Zhu J, Wu B, Zhao C, Sun J, Dai CX. Discrimination of Chinese liquors based on electronic nose and fuzzy discriminant principal component analysis. Foods. 2019;8:38. doi: 10.3390/foods8010038. [DOI] [PMC free article] [PubMed] [Google Scholar]
- Yin Y, Yu H, Chu B, Xiao Y. A sensor array optimization method of electronic nose based on elimination transform of wilks statistic for discrimination of three kinds of vinegars. J Food Eng. 2014;127:43–48. doi: 10.1016/j.jfoodeng.2013.11.017. [DOI] [Google Scholar]
- Zeng H, Li Q, Gu Y. New pattern recognition system in the e-nose for Chinese spirit identification. Chin Phys B. 2012;25:168–173. [Google Scholar]
- Zhang Q, Zhang S, Xie C, Zeng D, Fan C, Li D, Bai Z. Characterization of Chinese vinegars by electronic nose. Sens Actuators B-Chem. 2006;119:538–546. doi: 10.1016/j.snb.2006.01.007. [DOI] [Google Scholar]
- Zhang Q, Zhang S, Xie C, Fan C, Bai Z. ‘Sensory analysis’ of Chinese vinegars using an electronic nose. Sens Actuators B-Chem. 2008;128:586–593. doi: 10.1016/j.snb.2007.07.058. [DOI] [Google Scholar]
- Zhu H, Zhu J, Wang L, Li Z. Development of a SPME-GC-MS method for the determination of volatile compounds in shanxi aged vinegar and its analytical characterization by aroma wheel. J Food Sci. 2016;53:171–183. doi: 10.1007/s13197-015-2035-5. [DOI] [PMC free article] [PubMed] [Google Scholar]
- Ziyatdinov A, Marco S, Chaudry A, Persaud K, Caminal P, Perera A. Drift compensation of gas sensor array data by common principal component analysis. Sens Actuators B-Chem. 2010;146:460–465. doi: 10.1016/j.snb.2009.11.034. [DOI] [Google Scholar]