

Abstract
Detecting meat adulteration for quality control and accurate labeling is important and needs convenient analytical methods. This study aimed to investigate and compare the application of the transmission and ATR approaches of FTIR followed by principal component analysis (PCA) to not only discriminate between chicken and beef meat but also quantizing chicken portion of mixtures. Two different approaches are presented; spectra preprocessing with focus on wavenumber region of 1700–1071 cm−1, and no preprocessed where PCA was applied on the whole spectra range of mid-FTIR. The results suggest that applying PCA on specified preprocessed spectra could detect hidden relationships between variables in chicken and beef in both approaches. PCA successfully clustered these kinds of meats when applied on transmission mode spectra without any preprocessing treatment, while applying it on ATR mode’s raw spectra failed to cluster them. Additionally, the preprocessed ATR-FTIR spectrum was used to prepare regression models by Partial Least Square Regression (PLS-R) and artificial neural networks (ANN) for predicting presence and percentage of chicken meat in the beef meat mixture. The results demonstrated the superiority of ANN over PLS-R in this assessment with an R2 of 0.999.
Keywords: Transmission FTIR, ATR-FTIR, Meat, Chemometrics
Introduction
Recently, food authenticity is increasing throughout the world. This decreases the quality of the products and deceives the consumers. Authentication issues in meat and its products are most likely to occur in four major categories: meat origin, meat substitution, meat processing and non-meat ingredient addition (Nunes et al. 2016; Moreira et al. 2018; Wang et al. 2018). Species substitution, especially in meat products, frequently happens due to their high market value and better nutritional quality. Therefore, providing accurate labeling on food products and preventing unfair competition in the meat industry has become an important issue for authorities in this industry (Alamprese et al. 2013; Kamruzzaman et al. 2015).
Chicken is the most common type of consumed meat in the world due to the relative ease and low cost of raising them in comparison to other animals such as cattle or pig (He et al. 2003; Magdelaine et al. 2008; Vasconcelos et al. 2014). Therefore, admixture or substitution of a low-value substance like chicken instated of high-value beef in meat products to increase financial return is a potential adulteration matter. Compared to fresh meat, the chances of adulteration are higher in processed and comminuted meat products, because comminuting, processing and using other ingredients can mask the adulteration effects. This can put the consumers in immense disadvantage (Zhao et al. 2014; Al-Kahtani et al. 2017).
Several methods exist to determine animal species in fresh meat or meat products. They are mostly based on DNA and protein measurements including Immunological methods and PCR (Ballin et al. 2009; Al-Kahtani et al. 2017). All these methods are time-consuming and need advanced laboratory procedures. In recent years, vibrational spectroscopy instruments including Raman, NIR and FTIR spectroscopy coupled with chemometric tools, have been developed (Karoui et al. 2010; Nunes et al. 2016). Spectroscopic techniques and multivariate data analysis have clear advantages for investigating multiple objectives using food fingerprinting (Esslinger et al. 2014). Using FTIR spectroscopy in transmission and ATR mode for quantitative analysis of meat and meat products is rapid, low cost and need minimal or no sample preparation (Rohman et al. 2011). Recently, ATR-FTIR spectroscopy has been preferred over transmission FTIR spectroscopy in various fields. This substitution attributes to its non-destructiveness, ease of application, reduced required sample amount and rapid analysis time (Kendix et al. 2009). FTIR spectrometry has been used for the determination of pork in beef meatball formulation (Rohman et al. 2011). In another study, researchers could detect adulteration in fresh and frozen beef burger products by beef offal using mid-infrared ATR spectroscopy and multivariate data analysis (Zhao et al. 2014). Discrimination of pork content in mixtures with raw minced camel and buffalo meat has been also investigated (Lamyaa 2013). FTIR spectroscopy in combination with chemometrics was investigated for the analysis of rat meat in meatball formulation (Rahmania and Rohman 2015). These reports typically employ one type of FTIR mode (transmission or ATR). To the best of authors’ knowledge, no reported study compared ATR and transmission using mid-FTIR spectroscopy to evaluate their relative ability in meat and meat product determination, especially toward species.
The purpose of this study is appraising and comparing two FTIR approaches (transmission and ATR) accompanying compositional analysis including principal component analysis (PCA) to discriminate chicken and beef meats. In this work, fresh meat was used to compare these methods and discriminate these two meat types from each other.
Materials and methods
Samples preparation (classification)
Round cuts of beef (gluteal muscle) (7 samples for classification and 20 samples for quantification) and chicken thigh meat (7 samples for classification and 20 samples for quantification) each 150 g were purchased from different local butcheries. Each of the samples was purchased from a different butchery and the samples were collected on different dates. Samples were packed in the Freezer bag and transferred quickly to the laboratory right after the purchase to start the analysis. Therefore, the experiment was conducted on different days.
All the observable fatty parts, bone and connective tissues of the samples were removed. Each sample (100 gr) was minced and homogenized using a food processor for 2 min. The food processor was carefully cleaned with Extran 10% detergent for 1 min and distilled water and dried before each use. Firstly, 500 mg of homogenous meat was well mixed with 1.5 gr spectrophotometric-grade Potassium bromide (KBr) in an agate mortar and then dried using a vacuum pump for 150 min. After that, the mixture was mixed and grinded firmly and vigorously using a clean pestle for several minutes to prepare a fine powder. Finally, 80 mg of the powder was used to make a disc by a hydraulic press (for transmission mode) (three discs were prepared from each sample (7 × 3 = 21 total samples).). Additionally, 10 gr of homogenous meat from each sample was used for spectra acquisition using ATR-FTIR (three thine layer was prepared from each sample (7 × 3 = 21 total samples).
Preparation of mixed samples of chicken and beef for ATR approaches (quantification)
Samples were prepared by mixing minced round of beef and thigh of chicken at concentration ranges of 0, 20, 40, 60, 80 and 100% (w/w) beef meat in chicken meat. Samples were minced and mixed again until a homogeneous paste was prepared then, 10 gr of the homogenous and well-mixed mixture was dried as a thin layer in a petri dish using a vacuum pump for 60 min. Then, spectra were acquired using ATR-FTIR (The same sample preparation procedure was used to conduct ATR). A total of 90 data sets (reference data) have been produced as follows; fifteen repeats for each of six mixtures with the above percentages of beef have been analyzed. On the other hand, a set of 6 independent mixtures in five repeats (6 × 5 = 30) were prepared to be used as external validation (test data). Beef meat was considered as the control in this study. The same data set as described above has been used in ANN and PLS-R model.
FTIR spectra acquisition
IR spectra were obtained using FTIR spectrometer WQF-510 Fourier transform spectrometer (Rayleigh Optics, China) equipped with a DLaTGS (deuterated, l-alanine doped triglycine sulfate). In both ATR and transmission approaches, measurements were recorded in the wavelength range 4000–400 cm−1 with a resolution of 4 cm−1. In each run, 100 sample scans were recorded, and the background was also taken before each sample. In transmission analysis, KBr disc was placed into the sample holder, and the holder was placed in the FTIR spectrometer. Ten spectra were taken from each disc and the mean of them was used for further analysis. ATR crystal (Diamond MIRacle; PIKE Technologies, USA) was used for the reflectance mode. Dried samples were applied to completely cover the crystal surface and were pressed to the crystal using Pressure Clamp.
Spectral pre-processing and computational analysis
Raw obtained spectra were transformed to mat files using essential FTIR software version 3.00.019. Then, it was imported into MATLAB software, version 2014b, for multivariate operations. Pre-processing was carried out using Savitzki-Golay (SG) smoothing, standard normal variant (SNV), scatter correction (MSC) and Min–Max Normalization. Raw spectra and after pre-processing data analysis were performed by principal component analysis (PCA).
PLS-R model
PLS regression was selected as a standard regression method to compare with ANN. The optimum number of PLS components (after data preprocessing) was automatically determined by a leave-one-out cross-validation procedure. The five principal components (factors) were chosen for describing the PLS-R model.
ANN model
ANN is a supervised machine learning procedure system that maps input objects (a feature of spectra). It does not require any prior knowledge of the relationships between the variables to desired outputs (class assignments) (Torrecilla et al. 2004). We used back propagation (BP), the most commonly used training algorithm for neural networks, in the four-layered feed-forward networks in this study. Data were processed from the input layer to two hidden layers then to the output layer. The best performance of the network was obtained with 25 neurons in the first hidden layer and 15 neurons in the second hidden layer. Neural Network Toolbox of MATLAB software was used for the ANN model.
Evaluation and comparison of the chemometric quantification methods
Statistical indices were used for the evaluation and comparison of the PLS-R and ANN quantification methods. Internal cross-validation was performed on the same set of spectral data of standard mixtures that the calibration curve was obtained. The root mean squared error of cross-validation (RMSEcv) was calculated using the leave-one-out approach. To obtain a better calibration, values of RMSEcv and coefficient of determination (R2) were also used. External validation was performed using a different set of data (test data). The error of prediction RMSEp was calculated as the criterion for model validation and prediction accuracy.
Results and discussion
Visual analysis of the IR spectra
Figure 1a–c show all spectra of beef and chicken meat and also their average spectra in the wavenumber range from 4000 to 400 cm−1 in transmission mode. In the transmission approach, the sample pellet is placed in the path of the IR beam. It is known that no absorption bands should be present in the IR spectra of KBr crystals (Goriletsky et al. 2001). Although in normal transmission technique, it is very difficult to ensure the reproducibility, but as shown in Fig. 1a and b, the spectra have a good reproducibility especially in the wavenumber range 1800–800 cm−1. These visual observations were supported by decreasing inter-group variance in the PCA score plot, which was achieved by keeping the weight of sample meat and KBr constant in all runs and using very fine powder for the KBr plate (Grdadolnik 2002). Also, different proportions of the sample material in the disc may result in peak intensity alteration (Schrader 2008; Beasley et al. 2014). However, in agreement with Beasley and Gogna, in the case of using the ATR technique, our data also suggested that sample particle size does not significantly alter the spectra collected using the ATR technique (Beasley and Carmen 2009; Gogna and Goacher 2017).
Fig. 1.

Display of the total spectra of beef (a), chicken meat (b) and Simultaneous displays of the average spectra of beef and chicken meats (c) in the range of 4000 to 400 cm−1 (transmission mode)
Figure 2a–c, shows all infrared spectra of beef and chicken meat and their comparative averages in the range of 4000–400 cm−1 using ATR measurement, respectively. As shown in Fig. 2a the intensity of peaks is very low which makes visual inspection impossible. Thus, we normalized these spectra for better visualization as can be seen in Fig. 2b. The main advantage of ATR is that both qualitative and quantitative analysis can be conducted with no or minimum sample preparation requirement. Hence, in this study, we only performed a minimum sample preparation in the ATR technique compared to the transmission approach (Karoui et al. 2010). These reflectance techniques operate with different optical properties that do not require the traditional KBr pelleting preparation used for transmission FTIR spectroscopy (Grdadolnik 2002; Jelle et al. 2012; Beasley et al. 2014). One of the limitations in ATR measurement was that we had to ensure as the best possible optical contact between the sample and the lens using stable constant pressure to make good reproducibility. This experience has suggested that reproducibility is better achieved in transmission mode compared to ATR mode. Comparing Figs. 1 and 2, it shows that the average beef spectrum differs from the average spectrum of chicken meat in transmission mode. These differences are not seen in ATR mode.
Fig. 2.

Display of the total spectra of beef and chicken meat (a), overall spectra of beef and chicken meat after normalization (b) and Simultaneous displays of the average spectra of beef and chicken meat (c) in the range of 4000 to 400 cm−1 (ATR mode (ATR mode)
A comparison of average spectra for beef in transmission and ATR mode is shown in Fig. 3a. As presented in this figure, the peak intensity of the ATR spectra is very low. Hence, we normalized these spectra for better visualization. As can be seen in Fig. 3b, the results of ATR spectra were visually similar to the transmission spectra and the main IR absorbance bands presented in all spectra. The first region corresponding to 1350–1200 cm−1 which is presented in both mode of FTIR for the meats of beef and chicken shows a lot of overlapping vibrational modes. These are associated with the absorbance of macromolecules including amide III in proteins (1300–1180 cm−1) and asymmetric PO2- stretching of RNA and DNA in nucleic acids (1240–1220 cm−1). The second region from 1390 to 1355 cm−1 is related to the C–O stretching, C–H deformation, and N–H deformation. The third region of 1700–1600 cm−1 is due to the amide I band of proteins. The fourth region covers 3000–1600 cm−1, including bands at 2852, 2915, 2932 and 2956 cm−1 (due to lipid and protein, C-H stretching vibrations of methyl (CH3) and methylene (CH2) groups and olefins (Walsh et al. 2008; Baker et al. 2014; Ashtarinezhad et al. 2016). However, differences can be observed in this figure comparing ATR spectra to the transmission spectra, that here to be discussed. It is known that ATR spectra have band distortion and a shift of peak positions into lower frequencies in comparison to transmission technique which we also witnessed. Nevertheless, unlike other comparisons, it is not a problematic issue in this study, so ATR correction was not needed. The reason is our approach in spectrometry which was not required to be validated by comparing the sample’s peak position to a standard material in the transmission spectrum; we have only used computational analysis with and without preprocessing treatment procedure on IR spectra for clustering each group. The absorbance intensity has significantly increased in the transmission mode (Fig. 3). Of course, in a transmission measurement, all wavelengths pass the same total physical thickness of the sample, but in an ATR measurement, the penetration depth of the light is a subordinate of both the wavelength and the refractive index difference between the sample and the ATR crystal. So, the band intensities at different wavelengths will differ between a transmission measurement and an ATR measurement of the same substance. Nonetheless, the significance is dramatic here and is about 80 folds. Besides, the signal-to-noise (S/N) ratio is reduced in ATR mode (Fig. 3c). It should be noted that all spectra acquisition conditions like resolution and number of co-added spectra were the same in the two approaches. Furthermore, at the time of spectra acquisition using ATR, we observed that the S/N ratio versus the number of co-added spectra trend significantly increases, while the change was not perceptible in transmission mode. It is evident from the data presented here that transmission mode may be quite more sensitive and precise compared to ATR for biological samples spectroscopy including meats. Our results are in contradiction with the results of other researches since they have shown that the ATR approach is more sensitive and precise in comparison to the transmission mode (Kendix et al. 2009; Gogna and Goacher 2017). However, it should be noted that none of the previous comparisons were performed on meat.
Fig. 3.

Comparison of raw mean spectra of beef meat produced from transmission FTIR (KBr plate) and ATR (a), and their normalized spectra (b). Zoomed for particular regions of the spectra (c)
PCA analysis (classification)
PCA applied on raw spectra
In a second step, we processed FTIR spectroscopy data using principal component analysis (PCA) to develop a more efficient and reliable method for distinguishing similarities and differences among beef and chicken meat, as It is almost impossible to differentiate these spectra without chemometric methods (Yang and Irudayaraj 2001; Obeidat et al. 2017). PCA is an unsupervised clustering method to sort large data sets with shared distinguishing characteristics into groups. It is widely used for the classification of different samples (Yi et al. 2017; Jaiswal et al. 2018). At first, the raw spectra of both FTIR approaches were applied to PCA and compared to each other. Data matrices were constructed so that each row corresponded to a sample and each column represented the spectra datum at a given wavenumber. As demonstrated in Fig. 4a, the score plot of PC1 × PC3 provided no clear discrimination between beef and chicken samples. Of course, we checked all the important principle components (not shown) and the best selections are shown here. In contrast, a clear separation between beef and chicken meat can be observed in all the plots displayed in Fig. 4b. FTIR spectra of beef could be distinguished by the PCA score plot (PC1 × PC3) from chicken meat samples in the transmission approach. The first principal component (PC1) and the third principal component (PC3) describe 92% and 4% of the total variances, respectively. In the PCA interpretation, usually, every independent cluster contains samples with maximum spectral similarities reflecting the composition similarity. As shown in this figure, we have three small clusters in each group with a higher covariance compared to the main cluster. This may be because the meats in each species were provided from different butcheries and the analysis was performed on three different days. Although we decreased intra-group variances with methods used for increasing reproducibility in the laboratory as mentioned above, there might be yet some differences between KBr plates in each of the meat clusters. These differences might exist because we had three distinct KBr discs for each species meat sample which were purchased from various butcheries and prepared on different days. The differences are evident in wavenumber range 2500–2000 cm−1 (Fig. 1a and b). Based on these results, it can be concluded that PCA successfully clustered beef from chicken meat in transmission mode but failed such discrimination in ATR when applied to raw spectra acquired from each of these approaches. This can be because the spectra obtained from ATR mode had more noise and less intensity compared to transmission mode and also had a weaker reproducibility between spectra. These results illustrate that preprocessing treatment should be applied on each spectrum and the wavenumber regions should be optimized for getting better classifications using PCA in both approaches especially in ATR.
Fig. 4.

PCA score plot on raw spectra of chicken and beef meats: ATR (a), transmission (b) PCA score plot on pre-processed spectra of chicken and beef meats: ATR (c), transmission (d)
PCA applied on preprocessing spectra
1700–1071 cm−1 wavenumber regions, were chosen for PCA modeling in transmission and ATR approaches, respectively. In addition, the same preprocessing treatment methods were applied to both approaches as explained before. Figure 4c exhibits the PCA score plot (PC1 × PC3) of beef and chicken meat using ATR. The first principal component (PC1) and the third principle component (PC3) describe 72% and 4% of the total variance, respectively. In contrast with Fig. 4a, here, along with the PCA analysis, two well-separated clusters were observed. This suggests that prepossessing treatment and selecting a certain wavenumber region is critical for clustering. In Fig. 4d not only results were similar to Fig. 4b results, when PCA coupled preprocessing was applied on acquired spectra from transmission mode to cluster two meat species, but also dispersion in each cluster disappears and inter-group variance decreases. The contribution summations of the two PCs (PC1 × PC2) were 96%.
To obtain the best model, preprocessing treatment requires more than one step and the order of the steps is also important. Principally, due to the physical state of the samples, sample particle size, ways of acquisition and quantity of sample; the FTIR spectrum often contains systematic variations like elevated baseline and noise. The elevated baseline is a typical characteristic of the FTIR spectrum (Mark and Workman 2010). Slope (lifted at an inconsistent value slowly) and Curvature (lifted at an inconsistent value) are two models of baseline elevations that commonly occur in ATR, while Offset (lifted at a constant value) is less to happen in ATR but tends to occur in IR spectrum acquired using KBr disc. (Lee et al. 2017). Here we applied baseline correction on our spectra for both approaches but it didn’t effectively improve the results. Scattering is another undesirable FTIR spectrum variation resulted from intrinsic instrument restriction and sample particle size (Banadkoki et al. 2018). In this study to reduce scattering effect and remove both additive and multiplicative effects in the spectra, multiplicative scatter correction (MSC) and standard normal variant (SNV) transformations were applied on all spectra. In SNV, each spectrum is being centered and then scaled by the corresponding standard deviation (Bi et al. 2016). In our ATR study, it was difficult to ensure reproducibility by constant pressure on the sample using pressure clamp, however, applying SNV on ATR spectra enhanced the reproducibility. When applied on ATR spectra, a dramatic effect on clustering using PCA was achieved compared to the transmission mode. It is due to the signal to noise ratio reduction in the ATR approach. For this study, the best data pre-processing methods were recognized and utilized including Standard Normal Variate (SNV), Multiplicative Scatter Correction (MSC), Savitsky Golay filter and Min–Max normalization.
Quantification
The ATR approach was used for the quantification analysis because of a simpler sample preparation technique compared to the Transmission approach. In any case, as was shown in the classification section, both techniques can discriminate chicken meat from beef meat when PCA is applied to preprocessed spectra.
At first, PCA was applied on preprocessed ATR-FTIR acquired from pure chicken and beef meat also on binary mixtures of them containing 60% and 40% beef (Other percentages were not used to avoid plot crowding). As expected, in Fig. 5, the score plots corresponded to these mixtures located between pure chicken and beef meat cluster. Besides, while in the mixture percentage of beef is reduced and the percentage of chicken is increased the score plots of beef come closer to chicken score plots and conversely.
Fig. 5.
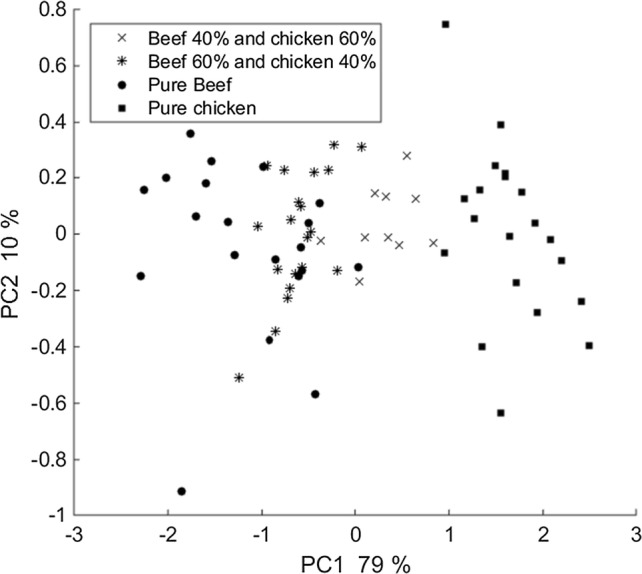
5 PCA score plot on pre-processed spectra of pure beef and chicken meat also two percentage of a binary mixture of them
Then, the quantification of chicken meat presence and percentage in beef meat was carried out using PLS-R and ANN models. The selection of the 1700-1071 cm−1 region was based on the optimization processes, which provides the highest values of R2 and the lowest values of error, either in calibration or in prediction models.
Table 1 shows the results of the internal and external validation of the PLS-R and ANN models. Fitted line plot formula are px = 2.6042 × 10 − 5 × 2 + 0.0101x + 0.0024 and px = 0.0075x + 0.0337 for ANN and PLS-R algorithms respectively.
Table 1.
PLS-R and ANN performance for the analysis of chicken meat in the beef meat mixture
| Model | R2 calibration | RMSEcv | RMSEp |
|---|---|---|---|
| PLS-R | 0.889 | 1.02 | 1.74 |
| ANN | 0.999 | 0.32 | 0.73 |
As demonstrated in the Table 1, in both models the performance of validation (RMSEp) is about twofold of RMSEcv. The variations between the calibration set used for the internal validation and the set used for the external validation are greater than those within the samples of the same set. Models built with both ANN and PLS-R using FTIR data demonstrated a high correlation value of R2 > 0.88 but, when the two regression models (ANN and PLS-R) were trained and tested using reference and test data set, better results were obtained from ANN compared to the PLS-R model (Table 1). ANN, demonstrated higher coefficient of determination (R2 = 0.999) and lower training and testing performance errors (RMSEcv = 0.32, RMSEp 0.73) in comparison with PLS-R model (R2 = 0.889, RMSEcv = 1.02 and RMSEp1.74).
This superiority of ANN might be due to its ability in modeling input variables with both linear and highly complex non-linear features. Thus, the nonlinear characteristic of ANN regression makes it a potentially powerful tool for the constructing of regression models for the quantification of chicken meat in a mixture with beef meat.
Conclusion
In this study ATR-FTIR spectroscopy and transmission FTIR spectroscopy in combination with Principal component analysis (PCA) was evaluated to investigate their ability in discriminating beef from chicken meat. PCA coupled with certain preprocessing could detect hidden relationships between variables in chicken and beef meat. Clear clustering among samples was achieved in both ATR and transmission approaches, particularly more with the transmission approach. Besides, the intensity of peaks and signal-to-noise (S/N) ratio were increased significantly in the transmission mode and good reproducibility was attained concerning spectra in transmission mode. PCA can completely cluster beef from chicken meat when applied without any preprocessing treatment on the whole spectra, while the ATR approach fails in this application. Thereupon, the transmission FTIR technique (KBr plate) appears to be preferable to ART-FTIR when PCA is applied to the biological samples’ raw spectra. For quantification analysis, the application of ANN improved the regression models to greater values of R2, RMSEcv and RMSEp compared to PLS-R because of its ability to model data on a non-linear base.
Acknowledgements
Authors wish to express their appreciation from the Pharmaceutical Sciences Research Center and SBMU for their support of this work.
Compliance with ethical standards
Conflict of interest
The authors declare that there is no conflict of interest.
Footnotes
Publisher's Note
Springer Nature remains neutral with regard to jurisdictional claims in published maps and institutional affiliations.
References
- Alamprese C, Casale M, Sinelli N, Lanteri S, Casiraghi E. Detection of minced beef adulteration with turkey meat by UV–vis, NIR and MIR spectroscopy. LWT Food Sci Technol. 2013;53(1):225–232. doi: 10.1016/j.lwt.2013.01.027. [DOI] [Google Scholar]
- Al-Kahtani HA, Ismail EA, Ahmed MA. Pork detection in binary meat mixtures and some commercial food products using conventional and real-time PCR techniques. Food Chem. 2017;219:54–60. doi: 10.1016/j.foodchem.2016.09.108. [DOI] [PubMed] [Google Scholar]
- Ashtarinezhad A, Panahyab A, Shaterzadeh-Oskouei S, Khoshniat H, Mohamadzadehasl B, Shirazi FH. Teratogenic study of phenobarbital and levamisole on mouse fetus liver tissue using biospectroscopy. J Pharm Biomed Anal. 2016;128:174–183. doi: 10.1016/j.jpba.2016.05.015. [DOI] [PubMed] [Google Scholar]
- Baker MJ, Trevisan J, Bassan P, Bhargava R, Butler HJ, Dorling KM, Fielden PR, Fogarty SW, Fullwood NJ, Heys KA. Using Fourier transform IR spectroscopy to analyze biological materials. Nat Protoc. 2014;9(8):1771–1791. doi: 10.1038/nprot.2014.110. [DOI] [PMC free article] [PubMed] [Google Scholar]
- Ballin NZ, Vogensen FK, Karlsson AH. Species determination–can we detect and quantify meat adulteration? Meat Sci. 2009;83(2):165–174. doi: 10.1016/j.meatsci.2009.06.003. [DOI] [PubMed] [Google Scholar]
- Banadkoki SB, Azar FT, Shirazi FH. Estimation and reduction of resonant mie scattering (RMieS) from IR spectra of biological cells by optimization algorithm. J Med Biol Eng. 2018;39(3):431–441. doi: 10.1007/s40846-018-0423-9. [DOI] [Google Scholar]
- Beasley M, Carmen C. Evaluating diagenetic alterations affecting stable isotopes in bone using C/P and CI values: a comparison of four sample preparation methods for FTIR analysis. Am J Phys Anthropol. 2009;138(s48):87. [Google Scholar]
- Beasley MM, Bartelink EJ, Taylor L, Miller RM. Comparison of transmission FTIR, ATR, and DRIFT spectra: implications for assessment of bone bioapatite diagenesis. J Archaeol Sci. 2014;46:16–22. doi: 10.1016/j.jas.2014.03.008. [DOI] [Google Scholar]
- Bi Y, Yuan K, Xiao W, Wu J, Shi C, Xia J, Chu G, Zhang G, Zhou G. A local pre-processing method for near-infrared spectra, combined with spectral segmentation and standard normal variate transformation. Analytica chimica acta. 2016;909:30–40. doi: 10.1016/j.aca.2016.01.010. [DOI] [PubMed] [Google Scholar]
- Esslinger S, Riedl J, Fauhl-Hassek C. Potential and limitations of non-targeted fingerprinting for authentication of food in official control. Food Res Int. 2014;60:189–204. doi: 10.1016/j.foodres.2013.10.015. [DOI] [Google Scholar]
- Gogna M, Goacher RE. Comparison of three Fourier transform infrared spectroscopy sampling techniques for distinction between lignocellulose samples. BioResources. 2017;13(1):846–860. doi: 10.15376/biores.13.1.846-860. [DOI] [Google Scholar]
- Goriletsky V, Mitichkin A, Belenko L, Rebrova T (2001) IR spectroscopy of KBr salt and crystals. Semicond Phys Quantum Electron Optoelectron
- Grdadolnik J. ATR-FTIR spectroscopy: its advantage and limitations. Acta Chim Slov. 2002;49(3):631–642. [Google Scholar]
- He S, Fletcher S, Rimal A. Identifying factors influencing beef, poultry, and seafood consumption. J Food Distrib Res. 2003;34(1):50–55. [Google Scholar]
- Jaiswal P, Jha SN, Kaur J, Borah A, Ramya H. Detection of aflatoxin M1 in milk using spectroscopy and multivariate analyses. Food Chem. 2018;238:209–214. doi: 10.1016/j.foodchem.2016.07.150. [DOI] [PubMed] [Google Scholar]
- Jelle BP, Nilsen T-N, Hovde PJ, Gustavsen A. Accelerated climate aging of building materials and their characterization by Fourier transform infrared radiation analysis. J Build Phys. 2012;36(1):99–112. doi: 10.1177/1744259111423367. [DOI] [Google Scholar]
- Kamruzzaman M, Makino Y, Oshita S, Liu S. Assessment of visible near-infrared hyperspectral imaging as a tool for detection of horsemeat adulteration in minced beef. Food Bioprocess Technol. 2015;8(5):1054–1062. doi: 10.1007/s11947-015-1470-7. [DOI] [Google Scholar]
- Karoui R, Downey G, Blecker C. Mid-infrared spectroscopy coupled with chemometrics: a tool for the analysis of intact food systems and the exploration of their molecular structure—quality relationships—a review. Chem Rev. 2010;110(10):6144–6168. doi: 10.1021/cr100090k. [DOI] [PubMed] [Google Scholar]
- Kendix EL, Prati S, Joseph E, Sciutto G, Mazzeo R. ATR and transmission analysis of pigments by means of far infrared spectroscopy. Anal Bioanal Chem. 2009;394(4):1023–1032. doi: 10.1007/s00216-009-2691-2. [DOI] [PubMed] [Google Scholar]
- Lamyaa M. Discrimination of pork content in mixtures with raw minced camel and buffalo meat using FTIR spectroscopic technique. Int Food Res J. 2013;20(3):1389. [Google Scholar]
- Lee LC, Liong C-Y, Jemain AA. A contemporary review on Data Preprocessing (DP) practice strategy in ATR-FTIR spectrum. Chemometr Intell Lab Syst. 2017;163:64–75. doi: 10.1016/j.chemolab.2017.02.008. [DOI] [Google Scholar]
- Magdelaine P, Spiess M, Valceschini E. Poultry meat consumption trends in Europe. World’s Poult Sci J. 2008;64(1):53–64. doi: 10.1017/S0043933907001717. [DOI] [Google Scholar]
- Mark H, J Workman Jr (2010) Chemometrics in spectroscopy. Elsevier
- Moreira MJP, Silva A, Saraiva C, Marques Martins de Almeida JM. Prediction of adulteration of game meat using FTIR and chemometrics. Nutr Food Sci. 2018;48(2):245–258. doi: 10.1108/NFS-08-2017-0164. [DOI] [Google Scholar]
- Nunes KM, Andrade MVO, Santos Filho AM, Lasmar MC, Sena MM. Detection and characterisation of frauds in bovine meat in natura by non-meat ingredient additions using data fusion of chemical parameters and ATR-FTIR spectroscopy. Food Chem. 2016;205:14–22. doi: 10.1016/j.foodchem.2016.02.158. [DOI] [PubMed] [Google Scholar]
- Obeidat S, Hammoudeh A, Alomary A. Application of FTIR spectroscopy for assessment of green coffee beans according to their origin. Жypнaл пpиклaднoй cпeктpocкoпии. 2017;84(6):977–981. [Google Scholar]
- Rahmania H, Rohman A. The employment of FTIR spectroscopy in combination with chemometrics for analysis of rat meat in meatball formulation. Meat Sci. 2015;100:301–305. doi: 10.1016/j.meatsci.2014.10.028. [DOI] [PubMed] [Google Scholar]
- Rohman A, Erwanto Y, Man YBC. Analysis of pork adulteration in beef meatball using Fourier transform infrared (FTIR) spectroscopy. Meat Sci. 2011;88(1):91–95. doi: 10.1016/j.meatsci.2010.12.007. [DOI] [PubMed] [Google Scholar]
- Schrader B. Infrared and Raman spectroscopy: methods and applications. Hoboken: Wiley; 2008. [Google Scholar]
- Torrecilla JS, Otero L, Sanz P. A neural network approach for thermal/pressure food processing. J Food Eng. 2004;62(1):89–95. doi: 10.1016/S0260-8774(03)00174-2. [DOI] [Google Scholar]
- Vasconcelos H, Saraiva C, de Almeida JM. Evaluation of the spoilage of raw chicken breast fillets using Fourier transform infrared spectroscopy in tandem with chemometrics. Food Bioprocess Technol. 2014;7(8):2330–2341. [Google Scholar]
- Walsh MJ, Singh MN, Stringfellow HF, Pollock HM, Hammiche A, Grude O, Fullwood NJ, Pitt MA, Martin-Hirsch PL, Martin FL. FTIR microspectroscopy coupled with two-class discrimination segregates markers responsible for inter-and intra-category variance in exfoliative cervical cytology. Biomarker Insights. 2008;3:179. doi: 10.4137/BMI.S592. [DOI] [PMC free article] [PubMed] [Google Scholar]
- Wang W, Peng Y, Sun H, Zheng X, Wei W. Spectral detection techniques for non-destructively monitoring the quality, safety, and classification of fresh red meat. Food Anal Methods. 2018;11(10):2707–2730. doi: 10.1007/s12161-018-1256-4. [DOI] [Google Scholar]
- Yang H, Irudayaraj J. Characterization of beef and pork using Fourier-transform infrared photoacoustic spectroscopy. LWT Food Sci Technol. 2001;34(6):402–409. doi: 10.1006/fstl.2001.0778. [DOI] [Google Scholar]
- Yi S, Lai Z, He Z, Cheung Y-M, Liu Y. Joint sparse principal component analysis. Pattern Recogn. 2017;61:524–536. doi: 10.1016/j.patcog.2016.08.025. [DOI] [Google Scholar]
- Zhao M, Downey G, O’Donnell CP. Detection of adulteration in fresh and frozen beefburger products by beef offal using mid-infrared ATR spectroscopy and multivariate data analysis. Meat Sci. 2014;96(2):1003–1011. doi: 10.1016/j.meatsci.2013.10.015. [DOI] [PubMed] [Google Scholar]