

Abstract
South-East Asian countries produce several million tons annually of Tra catfish (Pangasius hypophthalmus) fillets for export and domestic consumption. However, the processing procedure has not yet been investigated. This study was carried out to analyze the rigor mortis development of the fish and to evaluate the effects of filleting conditions on the quality of the fillets. Compared to pre-rigor fillet processing, post-rigor fillet processing resulted in higher fillet mass yield, less fillet length contraction and reduced exudation loss during chilled storage for both fillets before freezing and fillets after freezing and thawing. The post-rigor fillet processing led to significantly less drip loss after thawing. For fresh fish fillets, pre-rigor processing led to lower cooking loss compared to post-rigor processing. For frozen and thawed fish fillets there was no significant difference in those two parameters. The present research serves as a foundation for further investigations on the modification of processing practices for better fillet quality.
Keywords: Pangasius hypophthalmus, Tra catfish, Pre-rigor, Post-rigor, Rigor-mortis, Fillets, Cooking loss
Introduction
Post-mortem factors such as glycolysis, pH, and rigor mortis have been shown to have profound effects on fish fillet texture (Dunajski 1980). Rigor mortis is a phenomenon where the fish, after death, becomes stiff. The mechanism behind this is muscle contraction due to shortage of ATP (adenosine triphosphate). The rigor will get completed when almost all muscle fibers are contracted which lasts a while before it is resolved. The muscle then becomes more and more tender in the stage called meat tenderization. Rigor mortis is dependent on the fish species, temperature and handling before slaughter, slaughtering stress, the biological status of the fish and temperature of pre-rigor storage. Even when fishes are killed under the same conditions, there can be a high variation in the time of onset of rigor mortis (Sorensen et al. 1997). The time from death to the onset of rigor mortis under ice storage is 26–36 h for farmed cod (Bjornevik and Solbakken 2010), 45–54 h for rainbow trout, (Ostenfeld et al. 1995), and 12–36 h for Atlantic salmon but could be as low as 2 h when pre-slaughter stress was present or when electrical stimulation was applied on the carcasses (Roth et al. 2006). For Tra catfish, the most economically significant fresh water fish in several south-east Asian countries, information on development of rigor mortis is still lacking.
Research on salmon and cod pointed out that filleting time (before or after rigor mortis) can influence subsequent fillet quality (lightness, pH, drip loss, texture, gapping) (Bjornevik and Solbakken 2010; Digre et al. 2011; Roth et al. 2006, 2007, 2009). This effect levelled off during ice storage of the fillets (Bjornevik and Solbakken 2010; Skjervold et al. 2001a). Tra catfish processing differs in that a major part of fillets are frozen for exportation and a smaller part is sold fresh or iced. Because of this, the quality of fillets after thawing becomes critical.
The processing practices may influence both fresh fillets as well as frozen fillets after thawing. For salmon, the quality of fillets prepared pre-rigor was different from that of fillets prepared post-rigor, especially in appearance, color, shape, texture and technological properties such as salt uptake (Sorensen et al. 1997). Freezing pre-rigor fillets seemed to result in lower firmness and higher gapping after thawing (Einen et al. 2002) while post-rigor processing may have seemed to increase the fillet yield (Bosworth et al. 2006). Currently, the processing companies of Tra catfish, e.g., in Vietnam, do not pay enough attention to the pre-rigor/post-rigor issue. Filleting is done pre-, on-, or post-rigor, depending mostly on processing arrangement, labor availability, and quantity of fish input.
In brief, there are different factors, either pre-slaughter or during processing, that influence the quality of fish fillets. An understanding of these factors is still lacking for Tra catfish and there is, most probably, a real need to improve/optimize the processing procedures. The results from such research can be expected to have a significant economic impact since thousands of tons of Tra catfish are produced every day. Tra catfish fillets are normally frozen and the consumers thaw them before cooking. The fillet quality is likely to change to some extent after freezing. Therefore, it is important to measure the fillet quality both before and after freezing/thawing. Fillet quality (i.e. physicochemical quality in this study) is determined by parameters such as pH, color, cooking loss, and drip loss.
This research focused on two main objectives: (1) to determine the development of rigor mortis of Tra catfish, and (2) to investigate the effect of filleting time (namely, pre-rigor and post-rigor on the quality of fillets, before freezing (after filleting) and after freezing and thawing.
Materials and methods
Fish
The fishes used in the experiments were raised for industrial processing. Tra catfish harvested from farms in Dong Thap province and Tien Giang province were transported alive to the laboratory where the fish were rested before slaughter (Harmon 2009; Bjorn Roth et al. 2009). An air pump was used to gently and continuously bubble air into the water to maintain the viability of fish during its 2 h transport and 5 h resting. The age of fish at the time of harvest was the same as that for industrial harvesting. The weight of fish was 1069 ± 170 g and the standard length was 42.9 ± 2.12 cm (from the far most point of the jaw to the hypural notch).
Experimental processing of fish
The procedure for experimental processing of fish is presented in Fig. 1.
Fig. 1.

Experimental processing and analysis
For pre-rigor filleting (so-called processing), the fish was submerged for 20 min in water at room temperature and immediately filleted without delay. Two fillets were obtained from each fish, labelled as F1 and F2, respectively. F1 fillets were used for measurements, as described in Fig. 1 while F2 fillets were fast frozen for 20 min using broken pieces of dry ice (or solid CO2) in a styro-foam box and stored at − 18 °C in a plastic bag for 5 days and nights. After which, the fillets were thawed for 1 h in running water, (with the fillets still in plastic bags) before analysis. For post-rigor processing, the fishes were chilled and stored at 2 °C (MGM 10502F chilling chamber, Zanotti S.P.A, Italy) for 24 h (based on the results of rigor index measurement) after bleeding to let rigor-mortis elapse before it was processed further and measured according to Fig. 1.
Experiments
Measurement of post-mortem rigor index
This experiment was carried out to determine the range of time from death to the onset and to resolution of rigor for Tra catfish. The processing procedure for measuring rigor index is shown in Fig. 1. The Cuttingers method (tail drop), developed by Bito et al. (1983), was used. The rigor index (Ir) was calculated using the following formula:
| 1 |
L represents the vertical drop (cm) of the tail, when half of the fish fork length is placed on the edge of a table. L0 is the tail drop at the beginning of the experiment, while Lt represents measurements throughout the experiment. The measurement was performed during storage in a chilling chamber (MGM 10502F chilling chamber, Zanotti S.P.A, Italy) at 15 °C for 25 fishes and 2 °C for 20 fishes. A plastic cover was used to prevent evaporation of water from the fish.
Effects of filleting conditions on filleting yield
The weight and standard length of each fish and its resulting F1 and F2 fillets were recorded at each stage of processing (Fig. 1). F1 fillets were destructively measured after filleting while F2 fillets were further frozen and thawed so the filleting yield for F2 fillets could be calculated up to the post-thawing step. The filleting mass yield (in %) was determined by the ratio of fillet weight to weight of the live fish before processing. The filleting length yield (in %) was determined by the ratio of fillet length to the (original) length of the fish before processing.
Effects of pre-rigor and post-rigor processing on fillet contraction and weight loss during chilled storage
The objective of this experiment was to determine the contraction and weight loss (exudation loss) of pre-rigor processed and post-rigor processed fillets during chilled storage. Fifteen live fishes were pre-rigor processed and another 15 fishes were post-rigor processed following the procedure in Fig. 1. Two fillets were also obtained from each fish, labelled as F1 and F2 respectively. The F1 fillets were measured in length and weight during 5 days of storage at 2 °C. The F2 fillets were fast frozen and stored for 5 days at − 18 °C before thawing in running water (fillets in plastic bag). The drip loss was removed and recorded before the fillet was brought into chilled storage for fillet contraction and weight loss determination.
Effects of pre-rigor and post-rigor processing on fillet quality
The fishes were divided into two batches of 20 fishes per batch, one batch for pre-rigor processing and one for post-rigor processing, as explained in Fig. 1. For each batch, 20 F1 fillets were analyzed for filleting yield, texture, pH, drip loss, and cooking loss while color was measured for the 20 F2 fillets. The F2 fillets were then fast frozen and stored for 5 days before thawing. The drip loss of the whole fillet after thawing was recorded and color was read before the thawed fillet was subjected to similar measurements as for the F1 fillets. Analysis of each of these quality parameters are explained in the subsequent subsections.
Analysis
Color
Color was measured (using a Konica Minolta color reader) at four positions (on four quarters of the fillet) as shown in Fig. 2. Two readings were performed at each position, and the average values were taken. The measurements were carried out on the fillets before freezing and after freezing/thawing. The measurement at position 2 had smaller variation and was selected for reporting. The color data were presented in L, a, and b values where L represents brightness, negative a values represent blue color while positive a values indicate red color, and b ranges from negative values, representing green color, to positive values representing yellow color.
Fig. 2.
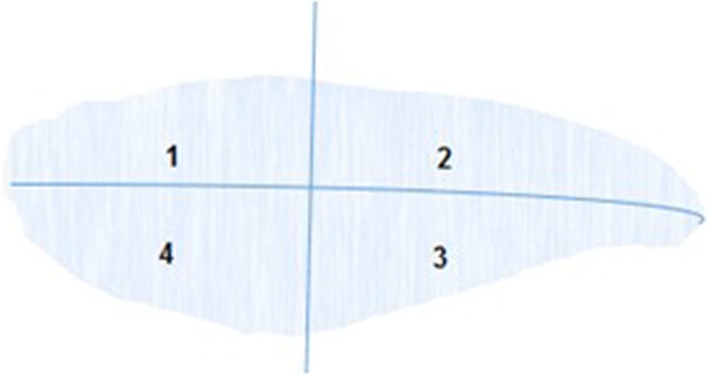
Four positions for color measurement
Texture
Texture profile analysis (TPA) was performed using Zwick/Roell Z1.0 texture analyzer (Zwick USA, 30,144 Kennesaw, GA, USA) with the use of a Φ15 mm spherical cylinder probe at three selected positions (from survey of 7 different positions) as shown in Fig. 3. The strain was set at 40% of the fillet height at the measurement position and the movement speed of the probe was 30 mm/min. Firmness (F1, maximum force of the first penetration), F2 (maximum force of the second penetration), springiness, cohesiveness, gumminess, and chewiness were recorded.
Fig. 3.
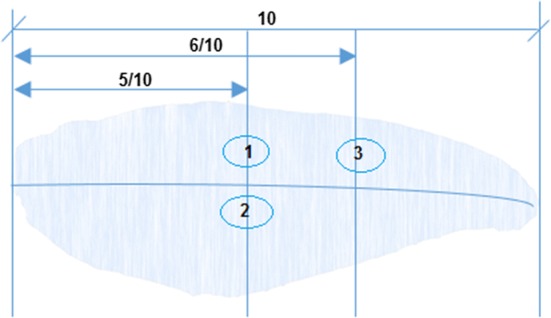
Three positions for texture measurement to investigate the effects of pre-rigor and post-rigor processing
pH
After measuring texture, the fillet was divided into four portions from neck to tail for measurement of pH, drip loss, and cooking loss, respectively, as shown in Fig. 4 (the measurement of WHC (water holding capacity) is not reported because it had the same trend as the cooking loss). All measurements were carried out in duplicates and average values were taken. Twenty grams of sample was ground using a HCB—150B blinder (Pt, Mitra Citra Makmur, Indonesia) and homogenized with two parts (on weight basis) of distilled water before pH was read using a pH meter.
Fig. 4.
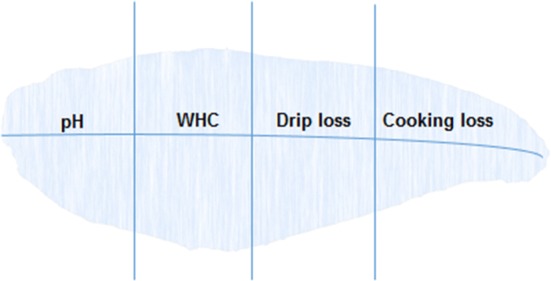
Portions of fillet for quality measurements
Drip loss
Drip loss, the liquid loss upon thawing, was measured with a portion of a fillet (Fig. 4) and with whole fillet after freezing, frozen storage and thawing. Drip loss was expressed as percentage of weight loss after thawing. For the first case, the portion was slightly vacuum packed, and fast frozen using dry ice and stored at − 18 °C for 5 days before thawing. The drip was removed, and the remaining sample was weighed to determine the loss. Drip loss of whole fillets was measured with F2 fillets (Fig. 1). The fillets were frozen and stored in plastic bags. They were thawed in running water (fillets are inside the plastic bags) for 1 h. The drip was removed, and the thawed fillet was weighed to determine the loss.
Cooking loss
Cooking loss, the loss of liquid due to cooking, was analyzed according to Skipnes et al. (2007) with some modifications. The portion for cooking loss measurement (Fig. 4) was slightly vacuum packed and cooked at 90 °C using an autoclave for 20 min. The pack was cooled in running water for 10 min. The sample was unpacked and the liquid released was removed before the remaining weight of the sample was recorded. Cooking loss was expressed as percentage of the liquid released after cooking against the initial sample weight.
Statistical analysis
Statistical analysis was performed using Statgraphics Centurion, Version 15.1.02. The difference was considered significant if p value was below or equal to 0.05. The tests used were two-sample t test to compare two samples together while ANOVA analysis was used to compare several samples.
Results and discussion
Post-mortem rigor index
The results of evolution in the rigor index according to the Cuttingers method are shown in Fig. 5.
Fig. 5.

Rigor index evolution of 25 fishes stored at 15 °C (above) and of 20 fishes stored at 2 °C (below)
At 15 °C, a major part of the fish started to rigor quickly after filleting since the measurement at 30 min of storage already detected the increase in rigor index (Fig. 5). For some fishes, the index remained 0 after 30 min and even until 1 h for several other fishes. It is known that the onset of rigor-mortis in exhausted and stressed animals takes place in a shorter time due to the low pre-mortem concentration of glycogen in the muscle (Bjornevik and Solbakken 2010; Roth et al. 2009). The time to reach maximum index varied strongly from 2.5 to 7.0 h (or 4.26 ± 1.39 h) among the 25 fishes. The fish remained at the highest rigor index for 3–10.5 h (6.68 ± 1.95 h) before the resolution of rigor occurred. Variation in these parameters were also observed in salmon (Roth et al. 2006). This could be due to the natural biological variation of fish individuals. Large fish-to-fish variation was also reported in the work of Sorensen et al. (1997) for salmon.
For the storage at 2 °C, the index of all 20 fishes were high for the first measurement at 30 min (Fig. 5). This was much shorter than 4 h, the time of onset of rigor for stressed Atlantic salmon during storage on ice (Roth et al. 2006). The duration to reach maximum index varied from 3.5 to 5 h (4.15 ± 0.54 h). The variation in this time was not as high as that measured at 15 °C. The time the fish remained at the highest rigor index before resolution ranged from 15.5 to 30 h (20.53 ± 4.28 h). The drop of the index at 2 °C was slower compared to that at 15 °C (Fig. 5). At 2 °C, the rigor started to resolve at 24.68 ± 4.01 h. In cod which had been stressed pre-slaughter using hypoxia post-mortem storage on ice, the time to maintain maximum rigor ranged from 26 to 36 h (Bjornevik and Solbakken 2010). For pre-slaughter rested salmon, the fish reached maximum rigor after about 48 h (Roth et al. 2006).
Generally, at 2 °C the increase in firmness of the muscle occurred faster and remained for longer time before the fish began softening, compared to the storage at 15 °C. Theoretically, post-mortem biochemical changes occur faster at higher storage temperatures, and the onset of rigor mortis should occur faster. As observed in rainbow trout, the contraction at 4 °C was slower and smoother than that at 20 °C (Stien et al. 2006). Similar results were obtained with Atlantic salmon (Sorensen et al. 1997). Our results showed that the increase in rigor index was faster for storage at 2 °C. This was likely due to the solidification of lipids in the body of the fish and this added to the firmness build-up. Tra catfish fat has a quite high ratio of saturated fatty acids at 32–41% (Hashim et al. 2015; Karl et al. 2014). Because of the slower biochemical changes and the crystallization of lipids, the firmness of fish was maintained for a longer time.
For storage at 15 °C, the rigor started to resolve at around 11 h (Fig. 5). This indicates that to carry out post-mortem filleting, when needed, the fish should be stored at this temperature for about 11 h. This would be not practical in commercial processing since microbial growth may spoil the fish at this temperature. At 2 °C, the waiting time to carry out post-mortem processing would be longer, about 24 h. This would cost more energy for storage and become more labor intensive. To carry out post-mortem processing, a method should be developed to shorten the rigor period.
Filleting yield
The results of filleting yield are given in Table 1. The filleting mass yield, considering both F1 and F2 fillets, of pre-rigor processing was 42.8 ± 2.69% while that of post-rigor processing was 45.9 ± 1.89%. This indicates that post-rigor filleting results in about 3% higher yield. After chilled storage, allowing rigor mortis to elapse, the fish became firmer (at lower temperature) and filleting became easier. This could be the reason why the post-rigor processing resulted in higher mass yield and length yield after filleting (Table 1). When it was easier to fillet, less flesh remained attached to the bones. This trend was not observed in Atlantic salmon in the work of Skjervold et al. (2001a, b). They did not find significant difference in filleting yield between pre-rigor (2 h after killing) and post-rigor (5 days after killing) processed fillets.
Table 1.
Filleting yield following pre-rigor and post-rigor processing
| Processing | After filleting | After freezing and thawing | |||||
|---|---|---|---|---|---|---|---|
| F1 mass yield | F1 length yield | F2 mass yield | F2 length yield | F1&F2 mass yield | F2 mass yield | F2 length yield | |
| Pre-rigor | 21.8 ± 1.14 | 70.3 ± 1.98 | 21 ± 1.68 | 70.5 ± 2.47 | 42.8 ± 2.69 | 19.6 ± 1.87 | 57.4 ± 6.01 |
| Post-rigor | 22.9 ± 1.16 | 71.5 ± 1.58 | 23 ± 1.15 | 71.8 ± 1.52 | 45.9 ± 1.89 | 22.7 ± 1.14 | 71.6 ± 1.53 |
Difference in values in all columns are significant
It was interesting to observe that after freezing and thawing, the pre-rigor processed fillets contracted intensively and that the yield in length of these fillets went down from 70.5 ± 2.47% after filleting to 57.4 ± 6.01% after freezing and thawing (Table 1). In contrast, the post-rigor processed fillets did not contract. Rigor mortis occurred during chilled storage, and since the flesh was still connected to the bone, muscle length shrinkage was prevented. While for pre-rigor processing, the freezing was performed before rigor mortis and the muscle contraction occurred during thawing, which shrank the muscle.
Fillet contraction and weight loss during chilled storage
The length contraction and weight reduction during storage of fillets at 2 °C are presented in Fig. 6.
Fig. 6.
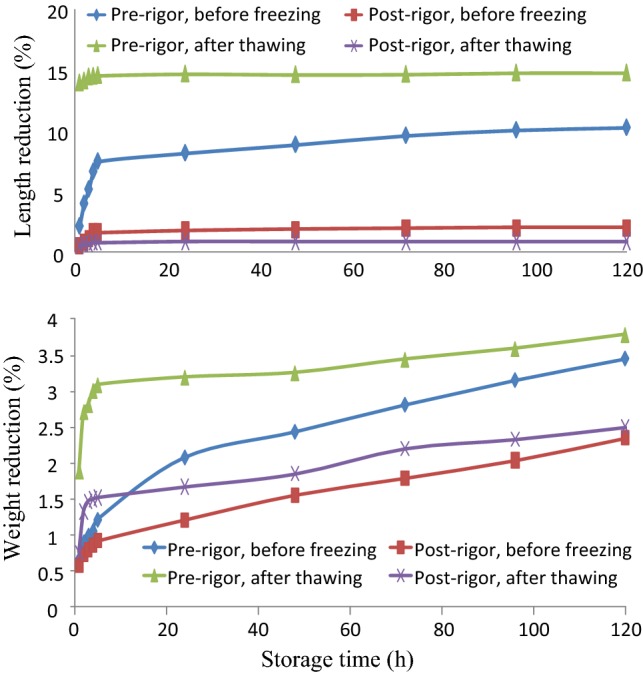
Fillet length reduction (above) and weight reduction (below) during chilled storage time at 2 °C
The figure shows that for both before and after freezing/thawing, the pre-rigor processed fillets had a significantly larger reduction in weight and length during chilled storage. For post-rigor processed fillets, the reduction in length was 1.98 ± 0.95% and 0.86 ± 0.704% before freezing and after freezing/thawing| respectively, after 120 h of chilled storage. The two numbers were not significantly different while pre-rigor processed fillets reduced by10.27 ± 1.69% and 14.80 ± 3.40%, respectively (Fig. 6). The difference was noticeable and could have important economic significance.
The same trend was observed for weight reduction (due to exudation). The weight loss during chilled storage of post-rigor processed fillets was significantly lower than that of the pre-rigor processed fillets, for both fillets before freezing and after freezing/thawing (Fig. 6). This difference in weight can be considered highly economically significant because a Tra fish processing company processes about a hundred tons of fish a day.
The contraction occurred mostly within the first five hours of chilled storage (Fig. 6), due to the rigor-mortis phenomenon while weight reduction occurred quickly within the first five hours and continued throughout the storage period. Illustration of length reduction of pre-rigor fillet can be seen in Fig. 7a, b. The length reduction in farmed Atlantic cod fillets during chilled storage could reach to 30% of the original length, and the weight reduction could be up to 5% (Aune et al. 2014). Another work on the same fish species reported that the weight loss during chilled storage of pre-rigor processed fillets was around double compared to that of post-rigor processed fillets (Kristoffersen et al. 2007). Unlike salmon fillets, no gapping was observed in Tra catfish fillets, both from pre-rigor and post-rigor processing, during chilled storage, either before freezing or after freezing and thawing.
Fig. 7.

Images of pre- and post-rigor processed fillets before and after freezing/thawing
Effects of pre-rigor and post-rigor processing on fillet quality
Effects on color
Results of color measurements at position 2 are presented in Table 2. Generally, the post-rigor processed fillets were brighter (higher L values), less of red color (lower a values) and more of yellow color (higher b values) (Table 2). These results agreed with image observation (Fig. 7). In the research of Roth et al. (2009), post-rigor fillets of Atlantic salmon also had higher lightness compared to the pre-rigor fillets. After freezing and thawing, for both pre- and post-rigor processed fillets, the color tended to become lighter, less red and more yellow (Table 2).
Table 2.
Color parameters at position 2 of pre-rigor and post-rigor processed fillets
| Processing stage | Parameter | Pre-rigor fillets | Post-rigor fillets |
|---|---|---|---|
| Before freezing | L | 46.38a1 ± 2.70 | 51.17b1 ± 2.66 |
| a | 1.40a1 ± 1.34 | 1.03a1 ± 0.98 | |
| b | − 0.55a1 ± 1.22 | 0.37b1 ± 0.81 | |
| ΔE | 46.40 | 51.18 | |
| After freezing/thawing | L | 48.80a2 ± 2.73 | 52.04b1 ± 2.47 |
| a | 0.85a1 ± 1.12 | 0.80a1 ± 1.00 | |
| b | 0.05a1 ± 1.12 | 1.31b2 ± 0.78 | |
| ΔE | 48.81 | 52.06 |
Values in the same row that do not share a common superscript differ significantly. Values in the same column that do not share a common subscript number differ significantly
Figure 7 shows that the pre-rigor fillets before freezing had patches of red spots due to the residual blood in the muscle while the fillets obtained post-rigor mortis were more uniform in color. The uniform color was maintained during freezing, frozen storage and after thawing (Fig. 7). The post-rigor processed fillets still looked smooth after thawing while the surface of pre-rigor processed fillets became rough due to contraction and water loss (Fig. 7b, d).
Effects on texture
Figure 8 illustrates the difference in texture profiles of pre- and post-rigor processed fillets before freezing and after freezing and thawing.
Fig. 8.

Texture profile at position 2 of pre-rigor and post-rigor processed fillets measured at two processing steps—before freezing and after freezing/thawing
Figure 8a shows that pre-rigor fillets tended to become firmer after freezing and thawing. This was logical since, for these fillets, the rigor (muscle contraction) occurred after thawing and this increased the firmness of the sample. The muscle was more influenced/damaged by the texture measurement (compression) when it was contracted and that the springiness reduced after freezing and thawing.
An opposite trend was observed with post-rigor processed fillets. The firmness tended to reduce after freezing and thawing while springiness did not differ considerably (Fig. 8b). For post-rigor processing, the rigor mortis has occurred before the fillets were frozen. Ice crystal formation during freezing could cause some mechanical damage to the texture of the muscle and this could be the reason for the muscle becoming softer.
When comparing the texture before freezing (Fig. 8c), post-rigor processed fillets were firmer but had significantly lower springiness. The post-rigor fillets at this step were apparently at the end of the rigor-mortis phase (see Fig. 5) so the firmness was high. The springiness was lower since at the contracted status, the muscle would break more upon the first cycle (compression) of the texture profile analysis (Table 3).
Table 3.
pH of pre- and post-rigor processed fillets before freezing and after freezing/thawing
| Pre-rigor processed fillets | Post-rigor processed fillets | |
|---|---|---|
| Before freezing | 6.71a1 ± 0.18 | 6.60b1 ± 0.14 |
| After freezing and thawing | 6.65a1 ± 0.14 | 6.61a1 ± 0.12 |
Values in the same row that do not share a common superscript differ significantly. Values in the same column that do not share a common subscript number differ significantly
Effects on pH of muscle
One of the natural biochemical processes occurring after death of animal is post-mortem acidification (the accumulation of lactic acid due to anaerobic glycolysis of glycogen). Because of that, the pH of post-rigor fillets before freezing was significantly lower than that of pre-rigor fillets. However, after freezing and thawing the difference in muscle pH of the two types of fillets became insignificant. A drop in pH normally results in reduced water holding capacity of the muscle because the pH is moving toward pI values of myofibrilar proteins. This could be the reason why there was a considerable exudation loss during chilled storage after thawing of pre-rigor processed fillets (Fig. 6). For Atlantic salmon, it was reported that effects of filleting conditions (pre- or post-rigor) on pH, color and exudation loss during chilled storage overshadowed those of pre-slaughter handling (pumping and live chilling) and stunning methods (percussive vs. electrical) (Bjorn Roth et al. 2009).
Effects on drip loss (liquid released after freezing and thawing)
Results of drip loss measurement for whole fillet (extracted from Fig. 6) and for a portion of fillet are showed in Fig. 9.
Fig. 9.

Drip loss upon thawing of pre-rigor and post-rigor processed fillets
Whether measured on whole fillets or portions of the fillets, the drip loss upon thawing of pre-rigor processed fillets was very much higher than that of the post-rigor processed fillets. For example, compared to post-rigor processing, drip loss in pre-rigor processed fillets was six times higher (6.81 ± 3.68 vs. 1.11 ± 0.58) when measured on whole fillets, and 2.6 times higher (9.78 ± 5.68 vs. 3.78 ± 1.22) when measured on a portion of fillets, (Fig. 9). The higher values in drip loss measured with a portion could be due to its higher surface area to volume ratio compared to a whole fillet. It was also observed that the drip loss of pre-rigor fillets had a much larger variation. This could be due to the fact that individual post-mortem changes of fish varied strongly (Fig. 5) and the pre-rigor measurement reflected this variation.
Effects on cooking loss (liquid loss after cooking)
The effects of processing and freezing/thawing on cooking loss of muscle are shown in Table 4. Before freezing, cooking loss of pre-rigor fillets was significantly lower than that of the post-rigor fillets. This might have been related to the pH of the muscle. Before freezing, pH of the post-rigor fillets was lower than that of the pre-rigor processed fillets (Fig. 9). After freezing and thawing, the cooking loss for the two types of fillets was not significantly different. It should be noted that after freezing and thawing, pre-rigor fillets had already lost a considerable amount of liquid called the drip loss. Therefore, total loss, say before consumption, including drip loss and cooking loss of the pre-rigor fillets was significantly higher than that of the post-rigor fillets. In processing Atlantic salmon, Skjervold and coworkers did not find a significant difference in water binding capacity of pre-rigor (2 h after killing) and post-rigor (5 days after killing) processed fillets (Skjervold et al. 2001b).
Table 4.
Cooking loss (as % of liquid loss) from pre-rigor and post-rigor processed fillets
| Pre-rigor processed fillets | Post-rigor processed fillets | |
|---|---|---|
| Before freezing | 19.87b2 ± 1.73 | 26.28a1 ± 2.85 |
| After freezing and thawing | 23.34a1 ± 2.66 | 24.94a1 ± 3.56 |
Values in the same row that do not share a common superscript differ significantly. Values in the same column that do not share a common subscript number differ significantly
Freezing and thawing increased cooking loss (increased liquid loss during heating) of pre-rigor fillets significantly while freezing and thawing did not influence the cooking loss of the post-rigor fillets (Table 4).
Conclusion
Compared to pre-rigor filleting, post-rigor filleting resulted in 3% higher mass yield and this would have been economically significant if not for the extended time needed for the rigor-mortis process. Compared to post-rigor processing, pre-rigor processing resulted in fillets with higher fillet length shrinkage and higher exudation loss during chilled storage either before freezing or after freezing and thawing. Post-rigor fillets appeared homogenous in color and had smoother surface after freezing and thawing. Freezing and thawing increased the brightness, decreased the redness and increased the yellowness of pre-rigor and post-rigor fillets.
With regards to drip loss upon thawing, pre-rigor fillets lost about 6% of total fillet weight, which was greater than the loss in post-rigor fillets. Before freezing, pre-rigor fillets had lower cooking loss compared to post-rigor fillets. However, after freezing and thawing there was no significant difference in cooking loss between the two types of fillets. The results showed convincing advantages of post-rigor processing over pre-rigor processing. However, post-rigor processing is not easy to apply in industry at the moment since there must be a waiting time after exsanguination for the fish to pass through rigor mortis process before filleting. This requires a large chilling area and can also limit the capacity of the processing plant. The results of this research serve as a great foundation for further investigation on modification of processing practices for better fillet quality.
Acknowledgements
This research was financially sponsored by Nafosted grant and Novus International Inc.
Footnotes
Publisher's Note
Springer Nature remains neutral with regard to jurisdictional claims in published maps and institutional affiliations.
References
- Aune TF, Olsen RL, Akse L, Ytterstad E, Esaiassen M. Influence of different cold storage temperatures during the Rigor mortis phase on fillet contraction and longer-term quality changes of Atlantic cod fillets. Lwt-Food Sci Technol. 2014;59(1):583–586. doi: 10.1016/j.lwt.2014.04.018. [DOI] [Google Scholar]
- Bito M, Yamada K, Mikumo Y, Amano K. Difference in the mode of rigor mortis among some varieties of fish by modified Cutting's method. Bull Tokai Reg Fish Res Lab. 1983;109:89–93. [Google Scholar]
- Bjornevik M, Solbakken V. Preslaughter stress and subsequent effect on flesh quality in farmed cod. Aquac Res. 2010;41(10):e467–e474. doi: 10.1111/j.1365-2109.2010.02498.x. [DOI] [Google Scholar]
- Bosworth BG, Wolters WR, Silva JL, Chamul RS. Slush-ice storage of catfish carcasses. North Am J Aquac. 2006;68(1):99–102. doi: 10.1577/a04-054.1. [DOI] [Google Scholar]
- Digre H, Erikson U, Skaret J, Lea P, Gallart-Jornet L, Misimi E. Biochemical, physical and sensory quality of ice-stored Atlantic cod (Gadus morhua) as affected by pre-slaughter stress, percussion stunning and AQUI-S-(TM) anaesthesia. Eur Food Res Technol. 2011;233(3):447–456. doi: 10.1007/s00217-011-1531-8. [DOI] [Google Scholar]
- Dunajski E. Texture of fish muscle. J Text Stud. 1980;10(4):301–318. doi: 10.1111/j.1745-4603.1980.tb00862.x. [DOI] [Google Scholar]
- Einen O, Guerin T, Fjaera SO, Skjervold PO. Freezing of pre-rigor fillets of Atlantic salmon. Aquaculture. 2002;212(1–4):129–140. doi: 10.1016/s0044-8486(01)00874-2. [DOI] [Google Scholar]
- Harmon TS. Methods for reducing stressors and maintaining water quality associated with live fish transport in tanks: a review of the basics. Rev Aquac. 2009;1(1):58–66. doi: 10.1111/j.1753-5131.2008.01003.x. [DOI] [Google Scholar]
- Hashim RB, Jamil EF, Zulkipli FH, Daud JM. Fatty acid compositions of silver catfish, pangasius sp farmed in several rivers of Pahang, Malaysia. J Oleo Sci. 2015;64(2):205–209. doi: 10.5650/jos.ess14191. [DOI] [PubMed] [Google Scholar]
- Karl H, Lehmann I, Manthey-Karl M, Meyer C, Ostermeyer U. Comparison of nutritional value and microbiological status of new imported fish species on the German market. Int J Food Sci Technol. 2014;49(11):2481–2490. doi: 10.1111/ijfs.12543. [DOI] [Google Scholar]
- Kristoffersen S, Vang B, Larsen R, Olsen RL. Pre-rigor filleting and drip loss from fillets of farmed Atlantic cod (Gadus morhua L.) Aquac Res. 2007;38(16):1721–1731. doi: 10.1111/j.1365-2109.2007.01843.x. [DOI] [Google Scholar]
- Ostenfeld T, Thomsen S, Ingolfdottir S, Ronsholdt B, McLean E. Evaluation of the effect of live haulage on metabolites and fillet texture of rainbow-trout (Oncorhynchus-Mykiss) Water Sci Technol. 1995;31(10):233–237. doi: 10.1016/0273-1223(95)00444-r. [DOI] [Google Scholar]
- Roth B, Slinde E, Arildsen J. Pre or post mortem muscle activity in Atlantic salmon (Salmo salar). The effect on rigor mortis and the physical properties of flesh. Aquaculture. 2006;257(1–4):504–510. doi: 10.1016/j.aquaculture.2005.10.021. [DOI] [Google Scholar]
- Roth B, Imsland A, Gunnarsson S, Foss A, Schelvis-Smit R. Slaughter quality and rigor contraction in fanned turbot (Scophthalmus maximus); a comparison between different stunning methods. Aquaculture. 2007;272(1–4):754–761. doi: 10.1016/j.aquaculture.2007.09.012. [DOI] [Google Scholar]
- Roth B, Birkeland S, Oyarzun F. Stunning, pre slaughter and filleting conditions of Atlantic salmon and subsequent effect on flesh quality on fresh and smoked fillets. Aquaculture. 2009;289(3–4):350–356. doi: 10.1016/j.aquaculture.2009.01.013. [DOI] [Google Scholar]
- Skipnes D, Ostby ML, Hendrickx ME. A method for characterising cook loss and water holding capacity in heat treated cod (Gadus morhua) muscle. J Food Eng. 2007;80(4):1078–1085. doi: 10.1016/j.jfoodeng.2006.08.015. [DOI] [Google Scholar]
- Skjervold PO, Fjaera SO, Ostby PB, Einen O. Live-chilling and crowding stress before slaughter of Atlantic salmon (Salmo salar) Aquaculture. 2001;192(2–4):265–280. doi: 10.1016/s0044-8486(00)00447-6. [DOI] [Google Scholar]
- Skjervold PO, Rora AMB, Fjaera SO, Vegusdal A, Vorre A, Einen O. Effects of pre-, in-, or post-rigor filleting of live chilled Atlantic salmon. Aquaculture. 2001;194(3–4):315–326. doi: 10.1016/s0044-8486(00)00531-7. [DOI] [Google Scholar]
- Sorensen NK, Brataas R, Nyvold TE, Lauritzen K. Influence of early processing (pre-rigor) on fish quality. In: Luten JB, Borresen T, Oehlenschlager J, editors. Seafood from producer to consumer, integrated approach to quality. Amsterdam: Elsevier; 1997. pp. 253–263. [Google Scholar]
- Stien LH, Suontama J, Kiessling A. Image analysis as a tool to quantify rigor contraction in pre-rigor-filleted fillets. Comput Electron Agric. 2006;50(2):109–120. doi: 10.1016/j.compag.2005.08.012. [DOI] [Google Scholar]