

Abstract
In this study, the physicochemical properties (total volatile basic nitrogen (TVB-N), pH, and peroxide value) and the volatile flavors of yak meat were systematically evaluated during chilled (0 °C) and controlled freezing-point (− 2 °C) storage. The TVB-N reached 15.21 mg/100 g after 18 days of storage at 0 °C, which exceeded the secondary freshness value according to the Chinese national standard. For storage at − 2 °C, the TVB-N did not exceed 15 mg/100 g until 24 days. Compared with storage at 0 °C, the samples stored at − 2 °C had a slower rate of increase in TVB-N, pH, and peroxide values. The changes in volatile compounds in yak meat during storage at − 2 °C and 0 °C for 24 days were investigated using headspace solid-phase microextraction (HS-SPME) followed by gas chromatography-mass spectrometry (GC–MS). The correlations between the changes in the volatile compound contents and meat quality deterioration revealed significant negative correlations (rmin = 0.902, p < 0.05) between some aldehyde flavor components (nonanal, heptanal, benzaldehyde, decanal, and myristal) and TVB-N in the samples stored at controlled freezing-point and chilled temperatures. The decreases in nonanal, benzaldehyde, and myristal contents in yak meat followed zero order reaction kinetics. This result indicated, because of the highly selective and sensitive colorimetric detection method, that volatile compounds can effectively predict the decay in quality of yak meat stored at low temperature in advance. Thus, based on physicochemical and volatile flavor analyses, a new method is proposed to investigate the storage and preservation of yak meat.
Keywords: Yak meat, Deterioration index, Volatile compounds, Headspace solid-phase microextraction
Introduction
The Tibetan yak (Bos grunniens) is an important breed distributed in the Tibet Autonomous Region of China. Yak meat is appreciated because of the delicate taste, high protein and omega 3 oil contents, low levels of “bad” fats, and high levels of nutrients (Wang et al. 2013; Zhao et al. 2018). Unfortunately, the shelf life of fresh yak meat is limited because of the lack of appropriate preservation technology in Tibet. The rate of spoilage depends on the composition of the meat and the storage conditions. On one hand, meat with high protein and moisture contents has increased susceptibility to microbial contamination or corruption, which affects the safety and quality of meat (Song et al. 2017). The oxidation process is also a major factor causing deterioration of muscle food products and is associated with damage to a wide range of meat components, including nucleic acids, proteins, and lipids, particularly unsaturated fatty acids (Brodowska et al. 2016; Kim et al. 2018). On the other hand, different packaging and storage conditions, including antioxidant treatment, modified atmosphere packaging, refrigeration, and irradiation, can reduce the rate of meat spoilage and the deterioration in meat quality (Torngren et al. 2018). Simultaneously, the yak meat produced from the remote areas of the Tibetan Plateau and adjacent highlands of China is higher in monounsaturated and polyunsaturated fatty acids than beef; thus, the challenge to alleviate the oxidation of unsaturated fatty acids in yak meat stored in different packaging and storage conditions is a large one (Lang et al. 2016). However, studies that examine the storage conditions and keeping yak meat fresh remain scarce.
In food conservation systems, frozen storage has successfully fulfilled the need to increase the shelf life and maintain the quality of meat, as demonstrated independently (Bellés et al. 2017; Brodowska et al. 2016). However, frozen storage can disrupt meat structure because of both physical changes and the osmotic pressure exerted by the extracellular concentration of solutes (Coombs et al. 2017), thereby affecting some meat properties and influencing the qualities of meat and meat products for consumption. Controlled freezing-point storage (CFPS) at non-freezing temperature zone between the freezing-point of water and that of an individual material is useful in prolonging the shelf-life of fresh food and hindering chemical and microbial changes (Guo et al. 2008). When compared with frozen stored products, CFPS has numerous advantages for fresh food quality because of its retardation of biochemical and microbial activity without physically damaging the muscle structure due to ice crystal formation (Zhu et al. 2016). The use of freezing/thawing can also be reduced, which results in a lower energy cost for controlled freezing-point technology in terms of transportation and retailing than that with freezing technology (Zhou et al. 2010). Therefore, controlled freezing-point technology can be considered particularly useful in the control of microbial spoilage of food products.
Currently, because of the ever-increasing demand of good quality by consumers, the control and assessment of the quality of fresh meat is of great concern. Traditionally, the overall quality of fresh meat has been evaluated by sensory tests judging from the appearance, odor, color, texture, etc. (O’Sullivan and Kerry 2009). The major disadvantage of sensory tests is subjectivity; the judgment of meat quality might be inaccurate or unreliable. Therefore, the expectation is high worldwide for the development of objective and reliable methods to assess fresh meat quality, as well as to reinforce the results of subjective evaluations. Total volatile basic nitrogen (TVB-N), thiobarbituric acid, peroxide value (POV), and pH, among others, are the most common chemical and biochemical parameters applied to objectively evaluate the quality of fresh meat (Brodowska et al. 2016; Büyükalacaa and Bulutb 2004). However, because these parameters can sometimes show high variability and low specificity, the prediction of deterioration in meat quality in advance is difficult. Some volatile compounds regarded as characteristic or unpleasant flavors of meat can also be used to assess the quality (Li et al. 2016). The determination of the volatile compounds in meat by HS-SPME (headspace solid-phase microextraction) coupled with GC–MS (gas chromatography-mass spectrometry) exhibits high sensitivity and specificity (Wang et al. 2017). The volatile compounds such as methylamine, dimethylamine, and trimethylamine have been successfully applied to monitor the freshness of fish during storage (Dacosta et al. 1990). Although hundreds of compounds in beef contribute to flavor and aroma (Baliño-Zuazo and Barranco 2016), few studies have been conducted on the relationship between the volatile compounds in beef and beef quality, or on the determination of volatile compounds used to monitor the freshness of beef during storage.
The primary aim of this work was to investigate the effects of controlled freezing-point (− 2 °C) and low-temperature (0 °C) storage on changes in the chemical and biochemical properties and flavors of yak meat. The volatile compounds in yak meat were determined using HS-SPME coupled with GC–MS, and the changes in the volatile compounds regarded as the characteristic or unpleasant flavors in yak meat were monitored. The correlations between the major volatile compounds and other quality parameters (sensory test, pH, TVB-N, and POV) were also examined, for comparative purposes.
Materials and methods
Sample preparation
The Tibetan yak (Bos grunniens) tenderloin was obtained from commercial slaughter houses in Gongbo’gyamda County, Tibet. 15 adult male yaks who were normal, healthy and disease-free, and 4 years old, were slaughtered, the approximate weight of an adult male yak is 400–500 kg. The 200 g samples containing a mixture of tenderloin from the 15 yaks were packaged in sterile bags, placed on ice, and transported to the laboratory within 3 h. The packaged samples were stored at − 2.0 ± 0.5 °C or 0.0 ± 0.5 °C (Compressor-Cooled Incubator ICP260, Memmert, Germany) for up to 24 days. Samples of the chemical and biochemical parameters were analyzed at predetermined time intervals: 0, 3, 6, 9, 12, 15, 18, 21, and 24 days (n = 4 each time per treatment). The flavor substances were analyzed at 0, 6, 12, 16, and 24 days (n = 6 each time per treatment).
Freezing point of Tibetan yak meat
The yak meat samples were frozen in a temperature-controlled environmental chamber (Siemens refrigerator KA92NE03TI, Siemens, Germany). The temperature of the chamber was set at − 20.0 ± 1.0 °C for the determination trials. Temperatures were logged at 1 min intervals using a Squirrel data logger (Squirrel 1000 Series, Grant Instruments, Cambridge, UK). When the temperatures recorded by all probes were < − 9 °C, the sample was removed from the chamber. The freezing point of Tibetan yak meat was determined based on the initial temperature of the “plateau” from the freezing curve, and the equilibrium freezing point was the temperature at which the slowest cooling rate was discovered (James et al. 2005).
pH value
Yak meat pH was determined according to the method of Strange et al. (1977) with slight modifications. A sample of 5 g of minced yak meat was mixed with 50 mL of deionized water and homogenized by a homogenizer (XHF-D, Ningbo Scientz Biotechnology Inc., Zhejiang, China) for 1 min at 6000 xg. A digital pH meter (pHS-3C, Shanghai Meitele-Tolido Instrument Co. Ltd., China) was utilized to measure the pH of sample homogenate.
Peroxide value (POV)
The POV of the yak meat samples was analyzed according to the official method of AOAC (Association of Official Analytical Chemists 2007). A sample, 0.30 g, was mixed with 9.8 mL of chloroform–methanol in a glass tube and vortexed for 3–5 s. Ammonium thiocyanate solution (10 mM), 0.05 mL, was added to the sample, which was homogenized for 5 s. Then, 0.05 mL of iron (II) solution was added, and the sample was again homogenized for 5 s. The mixture was incubated for 5 min at room temperature, and the absorbance was measured at 500 nm using a UV–visible spectrophotometer (U-2900, Hitachi, Tokyo, Japan). POVs are expressed as gram of sodium thiosulfate per 100 grams sample.
Total volatile basic nitrogen (TVB-N)
The TVB-N was measured by semimicrosteam distillation, as described by Lan et al. (2016) with slight modifications. A 10 g sample of minced yak meat was dispersed in 100 mL of distilled water and stirred for 30 min, and the mixture was then filtered. The TVB-N value was determined according to the consumption of hydrochloric acid and calculated using the following equation: TVB-N (mg/100 g) = (Y1 − Y2) × C × 2800, where Y1 is the titration volume of hydrochloric acid in the sample, Y2 is the titration volume in the blank, and C is the concentration of hydrochloric acid (0.01 mol/L).
GC–MS analysis and identification of volatile components
Beef samples were ground into a minced meat using a Seydelmann meat grinder (Model WD114, Germany), and a 2.5 g portion was placed in a 20 mL headspace vial and shaken at 80 °C for 10 min (Li et al. 2016). The volatile compounds were extracted by inserting a 50/30 µm DVB/CAR/PDMS solid phase microextraction (SPME) fiber (Supelco, Bellefonte, PA, USA) into the headspace vial and exposing it to the headspace at 80 °C for 30 min. All analyses were performed using a GC–MS-QP 2010 (Shimadzu, Nakagyo Ku, Kyoto, Japan) coupled with an RTX-5 ms capillary column (30 m × 0.25 mm; Daojin, Japan). The carrier gas was high purity helium at 40 °C for 3 min; the temperature was then increased to 120 °C at the rate of 5 °C/min and finally increased to 230 °C at the rate of 10 °C/min and kept at this temperature for 5 min. A split ratio of 30:1 was used, and the interface temperature was 250 °C. Mass spectra in the electron impact mode were obtained in the mass range 40–400 m/s at 70 eV. Volatile compounds were identified by comparison with reference spectra in the NIST (National Institute of Standards and Technology) and Wiley libraries (https://www.onlinelibrary.wiley.com/).
A mathematical model for the dynamic analysis of the deterioration in yak meat quality
In general, a characteristic quality index A can be measured to assess the quality loss or deterioration of stored food. The change in the quality index with storage time (∆A/∆t) can usually be represented by the following kinetic equation (Fu and Labuza 1997):
| 1 |
where k is regarded as a rate constant depending on food properties, storage temperature, and food packaging characteristics; and n is a critical factor called the reaction order that defines whether the rate of change hinges on the amount of A present. If environmental factors such as storage temperature, humidity, light, etc., remain unchanged, n can define the shape of the deterioration curve.
In general, the aldehyde flavor components of meat products could be examined as important quality indexes (Marusic et al. 2014). In this study, the changes of the main volatile components in the yak meat during storage at 0 °C and − 2 °C, were investigated using the kinetic Eq. (1). In order to increase the reliability and credibility of the mathematical models, the change of the same volatile components in the yak meat stored at chilled temperature (2 °C), was also studied using the kinetic Eq. (1) and considered as statistically significant. Linear regression techniques and the statistical software STATA version 10.0 have been used to analyze all the experimental data. In estimating the kinetic parameters all the normalized experimental data points were used, accounting for the samples variability.
Statistical analyses
Data were expressed as the means and standard deviations obtained from triplicate determination unless otherwise stated. Microsoft Excel 2007 (Microsoft Inc., USA) was used for data processing. Statistical significance was assessed by one-way and two-way analysis of variance (ANOVA) using SPSS 16.0 (SPSS Inc., Chicago, Illinois, USA) for windows. Differences at p < 0.05 were considered as significant. Origin 2017 (OriginLab Corp., USA) was used for image processing.
Results and discussion
Freezing point temperature
The freezing temperature curve of Tibetan yak meat is shown in Fig. 1. When the temperature dropped to between − 2.4 and − 2.6 °C, the meat entered the largest ice crystal formation zone, and the temperature decline was extremely slow. Thus, the freezing point of yak meat was from − 2.4 to − 2.6 °C. The of yak meat is lower than that other beef, which ranges from − 0.9 to − 1.5 °C (Farouk et al. 2013). The difference in freezing point temperature between yak meat and other beef may be attributed to differences in composition, structures and properties (Zhao et al. 2018). For the application of controlled freezing-point technology to store and preserve yak meat, the low freezing point temperature is beneficial because it provides a wider operating-temperature range and reduces the requirement for storage and preservation equipment.
Fig. 1.
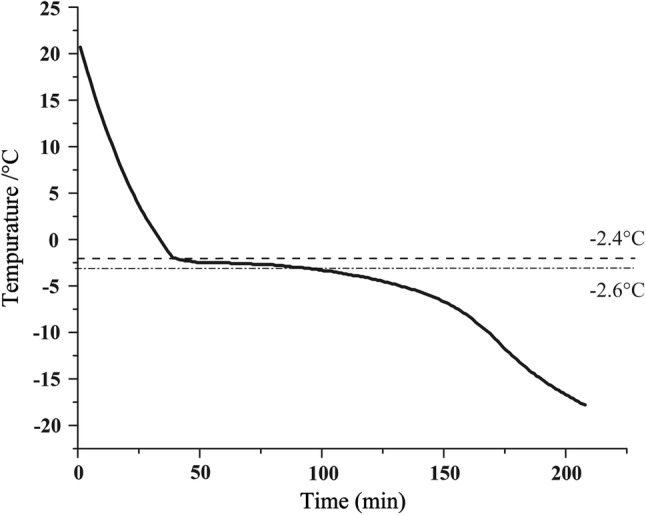
Freezing curve of yak meat
Changes in pH
The pH of meat is closely associated with the freshness (Olaoye et al. 2018). The changes in the pH of yak meat stored at − 2 °C and 0 °C for 24 d are shown in Fig. 2a. Compared with the slow increase found in the yak meat stored at − 2 °C, a rapid increase was observed between 6 and 24 d in the pH of yak meat stored at 0 °C. The increase in pH was likely primarily due to the creation of ammonia, amines, and other basic substances from the degradation of proteins by meat spoilage microorganisms and endogenous enzymes (Muela et al. 2010).
Fig. 2.
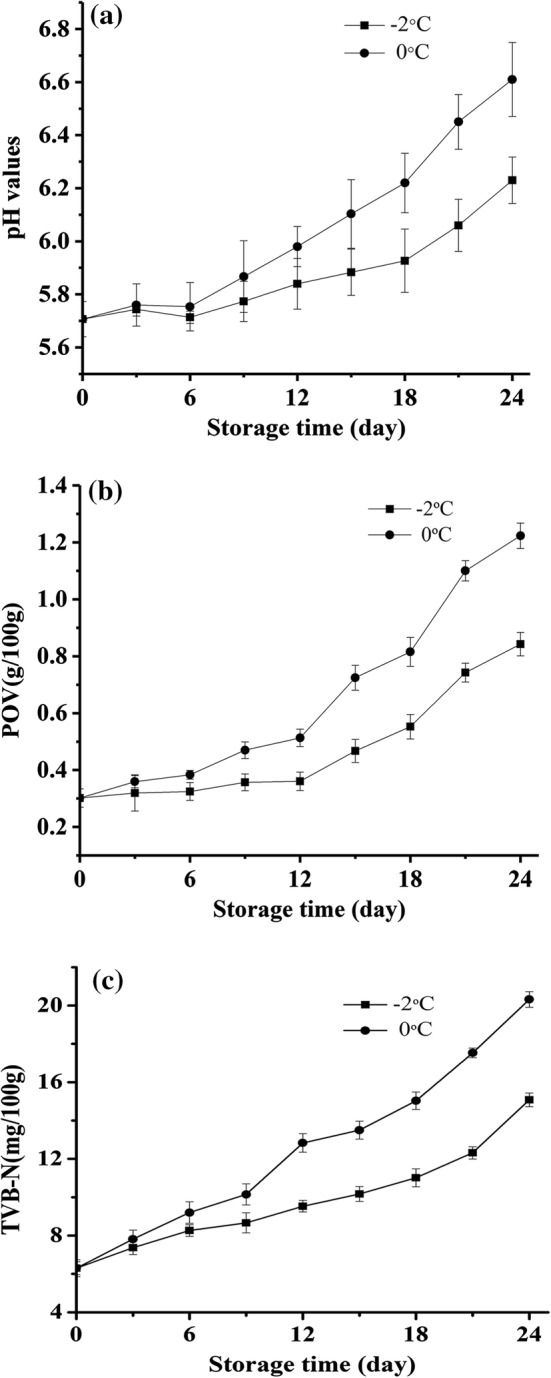
Changes in pH (a), POV (b), and TVB-N (c) values of yak meat stored at –2 °C and 0 °C
Changes in POV
Hydroperoxide initiates and promotes the autoxidation of lipids and rancidity by absorbing oxygen and the subsequent formation of carbonyl compound by-products. Therefore, the POV is usually used to reflect the oxidation level of lipid-containing food (Qi et al. 2015). As shown in Fig. 2b, the POV gradually increased for all yak meat samples during storage, but the POVs for the yak meat stored at − 2 °C were significantly lower than those of samples stored at 0 °C (p < 0.05). The initial POV of yak meat samples was 0.30 g/100 g, which increased gradually to 0.84 g/100 g during storage for 24 d at − 2 °C, but increased rapidly to 1.22 g/100 g during storage for 24 d at 0 °C. The results showed that the lipid oxidation of stored yak meat was much more retarded at controlled freezing-point than at chilling temperatures. This observation was attributed to that lower storage temperature could be beneficial to reduce the autoxidation of lipids in meat. These data are consistent with those of Wang et al. (2018) and Lan et al. (2016) for rabbit meat, who reported that low temperature can restrain lipid oxidation to some extent. Thus, the yak meat samples showed a lower rate of increase in lipid oxidation stored under controlled freezing-point than chilled conditions.
Changes in TVB-N
The TVB-N value is an important reference index to evaluate the freshness of meat. The TVB-N is a measure of the volatile, basic nitrogen-containing substances, for example, ammonia, primary amines, and secondary amines, produced by the decomposition of protein under the action of enzymes and bacteria (Ruiz-Capillas and Moral 2001; Zhang et al. 2016). The TVB-N values increased for all yak meat samples with storage time but showed the highest rates of increase at the storage temperature of 0 °C (Fig. 2c). The TVB-N of chilled yak meat stored at 0 °C increased from 6.3 mg/100 g (initial value) to 20.32 mg/100 g over the 24 d of storage, whereas the yak meat samples stored at − 2 °C showed less of an increase over 24 d and the final TVB-N value was merely 14.98 mg/100 g. Thus, the storage temperature greatly affected the TVB-N values. The increase in TVB-N values in yak meat can be largely attributed to the protein degradation reactions initiated by meat spoilage bacteria and endogenous enzymes, including the degradation of nucleotides, the deamination and decarboxylation of free amino acids, and the oxidation of amines (Muela et al. 2010). Zhang et al. (2015) reported a similar phenomenon in which the TVB-N increased for meat samples with storage time, but the TVB-N value of the meat samples stored at − 2 °C was also distinctly lower than that of chilled samples stored at 1 °C and 4 °C. High TVB-N values are not desirable and are associated with an unpleasant smell in meat. For the proposed TVB-N value of 15 mg/100 g in yak meat as an acceptability limit (Urmila et al. 2015), the results of this study indicated the acceptable shelf life was 24 d at − 2 °C and 18 d at 0 °C.
Volatile flavor compounds
For consumers purchasing meat, sensory traits such as flavor and tenderness are the most important criteria for the acceptability and palatability of beef. Figure 3 shows the total ion current chromatogram of the volatile components of yak meat and their changes during storage at − 2 °C and 0 °C. The percentage changes in volatile flavor compounds from yak meat stored at − 2 °C and 0 °C were detected and systematically analyzed (Table 1). The results indicated that the relative content of aldehydes in fresh yak meat was as high as 63.24%, followed by alcohols (15.37%), hydrocarbons (12.86%), esters (7.98%), ketones (0.46%), acids (0.04%), and other compounds (0.05%). Lipid oxidation, the Maillard reaction, and feed resources are often the main sources of volatile compounds for animal products (Zhang et al. 2016). Some of these compounds are derived from raw meat, whereas others are most likely the products of lipid oxidation or various changes resulting from storage (Aaslyng and Meinert 2017). Aldehydes, due to their low odor thresholds, are considered the most important aroma components of meat products, exhibiting characteristic aroma notes such as butter, sweet, floral, toasted, or green odors (Marusic et al. 2014). Octanal, nonanal, decanal, heptanal, benzaldehyde, decanal, and myristal are generally considered as the characteristic flavor substances of yak meat (Wang et al. 2006). Two primary sources generate aldehydes: lipid oxidative degradation and the amino acid Strecker reaction (Zhang et al. 2006). After 24 days, the aldehyde content at − 2 °C (37.29%) was significantly higher than that at 0 °C (31.25%). The different amounts of aldehydes were most likely caused by lipid oxidation at the different temperatures. The data indicated that the oxidation degree in yak meat stored at − 2 °C was lower than that of the samples stored at 0 °C, which was consistent with the effects of temperature on the POV of yak meat (Fig. 2b). Esters and alcohols are usually assumed to be less significant in meat products because of their relatively high odor thresholds (Giri et al. 2010), so the attention in this study was not focused on the changes in esters and alcohols in yak meat. However, ketones lead to changes in odors or even contribute to the appearance of rancid flavors. Several of the unsaturated fatty acids, such as linoleic and arachidonic acids, are rapidly oxidized to conjugated diene hydroperoxides and then degraded to ketones. In this study, 3-hydroxy-2-butanone and 2-undecone were detected in the stored yak meat but were not found in the fresh yak meat (Table 1), which indicated that both compounds could cause off-flavors in the stored beef. The results are consistent with those reported by Corral and Flores (2017). Hydrocarbons often possess high odor thresholds and therefore usually contribute less to the aroma profile of meat products (Van et al. 2013). The results in this study also showed little change in hydrocarbon compounds between storage at − 2 °C and 0 °C.
Fig. 3.

Development of volatile flavor compounds during storage of yak meat using SPME and GC-MS
Table 1.
Volatile flavor compounds in yak meat during storage (%)
| Compounds | Day 0 | − 2 °C-day 24 | 0 °C-day 24 |
|---|---|---|---|
| Aldehydes | |||
| Hexenal | 8.46 ± 0.17a | 2.78 ± 0.10b | 2.57 ± 0.13c |
| Heptanal | 3.79 ± 0.06a | 1.76 ± 0.03b | 1.66 ± 0.08b |
| Benzaldehyde | 11.26 ± 0.39a | 5.13 ± 0.20b | 5.03 ± 0.19c |
| Octanal | 3.95 ± 0.09a | 1.43 ± 0.02b | 1.28 ± 0.06b |
| Nonanal | 10.82 ± 0.14a | 5.50 ± 0.10b | 5.37 ± 0.16b |
| Decanal | 8.83 ± 0.35a | 3.63 ± 0.11b | 3.59 ± 0.13b |
| Myristal | 0.75 ± 0.02a | 0.3 ± 0.01b | 0.21 ± 0.01b |
| Hexadecanal | 5.73 ± 0.11a | 5.41 ± 0.14b | 5.21 ± 0.18c |
| Others | 9.65 ± 0.28a | 11.35 ± 0.22b | 6.33 ± 0.25c |
| Subtotal | 63.24 ± 2.47a | 37.29 ± 1.38b | 31.25 ± 1.44c |
| Alcohols | |||
| 2-octyl-1-nonanol | 1.89 ± 0.05a | 4.15 ± 0.07b | 4.41 ± 0.16c |
| Ninecanol | 1.73 ± 0.03a | 3.01 ± 0.06b | 3.14 ± 0.11c |
| Cyclohexadecanol | 1.33 ± 0.01a | 2.18 ± 0.09b | 2.29 ± 0.07c |
| Trans-2-dodecen-1-ol | 0.74 ± 0.01a | 1.01 ± 0.04b | 1.44 ± 0.04c |
| Tetracatanol | 0.30 ± 0.02a | 1.20 ± 0.04b | 1.26 ± 0.04b |
| 8Z-14-methyl-8-hexadecen-1-ol | 0.69 ± 0.02a | 1.00 ± 0.03b | 1.03 ± 0.02c |
| (R,R)-(-)-2,3-butanediol | ND | 0.69 ± 0.01a | 0.79 ± 0.03b |
| Others | 8.69 ± 0.10a | 9.85 ± 0.40b | 6.58 ± 0.27c |
| Subtotal | 15.37 ± 0.57a | 23.09 ± 0.90b | 20.94 ± 1.03c |
| Hydrocarbon | |||
| N-dodecane | 2.67 ± 0.06a | 2.64 ± 0.05b | 2.68 ± 0.08b |
| Tetradecane | 1.77 ± 0.03a | 1.73 ± 0.03a | 1.90 ± 0.04b |
| Hexadecane | 1.38 ± 0.02a | 1.32 ± 0.04b | 1.37 ± 0.04a |
| 2,6,10,15-tetramethylheptadecane | 1.26 ± 0.05a | 1.17 ± 0.05a | 1.16 ± 0.05a |
| N-isodecane | 1.76 ± 0.05a | ND | 1.25 ± 0.05a |
| D-limonene | 1.47 ± 0.03a | 1.36 ± 0.02b | ND |
| 1,2-epoxyoctadecane | 1.36 ± 0.05a | 1.18 ± 0.05a | 0.94 ± 0.03b |
| Hexadecane | 1.19 ± 0.04a | ND | ND |
| Others | ND | 2.40 ± 0.10a | ND |
| Subtotal | 12.86 ± 0.37a | 11.80 ± 0.58b | 9.30 ± 0.37c |
| Ketones | |||
| 3-hydroxy-2-butanone | ND | 0.47 ± 0.01a | 0.53 ± 0.02b |
| 2-undecone | ND | 0.1 ± 0.00a | 0.17 ± 0.01b |
| Geranylacetone | ND | 0.19 ± 0.01a | 0.29 ± 0.01a |
| Others | 0.46 ± 0.01a | 0.08 ± 0.00b | 1.05 ± 0.04c |
| Subtotal | 0.46 ± 0.01a | 0.84 ± 0.02b | 2.04 ± 0.07c |
| Esters | |||
| Methyl palmitate | 1.86 ± 0.05a | 1.89 ± 0.05a | 2.37 ± 0.11b |
| Methyl stearate | 1.19 ± 0.02a | 1.95 ± 0.04b | 2.01 ± 0.08b |
| Dibutyl phthalate | 0.44 ± 0.01a | 0.48 ± 0.02b | 1.02 ± 0.02b |
| Diisobutyl phthalate | 0.12 ± 0.01a | 0.46 ± 0.02b | 0.52 ± 0.02b |
| Bis(6-methylheptyl) phthalate | 0.63 ± 0.01a | 0.95 ± 0.02b | 1.19 ± 0.04c |
| Others | 3.74 ± 0.07a | 1.48 ± 0.06b | 6.37 ± 0.24c |
| Subtotal | 7.98 ± 0.24a | 7.21 ± 0.28b | 13.48 ± 0.58c |
| Acids | |||
| Isovaleric acid | ND | ND | 0.57 ± 0.03a |
| Myristic acid | ND | 0.27 ± 0.01a | 0.43 ± 0.02b |
| Others | 0.04 ± 0.00a | 0.30 ± 0.01b | 0.71 ± 0.03c |
| Subtotal | 0.04 ± 0.00a | 0.57 ± 0.02b | 1.71 ± 0.09c |
Within a row, means with different superscript letters differ significantly (P < 0.05). ND not detected
Correlations between flavor-specific components and meat-quality attributes
The correlation coefficients between flavor-specific components and meat-quality attributes (TVB-N, pH, and peroxide value) are shown in Table 2. A significant negative correlation was observed between some aldehyde flavor components (nonanal, heptanal, benzaldehyde, decanal, and myristal) and the TVB-N in chilled and controlled freezing-point samples (rmin = 0.902, p < 0.05). The negative correlations indicated that the increase in TVB-N occurred simultaneously with the decrease in the aldehyde flavor components, which could lead to the appearance of off-flavors and odors. Furthermore, both nonanal and benzaldehyde in yak meat stored at − 2 °C and 0 °C were significantly negatively correlated with TVB-N, pH, and peroxide values (rmin = 0.884, p < 0.05). Similarly, Ruiz-Capillas and Moral (2001) reported that the pH, TMA-N (Trimethylamine-nitrogen), and TVB-N were very highly correlated with sensory quality indices in hake stored in ice. According to a previous study, nonanal and benzaldehyde are also the major special flavors of yak meat (Zhang et al. 2016), and therefore, the decrease in nonanal and benzaldehyde contents might lead to off-flavors in fresh yak meat. Because the changes in nonanal and benzaldehyde contents occurred in beef stored under both conditions, these compounds might be the most suitable indices for predicting quality deterioration of fresh yak meat. Simultaneously, geranylacetone and 3-hydroxy-2-butanone were ketone compounds produced from the oxidation of unsaturated fatty acids in yak meat (Table 1). The geranylacetone was significantly negatively correlated with the TVB-N and pH when the yak meat was stored at − 2 °C, but the 3-hydroxy-2-butanone showed a significant negative correlation with TVB-N and pH when the yak meat was stored at 0 °C (Table 2). Thus, the storage temperature had a great effect and increased the contents geranylacetone and 3-hydroxy-2-butanone. Thus, the changes in geranylacetone and 3-hydroxy-2-butanone contents might not be suitable indexes for predicting quality deterioration of fresh yak meat because of the difference at different low temperatures.
Table 2.
Pearson’s correlation coefficients (r) between different parameters of yak meat during chilled (0 °C)1 and controlled freezing-point (− 2 °C)2 storage for 24 d
| Index | TVB-N | pH | POV | Nonanal | Heptanal | Benzaldehyde | Decanal | Myristal | 3-hydroxy-2-butanone | Geranylacetone |
|---|---|---|---|---|---|---|---|---|---|---|
| TVB-N | 0.977** | 0.963** | − 0.989** | − 0.927* | − 0.927* | − 0.902* | − 0.933* | 0.713 | 0.902* | |
| pH | 0.982** | 0.984** | − 0.983** | − 0.888* | − 0.908* | − 0.86 | − 0.908* | 0.685 | 0.904* | |
| POV | 0.971** | 0.995** | − 0.979** | − 0.862 | − 0.884* | − 0.84 | − 0.923* | 0.579 | 0.821 | |
| Nonanal | − 0.968** | − 0.937* | − 0.946* | 0.866 | 0.873 | 0.835 | 0.895* | − 0.620 | − 0.860 | |
| Heptanal | − 0.966** | − 0.922* | − 0.905* | 0.949* | 0.995** | 0.997** | 0.970** | − 0.866 | − 0.916* | |
| Benzaldehyde | − 0.969** | − 0.922* | − 0.905* | 0.956* | 0.999** | 0.992** | 0.976** | − 0.856 | − 0.920* | |
| Decanal | − 0.933** | − 0.871 | − 0.86 | 0.949* | 0.989** | 0.990** | 0.972** | − 0.857 | − 0.888* | |
| Myristal | − 0.940* | − 0.864 | − 0.848 | 0.949* | 0.979** | 0.985** | 0.989** | − 0.725 | − 0.832 | |
| Hydroxybutanone | 0.939* | 0.935* | 0.908* | − 0.869 | 0.961** | 0.953* | − 0.916* | − 0.889* | 0.918* | |
| Geranylacetone | 0.609 | 0.456 | 0.404 | − 0.583 | 0.674 | − 0.689 | − 0.698 | − 0.777 | − 0.54 |
Significant level: *p < 0.05; **p < 0.01. 1Lower left part; 2Top right part
Change of the aldehyde flavor components in the yak meat under different storage conditions
In this study, the aldehyde flavor components nonanal, heptanal, benzaldehyde, and myristal were examined as important quality indexes. The changes in these quality indexes in yak meat at different storage times are shown in Fig. 4. The decrease in the aldehyde flavor components in yak meat showed a good linear correlation with storage time; the slope was k, and n was equal to 0. This result indicated the decrease in the aldehyde flavor components in yak meat followed zero order reaction kinetics, which implied that the rate of quality loss or deterioration of yak meat was constant under the same environmental conditions. The significant difference in k between the aldehyde flavor components from fresh yak meat stored at 2 °C, 0 °C and − 2 °C, except for heptanal, indicated that storage temperature had an important effect on the flavor quality of yak meat, despite the low temperatures of both treatments and the small temperature difference between them. Therefore, the changes in nonanal, benzaldehyde, and myristal contents in yak meat might be used as accurate and sensitive indexes for monitoring the freshness and for predicting the quality deterioration of fresh yak meat. Similarly, Shahidi and Pegg (1994) reported that hexanal concentrations may serve as an index of meat flavor deterioration during the early stages of storage.
Fig. 4.

The nonanal (a), heptanal (b), benzaldehyde (c), and myristal (d) content in yak meat as related to time during storage at 2 °C, 0 °C and − 2 °C
Conclusion
As the storage time increased, the yak meat samples stored under the controlled freezing-point condition (− 2 °C) maintained a lower rate of increase in pH, POV, TVB-N and a lower rate of decrease in volatile substances than those that were stored at 0 °C. Compared with traditional chilling at 0 °C, the shelf life of good-quality yak meat increased by 5–7 days under CFPS at − 2 °C, which suggested that the CFPS temperature will exert a significant effect on shelf life. In addition, the correlation analyses indicated significant relationships between some aldehyde flavor components (nonanal, heptanal, benzaldehyde, decanal, and myristal) and the TVB-N content in chilled and controlled freezing-point samples. The decrease in aldehyde flavor components in yak meat showed a good linear correlation with storage time and followed zero order reaction kinetics. Based on the high accuracy and sensitivity of the method used in this study, the aldehyde flavor components can be used to monitor the freshness and to predict the quality loss of yak meat.
Acknowledgements
This study was supported by the State Key Research and Development Plan “Modern Food Processing and Food Storage and Transportation Technology and Equipment” (2018YFD0400102), the Key Scientific Research Projects of the Tibet Autonomous Region of China (Project Code No: XZ201901NA04), China Central Finance Supports the Development of Local Universities in Tibet: R&D and Demonstration of Key Technologies for Farming and Animal Processing (503118004), the Key Research and Develop Plan Project of Hunan Province (2017SK2190), and the Science and Technology Innovation Platform and Talent Project of Hunan Province (2017TP1021).
Compliance with ethical standards
Conflicts of interest
The authors declare that there are no conflicts of interest regarding the publication of the paper.
Footnotes
Publisher's Note
Springer Nature remains neutral with regard to jurisdictional claims in published maps and institutional affiliations.
Shuguo Sun and Juanhong Zhao have contributed equally to this work.
References
- Aaslyng MD, Meinert L. Meat flavour in pork and beef—from animal to meal. Meat Sci. 2017;132:112–117. doi: 10.1016/j.meatsci.2017.04.012. [DOI] [PubMed] [Google Scholar]
- Association of Official Analytical Chemists . AOAC official methods of analysis. Washington, USA: Association Official Analytical Chemists; 2007. [Google Scholar]
- Baliño-Zuazo L, Barranco A. A novel liquid chromatography-mass spectrometric method for the simultaneous determination of trimethylamine, dimethylamine and methylamine in fishery products. Food Chem. 2016;196:1207–1214. doi: 10.1016/j.foodchem.2015.09.086. [DOI] [PubMed] [Google Scholar]
- Bellés M, Alonso V, Roncalés P, Beltrán JA. The combined effects of superchilling and packaging on the shelf life of lamb. Meat Sci. 2017;133:126–132. doi: 10.1016/j.meatsci.2017.06.013. [DOI] [PubMed] [Google Scholar]
- Brodowska M, Guzek D, Kołota A, GłąBska D, Górska-Horczyczak E, Wojtasik-kalinowska I, WierzBicka A. Effect of diet on oxidation and profile of volatile compounds of pork after freezing storage. J Food Nutr Res. 2016;55:40–47. [Google Scholar]
- Büyükalacaa O, Bulutb H. Detailed weather data for the provinces covered by the Southeastern Anatolia Project (GAP) of Turkey. Appl Energy. 2004;77:187–204. doi: 10.1016/s0306-2619(03)00108-9. [DOI] [Google Scholar]
- Coombs CE, Holman BW, Friend MA, Hopkins DL. Long-term red meat preservation using chilled and frozen storage combinations: a review. Meat Sci. 2017;125:84–94. doi: 10.1016/j.meatsci.2016.11.025. [DOI] [PubMed] [Google Scholar]
- Corral S, Flores M. Occurrence of 1-(methylthio) propane producing off-flavour in fresh beef meat. Flavour Frag J. 2017;32:440–445. doi: 10.1002/ffj.3398. [DOI] [Google Scholar]
- Dacosta KA, Vrbanac JJ, Zeisel SH. The measurement of dimethylamine, trimethylamine, and trimethylamine n-oxide using capillary gas chromatography-mass spectrometry. Anal Biochem. 1990;187(2):234–239. doi: 10.1016/0003-2697(90)90449-j. [DOI] [PubMed] [Google Scholar]
- Farouk MM, Kemp RM, Cartwright S, North M. The initial freezing point temperature of beef rises with the rise in pH: a short communication. Meat Sci. 2013;94:121–124. doi: 10.1016/j.meatsci.2012.12.018. [DOI] [PubMed] [Google Scholar]
- Fu B, Labuza TP. Quality in frozen food. Boston: Springer; 1997. Shelf-life testing: procedures and prediction methods; pp. 377–415. [Google Scholar]
- Giri A, Okamoto A, Okazaki E, Ohshima T. Headspace volatiles along with other instrumental and sensory analyses as indices of maturation of horse mackerel miso. J Food Sci. 2010;75:406–417. doi: 10.1111/j.1750-3841.2010.01780.x. [DOI] [PubMed] [Google Scholar]
- Guo L, Ma Y, Sun DW, Wang P. Effects of controlled freezing-point storage at 0°C on quality of green bean as compared with cold and room-temperature storages. J Food Eng. 2008;86(1):25–29. doi: 10.1016/j.jfoodeng.2007.09.005. [DOI] [Google Scholar]
- James C, Lejay I, Tortosa N, Aizpurua X, James SJ. The effect of salt concentration on the freezing point of meat simulants. Int J Refrig. 2005;28:933–939. doi: 10.1016/j.ijrefrig.2005.01.011. [DOI] [Google Scholar]
- Kim HW, Kim JH, Seo JK, Setyabrata D, Kim YHB. Effects of aging/freezing sequence and freezing rate on meat quality and oxidative stability of pork loins. Meat Sci. 2018;139:162–170. doi: 10.1016/j.meatsci.2018.01.024. [DOI] [PubMed] [Google Scholar]
- Lan Y, Shang YB, Song Y, Dong Q. Changes in the quality of superchilled rabbit meat stored at different temperatures. Meat Sci. 2016;117:173–181. doi: 10.1016/j.meatsci.2016.02.017. [DOI] [PubMed] [Google Scholar]
- Lang Y, Sha K, Zhang R, Xie P, Luo X, Sun B, Li H, Zhang L, Zhang S, Liu X. Effect of electrical stimulation and hot boning on the eating quality of Gannan yak longissimus lumborum. Meat Sci. 2016;112:3–8. doi: 10.1016/j.meatsci.2015.10.011. [DOI] [PubMed] [Google Scholar]
- Li H, Li X, Zhang CH, Wang JZ, Tang CH, Chen LL. Flavor compounds and sensory profiles of a novel Chinese marinated chicken. J Sci Food Agric. 2016;96:1618–1626. doi: 10.1002/jsfa.7263. [DOI] [PubMed] [Google Scholar]
- Marusic N, Vidacek S, Janci T, Petrak T, Medic H. Determination of volatile compounds and quality parameters of traditional Istrian dry-cured ham. Meat Sci. 2014;96:1409–1416. doi: 10.1016/j.meatsci.2013.12.003. [DOI] [PubMed] [Google Scholar]
- Muela E, Sanudo C, Campo MM, Medel I, Beltran JA. Effect of freezing method and frozen storage duration on instrumental quality of lamb throughout display. Meat Sci. 2010;84:662–669. doi: 10.1016/j.meatsci.2009.10.028. [DOI] [PubMed] [Google Scholar]
- Olaoye OA, Ubbor SC, Lawrence IG. Assessment of the effect of different packaging materials on some quality indices of a Nigerian stick meat (Tsire) during storage. Adv Food Sci Eng. 2018;2:30–37. doi: 10.22606/afse.2018.21004. [DOI] [Google Scholar]
- O’Sullivan MG, Kerry JP. Sensory evaluation of fresh meat, University College Cork. Cambridge: Woodhead; 2009. pp. 178–196. [Google Scholar]
- Qi SJ, Huang H, Huang JY, Wang QY, Wei QY. Lychee (Litchi chinensis Sonn.) seed water extract as potential antioxidant and anti-obese natural additive in meat products. Food Control. 2015;50:195–201. doi: 10.1016/j.foodcont.2014.08.047. [DOI] [Google Scholar]
- Ruiz-Capillas C, Moral A. Correlation between biochemical and sensory quality indices in hake stored in ice. Food Res Int. 2001;34:441–447. doi: 10.1016/S0963-9969(00)00189-7. [DOI] [Google Scholar]
- Shahidi F, Pegg RB. Hexanal as an indicator of meat flavor deterioration. J Food Lipids. 1994;1:177–186. doi: 10.1111/j.1745-4522.1994.tb00245.x. [DOI] [Google Scholar]
- Song L, Gao T, Ma RX, Jiang Y, Zhang L, Li JL, Zhang X, Gao Feng, Zhou GH. Effect of different frozen storage temperatures and periods on the quality of chicken meatballs. J Food Process Preserv. 2017;41:e13042. doi: 10.1111/jfpp.13042. [DOI] [Google Scholar]
- Strange ED, Benedict RC, Smith JL, Swift CE. Evaluation of rapid tests for monitoring alterations in meat quality during storage: I. Intact meat. J Food Protect. 1977;40:843–847. doi: 10.4315/0362-028X-40.12.843. [DOI] [PubMed] [Google Scholar]
- Torngren MA, Darre M, Gunvig A, Bardenshtein A. Case studies of packaging and processing solutions to improve meat quality and safety. Meat Sci. 2018;144:149–158. doi: 10.1016/j.meatsci.2018.06.018. [DOI] [PubMed] [Google Scholar]
- Urmila K, Li HH, Chen QS, Hui Z, Zhao JW. Quantifying of total volatile basic nitrogen (TVB-N) content in chicken using a colorimetric sensor array and nonlinear regression tool. Anal Methods. 2015;7:5682–5688. doi: 10.1039/c5ay00596e. [DOI] [Google Scholar]
- Van BH, Amna T, Hwang I. Significant influence of particular unsaturated fatty acids and pH on the volatile compounds in meat-like model systems. Meat Sci. 2013;94:480–488. doi: 10.1016/j.meatsci.2013.04.029. [DOI] [PubMed] [Google Scholar]
- Wang CT, Jiang YM, Peng LI, Han L. Determination of flavor substances in the meat of Tianzhu white yak by SPME coupled to GC-MS. J Gansu Agric Univ. 2006;41:118–121. doi: 10.1016/S1872-2040(06)60047-9. [DOI] [Google Scholar]
- Wang Q, Zhao X, Ren Y, Fan E, Chang H, Wu H. Effects of high pressure treatment and temperature on lipid oxidation and fatty acid composition of yak (Poephagus grunniens) body fat. Meat Sci. 2013;94:489–494. doi: 10.1016/j.meatsci.2013.03.006. [DOI] [PubMed] [Google Scholar]
- Wang D, Duan CQ, Shi Y, Zhu BQ, Javed HU, Wang J. Free and glycosidically bound volatile compounds in sun-dried raisins made from different fragrance intensities grape varieties using a validated HS-SPME with GC–MS method. Food Chem. 2017;228:125–135. doi: 10.1016/j.foodchem.2017.01.153. [DOI] [PubMed] [Google Scholar]
- Wang ZM, He ZF, Gan X, Li HJ. Interrelationship among ferrous myoglobin, lipid and protein oxidations in rabbit meat during refrigerated and superchilled storage. Meat Sci. 2018;146:131–139. doi: 10.1016/j.meatsci.2018.08.006. [DOI] [PubMed] [Google Scholar]
- Zhang JH, Wang L, Liu Y, Zhu JH, Zhou GH. Changes in the volatile flavour components of Jinhua ham during the traditional ageing process. Int J Food Sci Technol. 2006;41:1033–1039. doi: 10.1111/j.1365-2621.2006.01163.x. [DOI] [Google Scholar]
- Zhang L, Sun BZ, Xie P, Li HP, Su HW, Sha K, Huang CX, Lei YH, Liu X, Wang H. Using near infrared spectroscopy to predict the physical traits of Bos grunniens meat. LWT Food Sci Technol. 2015;64:602–608. doi: 10.1016/j.lwt.2015.06.022. [DOI] [Google Scholar]
- Zhang JY, Yang ZY, Yang YY, Han L, Yu QL, Cao H, Zhang WH. Development of a flavor fingerprint by GC-MS with chemometric method for volatile compounds of yak and yellow cattle bone soup. Food Anal Methods. 2016;10:943–954. doi: 10.1007/s12161-016-0657-5. [DOI] [Google Scholar]
- Zhao LM, Zhang Y, Pan ZL, Venkitasamy C, Zhang LY, Xiong W, Guo SY, Xia H, Wl Liu. Effect of electron beam irradiation on quality and protein nutrition values of spicy yak jerky. LWT Food Sci Technol. 2018;87:1–7. doi: 10.1016/j.lwt.2017.08.062. [DOI] [Google Scholar]
- Zhou GH, Xu XL, Liu Y. Preservation technologies for fresh meat—a review. Meat Sci. 2010;86:119–128. doi: 10.1016/j.meatsci.2010.04.033. [DOI] [PubMed] [Google Scholar]
- Zhu Y, Ma L, Yang H, Xiao Y, Xiong YL. Super-chilling (−0.7°C) with high-CO2 packaging inhibits biochemical changes of microbial origin in catfish (Clarias gariepinus) muscle during storage. Food Chem. 2016;206:182–190. doi: 10.1016/j.foodchem.2016.03.053. [DOI] [PubMed] [Google Scholar]