

Abstract
The mitochondrial inner membrane can reshape under different physiological conditions. How, at which frequency this occurs in living cells, and the molecular players involved are unknown. Here, we show using state‐of‐the‐art live‐cell stimulated emission depletion (STED) super‐resolution nanoscopy that neighbouring crista junctions (CJs) dynamically appose and separate from each other in a reversible and balanced manner in human cells. Staining of cristae membranes (CM), using various protein markers or two lipophilic inner membrane‐specific dyes, further revealed that cristae undergo continuous cycles of membrane remodelling. These events are accompanied by fluctuations of the membrane potential within distinct cristae over time. Both CJ and CM dynamics depended on MIC13 and occurred at similar timescales in the range of seconds. Our data further suggest that MIC60 acts as a docking platform promoting CJ and contact site formation. Overall, by employing advanced imaging techniques including fluorescence recovery after photobleaching (FRAP), single‐particle tracking (SPT), live‐cell STED and high‐resolution Airyscan microscopy, we propose a model of CJ dynamics being mechanistically linked to CM remodelling representing cristae membrane fission and fusion events occurring within individual mitochondria.
Keywords: crista junction, cristae, membrane dynamics, membrane potential, STED nanoscopy
Subject Categories: Membrane & Intracellular Transport,
Live‐STED nanoscopy and complementary approaches reveal that mitochondrial crista junctions and cristae membranes are not static invaginations but highly dynamic, undergoing continuous remodeling events in a MICOS‐dependent manner.

Introduction
Mitochondria are vital organelles with key roles in energetics and metabolism of the cell. The ultrastructural morphology of this double‐membrane‐enclosed organelle is highly variable and altered in numerous human disorders 1, 2. The internal mitochondrial structure is characterized by invaginations of the inner membrane (IM) called cristae. The IM that closely remains apposed to the outer membrane (OM) is called the inner boundary membrane (IBM). The cristae membrane (CM) connects the IBM via a highly curved, circular or slit‐ or pore‐like structures called crista junctions (CJs) 1, 3, 4, 5, 6, 7. CJs are structurally conserved with a diameter of 12–40 nm and were proposed to act as diffusion barriers for proteins or metabolites 8, 9, 10, 11. Thus, the presence of CJs could create distinct mitochondrial subcompartments by separating IBM from CM and intermembrane space (IMS) from intracristal space (ICS). Indeed, the CM is enriched in proteins involved in oxidative phosphorylation (OXPHOS), mitochondrial protein synthesis or iron–sulphur cluster biogenesis, whereas the IBM mainly contains proteins involved in mitochondrial fusion and protein import 12. CJs could regulate bioenergetics by limiting the diffusion of ADP/ATP and affect the pH gradient across the IM 8, 9, 10, 11. As early as 1966, isolated mitochondria were known to occur in different morphological states, condensed (matrix condensed, high ADP, state III) or an orthodox (matrix expanded, low ADP, state IV) state, depending on the bioenergetic status 13, 14, 15. Later, tomographic images of mitochondria undergoing this transition indicated that remodelling of the IM occurs in isolated mitochondria 10. Cristae exist in different shapes and sizes depending on the physiological, bioenergetic or developmental cues 1, 10, 16. Moreover, the general ability of cristae or CJs to dynamically remodel is well exemplified during apoptosis, where widening of CJs is observed, promoting cytochrome c release from the ICS into the cytosol 17, 18. However, molecular mechanisms for cristae and CJs remodelling in response to metabolic and physiological adaptations are not known. Aberrant and altered cristae are associated with several human diseases including neurodegeneration, cancer, diabetes and cardiomyopathies 1, 19, but their relevance to disease progression is unclear.
The formation of CJs is likely to require an intricate partnership between phospholipids and scaffolding proteins 20, 21, 22. We identified that Fcj1 (formation of crista junction protein 1)/Mic60 resides preferentially at CJs in yeast, and its deletion leads to complete loss of CJs with cristae arranged as concentric stacks separate from the IBM. In addition, Fcj1/Mic60 and Su e/g (subunits of F 1 F o‐ATP synthase) act antagonistically to control F 1 F o‐ATP synthase oligomerization and thereby modulate formation of CJs and cristae tips 7. Several groups have identified a large oligomeric complex termed mitochondrial contact site and cristae organizing system (MICOS) which is required for the formation and maintenance of CJs and contact sites between IM and OM 23, 24, 25. The MICOS complex contains at least seven subunits in mammals: MIC10, MIC13, MIC19, MIC25, MIC26, MIC27 and MIC60 named after a uniform nomenclature 26. Mic60 and Mic10 are considered to be the core components of the MICOS complex in baker's yeast as their deletion causes complete loss of CJs. MIC60 has a binding interface for a variety of proteins including TOM complex, OPA1, SAM/TOB, Ugo1 (mammalian homolog SLC25A46), DnaJC11, CHCHD10, DISC1 (disrupted‐in‐schizophrenia 1) and is proposed to provide the scaffold for MICOS as well as contact between IM and OM 27, 28, 29, 30, 31, 32, 33, 34. Mic10 contains conserved glycine motifs in its transmembrane domain that are crucial for MIC10 self‐oligomerization and are required for the stability of CJs 35, 36, 37. Mic10 additionally interacts with the dimeric F1Fo‐ATP synthase and promotes its oligomerization 38, 39. Both Mic60 and Mic10 have the capability to bend membranes 35, 40, 41. Using complexome profiling, we identified MIC26/APOO and MIC27/APOOL as bona fide subunits of the MICOS complex 42, 43. Depletion or overexpression of MIC26 or MIC27 led to altered cristae morphology and reduced respiration. MIC27 binds to cardiolipin, the signature lipid in mitochondria 42. The non‐glycosylated form of MIC26 is a subunit of the MICOS complex, but not the glycosylated form 43. Recently, we and another group have discovered that MIC13/QIL1 is an essential component of the MICOS complex responsible for the formation of CJs 44, 45. Loss of MIC13 resulted in reduced levels of MIC10, MIC26 and MIC27, accompanied by impaired OXPHOS. The protein levels of MIC60, MIC19 and MIC25 remain unaltered, suggesting that MICOS comprises two subcomplexes: MIC60/25/19 and MIC10/13/26/27 with MIC13 acting as a bridge between both subcomplexes 44, 45. Altered levels of MICOS components and their interactors are associated with many human diseases such as epilepsy, Down syndrome, frontotemporal dementia–amyotrophic lateral sclerosis, optic atrophy, Parkinson's disease, diabetes and cardiomyopathy 2, 27, 46. Mutations in MIC60 have been found in Parkinson's disease 47. Mutations in MIC13/QIL1 lead to mitochondrial encephalopathy and hepatic dysfunction 48, 49, 50, 51.
Here, we studied cristae membrane remodelling in living cells and the role of MICOS complex in this context. To study systematically intramitochondrial dynamics of CJs and cristae, we devised a novel state‐of‐the‐art method of live‐cell STED super‐resolution nanoscopy using the C‐terminal SNAP‐tagged versions of distinct mitochondrial proteins marking CJs and cristae. Within individual mitochondria MIC10‐ and MIC60‐SNAP punctae marking CJs dynamically remodel to merge and split in a continuous and balanced manner. This occurred at a timescale of seconds and depends on the MICOS subunit MIC13. In conjunction, we observed that adjacent cristae marked by ATP5I‐SNAP and COX8A‐SNAP or by IM‐specific dyes undergo repeated cycles of membrane remodelling in a similar timescale of seconds. Using different approaches, including live‐cell STED after TMRM staining and photoactivation combined with high‐resolution Airyscan fluorescence microscopy, we provide strong support that the spatial apposition between two adjacent cristae leads to an exchange of content and that cristae can transiently stay separated from other cristae or the IBM. Overall, by improved spatial (~60 nm) and temporal (~1.5–2.5 s) resolution using live‐cell STED super‐resolution nanoscopy in combination with the SNAP‐tag technology and use of newly generated genetic cellular models lacking MICOS subunits, we resolved and characterized cristae membrane dynamics. Based on these findings, we propose a model linking CJ and CM dynamics and discuss the novel role of the MICOS complex and the physiological importance thereof.
Results
Mammalian MIC10 and MIC60 are required for cristae morphogenesis and cellular respiration
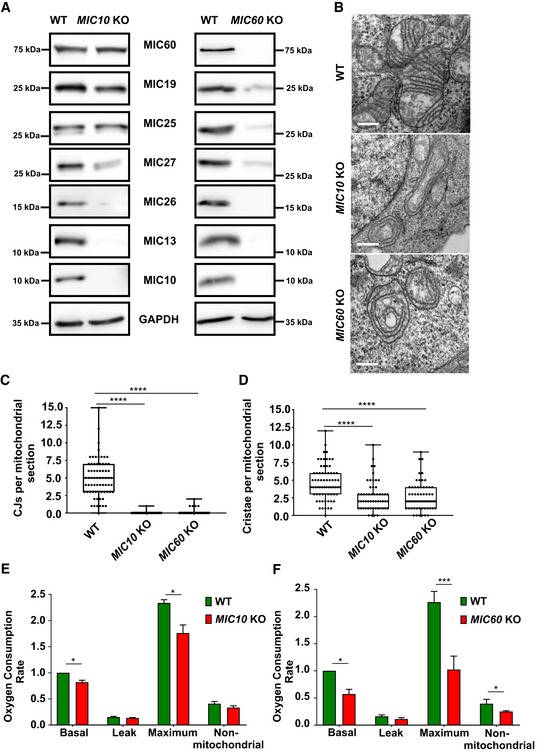
MIC60 and MIC10 are the core subunits of the MICOS complex that are also evolutionarily well conserved 52, 53. To better understand the role of these subunits in mammalian cells, we obtained human MIC10 and MIC60 knockout (KO) HAP1 cells. MIC10 KO and MIC60 KO have 29‐bp deletion in exon 1 and 10‐bp deletion in exon 8, respectively, leading to a frameshift and subsequent loss of the respective proteins (Fig 1A). Analysis of electron micrographs from these cells revealed that CJs are virtually absent in MIC10 and MIC60 KO cells (Fig 1B and C). The cristae membrane (CM) appears as concentric rings detached from the IBM (Fig 1B), consistent with earlier observations in baker's yeast and mammalian cells 7, 23, 24, 25, 54, 55. In addition, the abundance of cristae per mitochondrial section is reduced (Fig 1D). While the knockout of MIC10 primarily causes a selective destabilization of the MICOS subcomplex comprising MIC13, MIC26 and MIC27, loss of MIC60 results in a clear destabilization of all subunits of the MICOS complex (Fig 1A), confirming its role as a main scaffolding subunit of MICOS. The basal and the maximal oxygen consumption rates of MIC10 and MIC60 KOs are significantly decreased compared to controls (Fig 1E and F), confirming the role of CJs in ensuring full bioenergetic capacity.
Figure 1. MIC10 and MIC60 KO HAP1 cells show loss of crista junctions and impaired cellular respiration.
-
AWestern blot analysis of lysates from WT and MIC10 KO or MIC60 KO HAP1 cells. MIC10 KO cells show a drastic reduction in MIC13, MIC26 and MIC27 protein levels, while protein levels of other MICOS components remain unchanged. MIC60 KO cells show a drastic reduction in protein levels of all MICOS components.
-
BRepresentative electron micrographs of WT, MIC10 KO and MIC60 KO HAP1 cells. Scale bar 500 nm.
-
CQuantification of CJs per mitochondrial section from different mitochondria in WT, MIC10 and MIC60 KO HAP1 cells using EM represented as boxplots. Boxplots show median and interquartile range from 25 to 75 percentile, and whiskers represent minimum and maximum value. Data from n = 55–69 mitochondria (from two independent experiments) are shown as data points in the boxplots. ****P < 0.0001 (using unpaired Student's t‐test).
-
DQuantification of cristae per mitochondrial section from different mitochondria in WT, MIC10 and MIC60 KO HAP1 cells using EM represented as boxplots. Boxplots show median and interquartile range from 25 to 75 percentile, and whiskers represent minimum and maximum value. Data from n = 55–69 mitochondria (from two independent experiments) are shown as data points in the boxplots. ****P < 0.0001 (using unpaired Student's t‐test).
-
EComparison of oxygen consumption rates (pmol O2/s, normalized for cell numbers by Hoechst staining) of basal, proton leak, maximum and non‐mitochondrial respiration in WT and MIC10 KO cells obtained from three independent experiments. The data are normalized to basal respiration from HAP1 WT. Bar and error bar represent mean ± SEM from 3 independent experiments. *P = 0.034 for basal (using one‐sample t‐test) and *P = 0.018 for maximum respiration (using unpaired Student's t‐test).
-
FComparison of oxygen consumption rates (pmol O2/s, normalized for cell numbers by Hoechst staining) of basal, proton leak, maximum and non‐mitochondrial respiration in WT and MIC60 KO cells obtained from three independent experiments. The data are normalized to basal respiration from HAP1 WT. Bar and error bar represent mean ± SEM from three independent experiments. *P = 0.01 for basal (using one‐sample t‐test), ***P = 0.0004 for maximum respiration and *P = 0.012 for non‐mitochondrial respiration (using unpaired Student's t‐test).
CJs are dispensable for the regular arrangement of MIC60 in the IBM
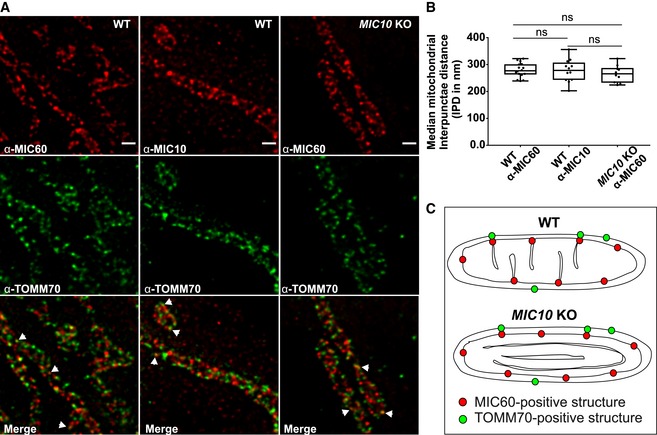
MICOS is a large oligomeric complex present at CJs. Using stimulated emission depletion (STED) super‐resolution images of fixed WT HAP1 cells, we show a regularly spaced arrangement of MIC10 and MIC60 punctae along the IBM (Fig 2A) consistent with earlier reports 56, 57. We determined the median distance between consecutive punctae of MIC10 and MIC60 for each mitochondrion and called it interpunctae distance (IPD). The median mitochondrial IPD was around 280 nm for both MIC10 and MIC60 in WT HAP1 cells under standard growth conditions (Fig 2B). Since MIC60 deletion leads to reduction in all proteins of MICOS, while loss of MIC10 still preserves MIC60 (Fig 1A), we asked whether MIC10 is required for the punctae‐like appearance of MIC60. Deletion of MIC10, albeit leading to a loss of CJs, did not disturb the regular arrangement of MIC60 punctae along the mitochondrial length (Fig 2A). In line with this, the median IPD per mitochondrion of MIC60 in control and MIC10 KO cells was not significantly different (Fig 2B). Since lack of CJs together with loss of the MIC10/13/26/27 subcomplex did not alter the spatial arrangement of MIC60, we conclude that CJs are not necessary for regular spacing of MIC60 in the IBM (Fig 2C). We further analysed whether loss of MIC10 impairs formation of contact sites between the IM and OM marked by colocalization of MIC60 and TOMM70; two protein markers reported to be present at the contact sites in baker's yeast 23. STED super‐resolution nanoscopy after double immunostaining of HAP1 cells with antibodies against MIC60 and TOMM70 showed similar patterns of partial colocalization (Fig 2A, merge panel, arrowheads) in WT and MIC10 KO cells, suggesting that MIC60/TOMM70‐positive contact sites are still formed and maintained in MIC10 KO cells. This supports the conclusion that MIC60 is positioned at uniform distances in the IBM, which are partially linked to the OM at contact sites, and that MIC60 represents a docking and scaffolding platform for other MICOS subunits (Fig 2C) such as MIC10 for CJ formation. This is consistent with an earlier report using confocal fluorescence microscopy in baker′s yeast 58.
Figure 2. MIC60 assembles as regularly spaced punctae in the absence of CJs.
-
ARepresentative STED super‐resolution images of WT and MIC10 KO HAP1 cells immunostained with MIC60 or MIC10 antibodies (top panel) and TOMM70 (middle panel). Bottom panel shows merged images. Arrowheads show colocalization of MIC60 and TOMM70 punctae. Scale bar 500 nm.
-
BQuantification of median interpunctae distance (IPD) per mitochondrion between MIC60 and MIC10 punctae in indicated cell lines represented by boxplots. Boxplots show median and interquartile range from 25 to 75 percentile, and whiskers represent minimum and maximum value. Median IPD from n = 10–16 mitochondria (from two independent experiments) is shown as data points in the boxplots. ns, not significant, unpaired Student's t‐test.
-
CScheme shows MIC60 marking the nascent sites of CJ formation independent of MIC10 and presence of contact sites in WT and MIC10 KO HAP1 cells shown by colocalization of MIC60 and TOMM70.
Crista junction proteins show a markedly reduced mobility in the inner membrane, and loss of MIC13 affects the mobility of distinct inner membrane proteins
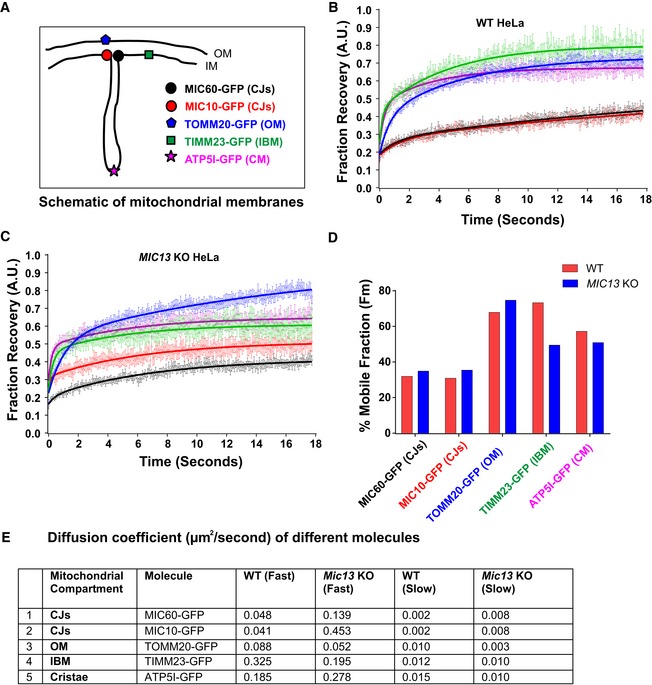
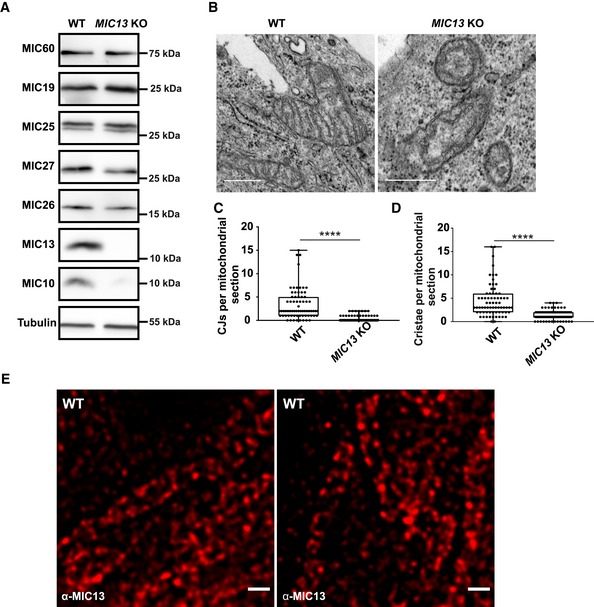
We asked how mobile the two core MICOS subunits, MIC60 and MIC10, are compared to other membrane proteins localized to different mitochondrial subcompartments. We constructed GFP‐tagged versions of MIC60/MIC10, TOMM20, TIMM23 and ATP5I, established markers of CJs, OM, IBM and CM, respectively (Fig 3A), and performed fluorescence recovery after photobleaching (FRAP) experiments. For TOMM20, TIMM23 and ATP5I, we observed substantially shorter T1/2 recovery times, higher diffusion coefficients and higher mobile fractions than for MIC10 and MIC60, demonstrating that CJ proteins are more restricted in movement compared to membrane proteins of other mitochondrial complexes present in various subcompartments (Fig 3B, D and E, Appendix Fig S1F). In line with this, MIC60 was reported to show restricted diffusion in the IM compared to OM proteins in another study 59. To know whether the mobility of these proteins depends on the presence of a fully assembled MICOS complex, which is essential for formation of CJs, we generated MIC13 KO HeLa cells that are well suited for microscopy of mitochondria. Consistent with prior reports 44, 45, we observed a loss of MIC10, MIC26, MIC27, altered cristae morphology and loss of CJs in MIC13 KO HeLa cells (Fig EV1A–D). Upon deletion of MIC13, in particular the diffusion coefficients of TIMM23 and MIC10 were altered to a major extent but less for MIC60 (Fig 3C–E, Appendix Fig S1A, B, D and F). The latter is consistent with our finding that MIC60 can arrange in regularly spaced punctae in the absence of other MICOS subunits (Fig 2). Interestingly, the loss of MIC13 decreases the mobile fraction of TIMM23 considerably. As in baker's yeast, Tim23 was shown to dynamically redistribute between the CM and the IBM in a manner dependent on mitochondrial protein import 12, we propose that the decreased TIMM23 mobile fraction in cells lacking CJs is due to trapping of a fraction of TIMM23 in the CM providing experimental support for the role of CJs as “gates” between the CM and the IBM and acting as diffusion barriers. This view is also supported by a very recent study showing that cristae behave as independent units within a single mitochondrion and can even adopt distinct levels of membrane potential 60. Moreover, the mobility of MIC10 increases drastically in MIC13 KO HeLa cells compared to WT cells, in line with the view that MIC13 is required for specifically stabilizing MIC10 at the MICOS complex 44, 45.
Figure 3. Mobility of crista junction proteins is restricted compared to proteins of other mitochondrial subcompartments, and loss of MIC13 affects the mobility of distinct IM proteins.
-
AScheme of investigated marker proteins, subjected to FRAP, located at different mitochondrial subcompartments.
-
B, CFRAP curves (curve fitted) of WT (B) and MIC13 KO HeLa cells (C) expressing GFP‐tagged fusion proteins of MIC60 (CJs), MIC10 (CJs), TOMM20 (OM), TIMM23 (IBM) and ATP5I (CM). Average FRAP curves (intensities in arbitrary units) for each marker were obtained (three independent experiments, 6–10 mitochondria for each experiment). Error bars for each time point representing SEM are shown.
-
DHistogram showing average percentage of mobile fractions, obtained from curve fits of all mitochondria expressing GFP‐tagged versions of MIC60 (CJs), MIC10 (CJs), TOMM20 (OM), TIMM23 (IBM) and ATP5I (CM) in WT and MIC13 KO HeLa cells (data calculated from FRAP curves shown in B and C that are obtained from three independent experiments, 6–10 mitochondria from each experiment).
-
EDiffusion coefficients of the above‐mentioned proteins are shown in the table.
Figure EV1. Deletion of MIC13 in HeLa cells leads to a loss of crista junctions.
-
AWestern blot analysis of WT and MIC13 KO HeLa cells showing a reduction in MIC10, MIC26 and MIC27 protein levels in MIC13 KOs.
-
BRepresentative electron micrographs of WT and MIC13 KO HeLa cells show loss of CJs in MIC13 KOs. Scale bar 500 nm.
-
CBoxplot showing quantification of CJs per mitochondrial section from different mitochondria in WT and MIC13 KO HeLa cells represented as boxplots. Boxplots show median and interquartile range from 25 to 75 percentile, and whiskers represent minimum and maximum value. Data from n = 70–90 mitochondria (from two independent experiments) are shown as data points in the boxplots. ****P < 0.0001 (WT versus MIC13 KO), unpaired Student's t‐test.
-
DBoxplot showing quantification of cristae per mitochondrial section in WT and MIC13 KO HeLa cells represented as boxplots. Boxplots show median and interquartile range from 25 to 75 percentile, and whiskers represent minimum and maximum value. Data from n = 70–90 mitochondria (from two independent experiments) are shown as data points in the boxplots. ****P < 0.0001, unpaired Student's t‐test.
-
ERepresentative STED super‐resolution images of WT HeLa cells stained with anti‐MIC13 antibody shows punctate distribution of MIC13. Scale bar 500 nm.
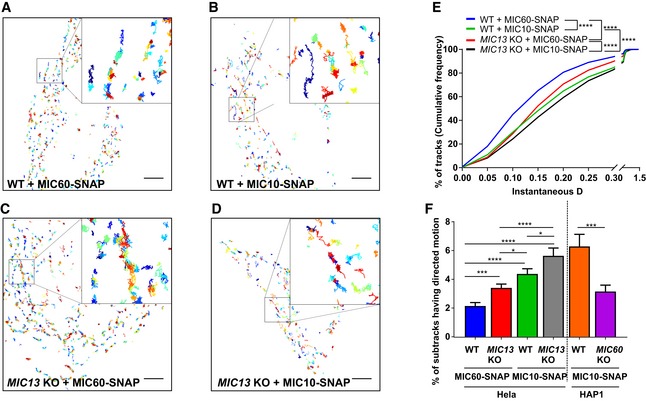
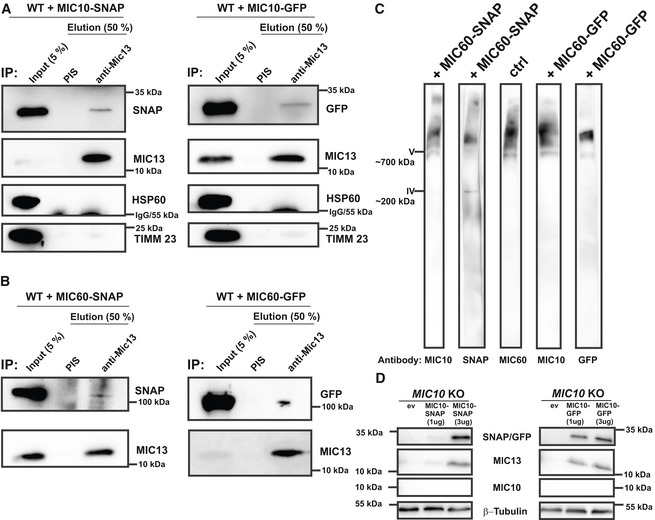
To study the mobility of MIC10 and MIC60 by a different approach, we used single‐particle tracking (SPT) technique (Fig 4). For this, we constructed the SNAP‐tagged versions of MIC60 and MIC10 and confirmed their functionality as revealed by coimmunoprecipitation using anti‐MIC13 antibodies (Fig EV2A and B), BN‐PAGE analysis (Fig EV2C) and restoration of MIC13 levels upon MIC10 expression (Fig EV2D). This confirmed that the tagging of MIC10 and MIC60 with SNAP or GFP does not interfere with their function and proper incorporation into MICOS complex. Using SPT data, we observed that on average, MIC60‐SNAP showed a smaller instantaneous diffusion coefficient (insD) compared to MIC10‐SNAP (Fig 4A, B and E), consistent with the view that MIC60 represents regularly arranged nascent sites priming CJ and contact site formation which has to be steadily positioned. Deletion of MIC13 led to a significant shift of tracks towards long‐range movements (increased instantaneous diffusion coefficient; insD) of both MIC10 and MIC60 suggesting an increased mobility in both cases (Fig 4C–E). This is fully in line with the FRAP data and the interpretation that the MICOS complex is not fully assembled in MIC13 KO cells. Further, in order to obtain a better understanding of the dynamic behaviour of individual single particles, each track was further subdivided into subtracks based on confinement in increasing order of directionality as confined diffusion, subdiffusion, normal diffusion or directed motion (Fig 4F, Appendix Fig S2E–L). The percentage of subtracks showing directed motion is significantly higher for MIC10 than for MIC60 in WT HeLa cells, suggesting a considerably higher directionality for MIC10 (Fig 4F and Appendix Fig S2E). Additionally, directed motion of both MIC10 and MIC60 is significantly higher in MIC13 KO cells compared to WT (Fig 4F and Appendix Fig S2E), indicating that both subunits, when present in the fully assembled MICOS complex, have lower directed motion compared to when the MICOS complex exists in separate subcomplexes. Intriguingly, MIC10‐directed motion in MIC60 KOs is significantly reduced compared to control cells, indicating that the presence of MIC60 is specifically required for the enhanced directed motion of MIC10 (Fig 4F and Appendix Fig S2A–D). This suggests that MIC10 is recruited to the MICOS complex via MIC60. We propose that MIC60 acts as a docking platform pioneering CJ formation, consistent with our findings in this study (Fig 2).
Figure 4. Single‐particle tracking reveals requirement of MIC60 for high directionality of MIC10 motion.
-
A–DRepresentative single‐particle tracks of cells expressing MIC60‐ (A) and MIC10‐SNAP (B) in WT HeLa cells and MIC60‐ (C) and MIC10‐SNAP (D) in MIC13 KO HeLa cells, stained with silicon rhodamine dye and imaged at a rate of 33 ms/frame. Single tracks were colour‐coded according to temporal appearance. Scale Bar 5 μm. Insets in each image show zoomed‐in images of few representative tracks.
-
ECumulative frequency of tracks having corresponding values of instantaneous diffusion coefficients (insD) in WT and MIC13 KO HeLa cells expressing MIC60‐ and MIC10‐SNAP stained with silicon rhodamine. Number of tracks analysed (obtained from two independent experiments): n = 2,541, 2,540, 3,560 and 1,441 in WT HeLa cells expressing MIC60‐SNAP and MIC10‐SNAP, MIC13 KO HeLa cells expressing MIC60‐SNAP and MIC10‐SNAP, respectively. (****P ≤ 0.0001 for all possible comparisons, unpaired Student's t‐test).
-
FPercentage of subtracks having directed motion in WT and MIC13 KO HeLa cells expressing MIC60‐ and MIC10‐SNAP and in WT and MIC60 KO HAP1 cells expressing MIC10‐SNAP. Number of corresponding subtracks analysed (obtained from two independent experiments): n = 2,561, 2,443, 3,402, 1,360, 561 and 1,110. Data are mean ± SEM. *P ≤ 0.05, ***P ≤ 0.001, ****P ≤ 0.0001, unpaired Student's t‐test.
Figure EV2. Functionality and localization of MIC10 and MIC60 are not impaired by C‐terminal protein tags.
-
A, BHEK293 cells expressing either MIC10‐SNAP/GFP (A) or MIC60‐SNAP/GFP (B) were used for coimmunoprecipitation using anti‐MIC13 antibody. Endogenous MIC13 could pull down MIC10‐SNAP or MIC10‐GFP (A) as well as MIC60‐SNAP or MIC60‐GFP (B).
-
CIsolated mitochondria expressing MIC60‐SNAP or MIC60‐GFP were probed for proper incorporation of fusion proteins into the native MICOS complex. The complex containing MIC60‐GFP or MIC60‐SNAP runs at similar molecular weight as MICOS complex in native state marked by MIC60 or MIC10 antibody, confirming their incorporation into native complex.
-
DMIC10 KO HAP1 cells expressing an empty vector (ev), 1 and 3 μg of MIC10‐SNAP/GFP and probed with antibodies against SNAP/GFP, MIC10 and MIC13. MIC13 protein levels in MIC10 KO HAP1 cells are rescued by the expression of MIC10‐SNAP (3 μg) and MIC10‐GFP (1 and 3 μg) showing that the GFP and SNAP tags do not interfere with the MIC10 function.
Crista junctions dynamically move within the inner membrane in a reversible and balanced manner
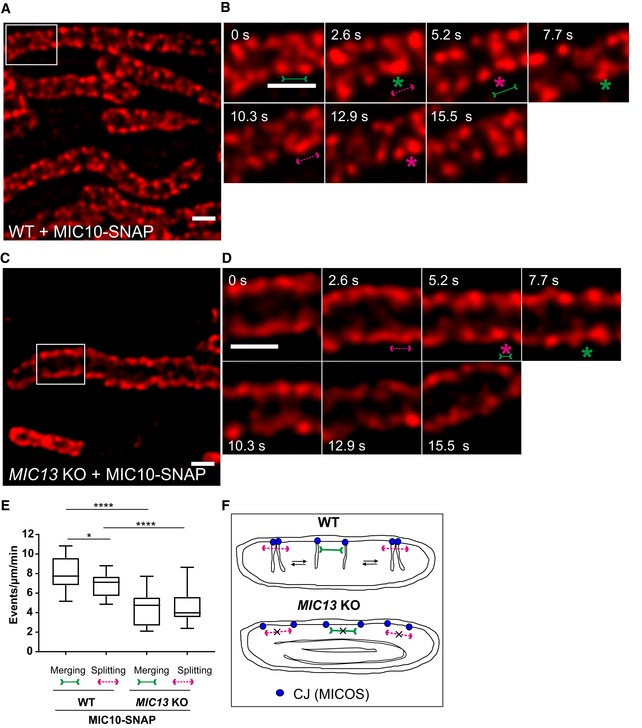
FRAP and SPT data provided insights about the mobility of MIC10 and MIC60 as a group of molecules and individual MIC10 and MIC60 molecules within the IBM, respectively. As immunostaining of MIC10 and MIC60 revealed regularly arranged CJ punctae using STED nanoscopy (Fig 2A), we further asked if CJs are dynamic and if so at what timescale individual CJs move. For this, we devised a novel method to perform live‐cell STED super‐resolution nanoscopy using MIC60‐SNAP and MIC10‐SNAP as markers of CJs. SNAP‐tag, a well‐characterized protein tag, binds covalently to silicon rhodamine 61, 62 and allows high‐resolution imaging with minimal fluorophore bleaching 63. The functionality and the proper incorporation of MIC10‐ and MIC60‐SNAP into the MICOS complex were verified as described before (Fig EV2). The MIC10‐SNAP and MIC60‐SNAP fusion proteins were arranged in a regularly spaced punctae‐like pattern across the IBM (Figs 5A and EV3A) as shown for the endogenous proteins using immunostaining (Fig 2A), providing further evidence for proper localization of the tagged constructs. We were able to image MIC10‐ and MIC60‐SNAP for ~15 s at least every 2.6 s. While mitochondria as a whole stay relatively static during this observation time, we observed rapid movements of MIC10/MIC60‐SNAP punctae during this short time period (Movies EV1 and EV2), demonstrating that CJs show an unexpectedly pronounced dynamic behaviour at a timescale of seconds. We repeatedly visualized these movies, by going back and forth between consecutive frames, to check for a possible regular pattern of MIC10 or MIC60 movement within a mitochondrion. Firstly, we focused on MIC10‐SNAP and manually tracked the individual punctae of MIC10 in subsequent frames (Fig 5A and B, Movie EV3). We observed numerous instances where two MIC10‐SNAP punctae rapidly merged into one visible puncta, split and re‐merged at a timescale of seconds (Fig 5B, Movie EV3). The term “merging” of two fluorescent MIC10/MIC60‐positive punctae implies a proximity of ~60 nm or less due to the given spatial resolution of 50–60 nm using STED nanoscopy. We blindly quantified the occurrence of merging/splitting events of visible puncta per unit length of mitochondria and found that the numbers for merging and splitting events per time were similar, indicating that these events are balanced and possibly coupled (Fig 5E). MIC60‐SNAP showed a very similar pattern of merging and splitting of adjacent punctae (Fig EV3A, B and E, Movie EV4) which also occurred at a similar temporal frequency compared to MIC10‐SNAP punctae. We conclude that CJs marked by MICOS subunits in WT cells dynamically merge and split in a reversible and balanced manner at a timescale of seconds.
Figure 5. Crista junctions marked by MIC10‐SNAP dynamically merge and split within a mitochondrion in a MIC13‐dependent manner.
-
A–DRepresentative live‐cell STED super‐resolution images (t = 0 s) showing WT (A) and MIC13 KO (C) HeLa cells expressing MIC10‐SNAP stained with silicon rhodamine. Box in (A and C) mark selection shown as a zoom in panel (B and D), respectively. Scale bar 500 nm. Time‐lapse image series of a mitochondrion expressing MIC10‐SNAP in WT (B) and MIC13 KO (D) HeLa cells (2.6 s/frame). Green and magenta asterisks show merging and splitting events of MIC10‐SNAP, respectively. Green arrows pointing inward connected by solid line and magenta arrows pointing outward connected by dotted line show sites of imminent merging and splitting events, respectively. Scale bar 500 nm.
-
EBlind quantification of merging and splitting events of CJs in WT and MIC13 KO HeLa cells expressing MIC10‐SNAP (three independent experiments, 5–8 mitochondria for each experiment) represented as boxplots. Boxplots show median and interquartile range from 25 to 75 percentile, and whiskers represent minimum and maximum value. *P = 0.026 (merging and splitting events in WT cells) and ****P < 0.0001 (merging and splitting events of WT versus MIC13 KO), unpaired Student's t‐test.
-
FScheme representing the dynamic nature of CJs in WT and MIC13 KO cells.
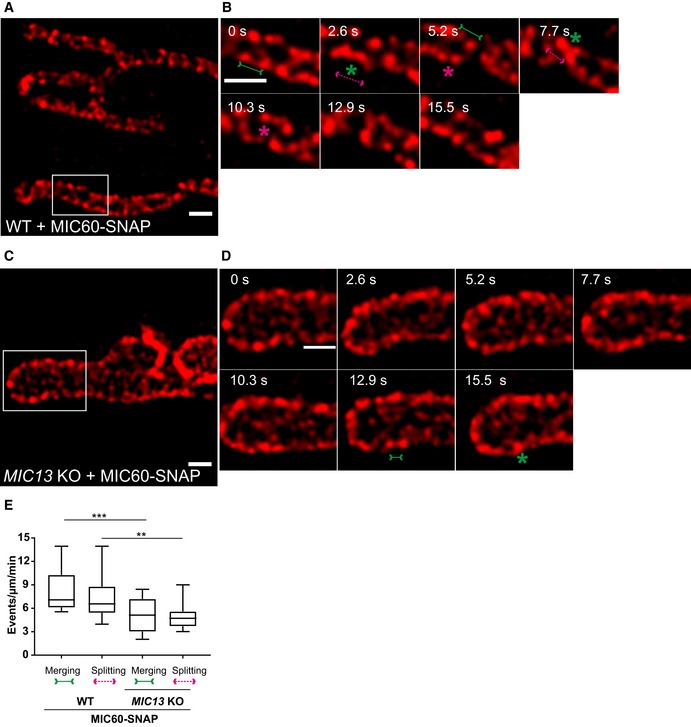
Figure EV3. Crista junctions marked by MIC60‐SNAP dynamically merge and split within a mitochondrion in a MIC13‐dependent manner.
-
ARepresentative live‐cell STED super‐resolution images (t = 0 s) showing WT HeLa cells expressing MIC60‐SNAP stained with silicon rhodamine. Box in (A) marks selection shown as a zoom in panel (B). Scale bar 500 nm.
-
BTime‐lapse image series of a mitochondrion expressing MIC60‐SNAP in WT HeLa cells (2.6 s/frame). Green and magenta asterisks show merging and splitting events of MIC60‐SNAP, respectively. Green arrows pointing inward connected by solid line and magenta arrows pointing outward connected by dotted line show sites of imminent merging and splitting events, respectively. Scale bar 500 nm.
-
CRepresentative live‐cell STED super‐resolution images (t = 0 s) showing MIC13 KO HeLa cells expressing MIC60‐SNAP stained with silicon rhodamine. Box in (C) marks selection shown as a zoom in panel (D). Scale bar 500 nm.
-
DTime‐lapse image series of a mitochondrion expressing MIC60‐SNAP in MIC13 KO HeLa cells (2.6 s/frame). Green and magenta asterisks show merging and splitting events of MIC60‐SNAP, respectively. Green arrows pointing inward connected by solid line and magenta arrows pointing outward connected by dotted line show sites of imminent merging and splitting events, respectively. Scale bar 500 nm.
-
EBlind quantification of merging and splitting events of CJs in WT and MIC13 KO HeLa cells expressing MIC60‐SNAP represented as boxplots. Boxplots show median and interquartile range from 25 to 75 percentile, and whiskers represent minimum and maximum value. Data obtained from three independent experiments, 5–7 mitochondria for each experiment. ***P = 0.0008 (merging events WT versus MIC13 KO) and **P = 0.0019 (splitting events WT versus MIC13 KO), unpaired Student's t‐test.
CJ dynamics occur in a MIC13‐dependent manner
To test whether the dynamic behaviour of MIC60‐SNAP punctae depends on the presence of a fully assembled MICOS complex, we analysed dynamics of MIC60‐SNAP in MIC13 KO cells. We again observed the regular arrangement of MIC60‐SNAP punctae in the IBM of mitochondria in MIC13 KO cells (Fig EV3C) consistent with our observation that MIC60 forms regularly arranged punctae also in the absence of MIC10 (Fig 2). MIC60‐SNAP punctae showed dynamic movements in MIC13 KO cells (Fig EV3D, Movie EV5); however, this occurred at a markedly reduced frequency when compared to WT HeLa cells (Fig EV3C and E, Movie EV5). This indicates that, although the regular arrangement of MIC60 in principle is unaltered, the movement of MIC60‐positive punctae, reflected normally by balanced merging and splitting events, is drastically impaired in the absence of CJs in MIC13 KO cells. We also expressed MIC10‐SNAP in MIC13 KOs and found that MIC10‐positive punctae are dynamic, yet the merging and splitting events of these punctae were markedly reduced compared to WT cells (Fig 5C–E). These observations indicate that the extent of CJ dynamics depends on a functional MIC13‐containing MICOS complex, which would be needed for cristae to be connected to the IBM via CJs (Fig 5F).
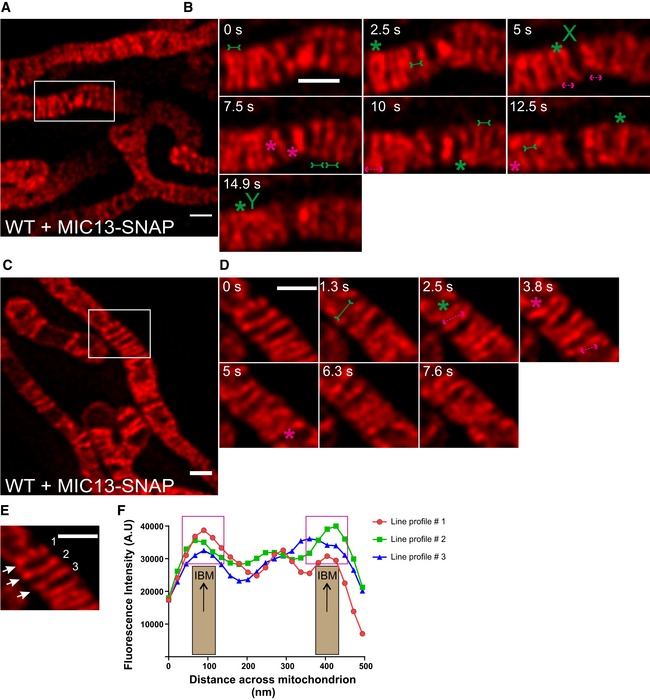
To further corroborate our findings on CJ dynamics, we decided to analyse the movement of MIC13‐SNAP, another marker for CJs, in WT HeLa cells. Different from MIC60 or MIC10, we observed that the staining pattern of MIC13‐SNAP not only marked regularly arranged punctae in the IBM but also labelled transverse bridges across mitochondria resembling cristae membranes (Figs 6A–D and EV4A–D (raw data)). This dual distribution of MIC13‐SNAP with maximal intensity at the IBM region is illustrated using line scans of fluorescence intensities along three cristae (Fig 6E and F), suggesting that MIC13‐SNAP is dually localized to both CJs and cristae. As endogenous MIC13 in WT HeLa cells is mostly found as punctae in the IBM region (Fig EV2E), we attribute the partial localization of MIC13 to cristae to excess of MIC13‐SNAP in the IM. Earlier studies have shown the partial occurrence of MICOS subunits in the CM and at cristae tips as well 7, 23, 28, 56. Nevertheless, in this context this is even beneficial as it allows us to visualize cristae and CJs at the same time. We analysed the movement of MIC13‐SNAP in live‐cell STED nanoscopy and observed dynamics of both CJs and CMs at a timescale of seconds (Movie EV6). We not only observed merging and splitting events of CJs as shown by MIC10‐SNAP and MIC60‐SNAP, but also dynamic movement of cristae attached to these CJs (Fig 6B and D). Upon careful analysis, we observed several instances showing that, when two CJs move towards each other, reaching a proximity of ~60 nm or less based on the spatial resolution of STED nanoscopy, they also bring along adjoining cristae close to each other generating the appearance that two cristae originate from one region in the IBM resembling the letter “V” (Figs 6B and EV4B (raw data), from 0 to 2.5 s, Movie EV7). Moreover, we observe other occasions where the fluorescence staining of cristae rather appeared to merge internally, along the length of other cristae, sometimes forming structures resembling the letters “X” and “Y” (Figs 6B and EV4B (raw data) at 5 and 14.9 s, respectively). In many instances, such events are directly followed by a crista splitting event at or near the site of the prior merging event (Figs 6B and EV4B (raw data), arrows pointing outward). To better visualize these events, we acquired images every 1.3 s and also found numerous examples of apparently linked merging and splitting events of cristae (Figs 6C and D, and EV4C and D (raw data), Movies EV8 and EV9). We propose that cristae undergo dynamic and continuous events of membrane remodelling, in a way resembling the cycles of merging and splitting observed for CJs.
Figure 6. MIC13‐SNAP shows that CJs and cristae undergo remodelling at a timescale of seconds.
-
ARepresentative live‐cell STED super‐resolution images (t = 0 s), showing WT HeLa cells expressing MIC13‐SNAP, from a time‐series of images acquired at a time interval of 2.5 s stained with silicon rhodamine. Box in (A) marks selection shown as a zoom in panel (B). Scale bar 500 nm.
-
BTime‐lapse image series of a mitochondrion expressing MIC13‐SNAP imaged at a time interval of 2.5 s/frame. Green and magenta asterisks show cycles of cristae merging and splitting marked by MIC13‐SNAP. Green arrows pointing inward connected by solid line and magenta arrows pointing outward connected by dotted line show sites of imminent merging and splitting events, respectively. Cristae mergence events that form structure resembling letter “X” or “Y” are marked at 5 or 14.9 s, respectively. Scale bar 500 nm.
-
CRepresentative live‐cell STED super‐resolution images (t=0 s), showing WT HeLa cells expressing MIC13‐SNAP, from a time‐series of images acquired at a time interval of 1.3 s stained with silicon rhodamine. Box in (C) marks selection shown as a zoom in panel (D). Scale bar 500 nm.
-
DTime‐lapse image series of a mitochondrion expressing MIC13‐SNAP imaged at a time interval of 1.3 s/frame. Green and magenta asterisks show cycles of cristae merging and splitting marked by MIC13‐SNAP. Green arrows pointing inward connected by solid line and magenta arrows pointing outward connected by dotted line show sites of imminent merging and splitting events, respectively. Scale bar 500 nm.
-
EFirst image from (D) was used for showing the intensity profiles along the length of three cristae (numbered 1–3 and marked with white arrows) in (F).
-
FIntensity profiles of lines drawn across the length of cristae show increased intensities at the edges of the line scans representing the IBM. Magenta boxes depict intensity maxima at IBM.
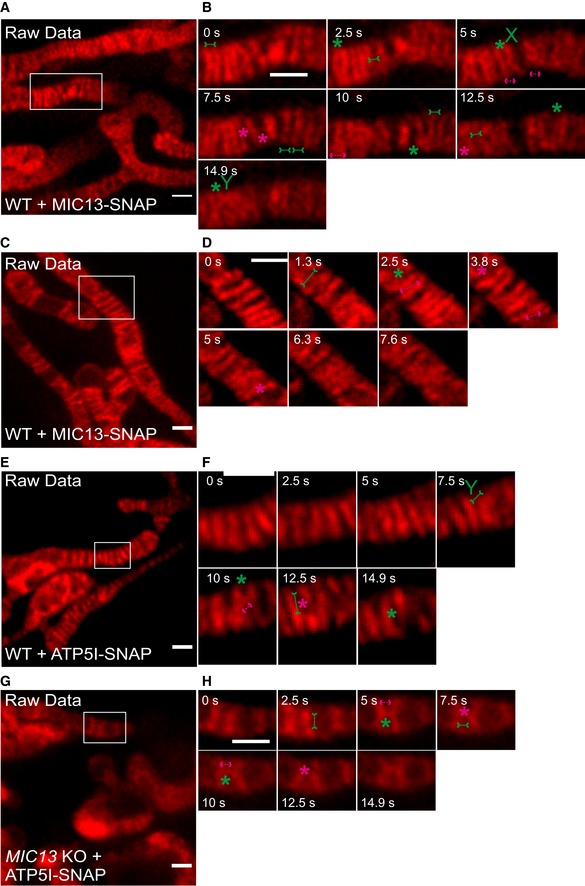
Figure EV4. Raw data of CJ and cristae dynamics.
-
ARaw data of live‐cell STED super‐resolution images (t = 0 s) showing WT HeLa cells expressing MIC13‐SNAP stained with silicon rhodamine. Box in (A) marks selection shown as a zoom in panel (B). Raw data used for Fig 6A. Scale bar 500 nm.
-
BRaw data of time‐lapse image series of a mitochondrion expressing MIC13‐SNAP in WT HeLa cells (2.5 s/frame). Green and magenta asterisks show merging and splitting events of cristae, respectively. Green arrows pointing inward connected by solid line and magenta arrows pointing outward connected by dotted line show sites of imminent merging and splitting events, respectively. Green “X” and “Y” represent X‐ and Y‐type imminent mergence events. Raw data used for Fig 6B. Scale bar 500 nm.
-
CRaw data of live‐cell STED super‐resolution images (t = 0 s) showing WT HeLa cells expressing MIC13‐SNAP stained with silicon rhodamine. Box in (C) marks selection shown as a zoom in panel (D). Raw data used for Fig 6C. Scale bar 500 nm.
-
DRaw data of time‐lapse image series of a mitochondrion expressing MIC13‐SNAP in WT HeLa cells (2.5 s/frame). Green and magenta asterisks show merging and splitting events of cristae, respectively. Green arrows pointing inward connected by solid line and magenta arrows pointing outward connected by dotted line show sites of imminent merging and splitting events, respectively. Raw data used for Fig 6D. Scale bar 500 nm.
-
ERaw data of live‐cell STED super‐resolution images (t = 0 s) showing WT HeLa cells expressing ATP5I‐SNAP stained with silicon rhodamine. Box in (E) marks selection shown as a zoom in panel (F). Raw data used for Fig 7A. Scale bar 500 nm.
-
FRaw data of time‐lapse image series of a mitochondrion expressing ATP5I‐SNAP in WT HeLa cells (2.5 s/frame). Green and magenta asterisks show merging and splitting events of cristae respectively. Green arrows pointing inward connected by solid line and magenta arrows pointing outward connected by dotted line show sites of imminent merging and splitting events, respectively. Green “X” and “Y” represent X‐ and Y‐type imminent merging events. Raw data used for Fig 7B. Scale bar 500 nm.
-
GRaw data of live‐cell STED super‐resolution images (t = 0 s) showing MIC13 KO HeLa cells expressing ATP5I‐SNAP stained with silicon rhodamine. Box in (G) marks selection shown as a zoom in panel (H). Raw data used for Fig 7C. Scale bar 500 nm.
-
HRaw data of time‐lapse image series of a mitochondrion expressing ATP5I‐SNAP in MIC13 KO HeLa cells (2.5 s/frame). Green and magenta asterisks show merging and splitting events of cristae marked by ATP5I‐SNAP, respectively. Green arrows pointing inward connected by solid line and magenta arrows pointing outward connected by dotted line show sites of imminent merging and splitting events, respectively. Raw data used for Fig 7D. Scale bar 500 nm.
Cristae membrane dynamics depends on the MICOS complex
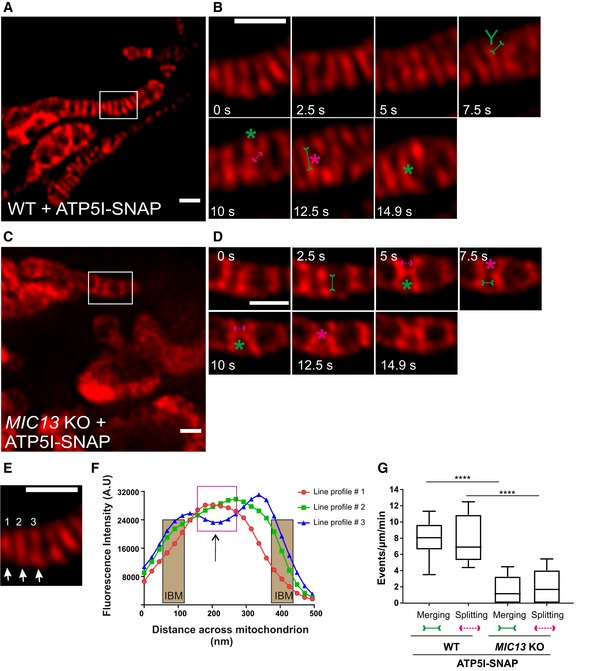
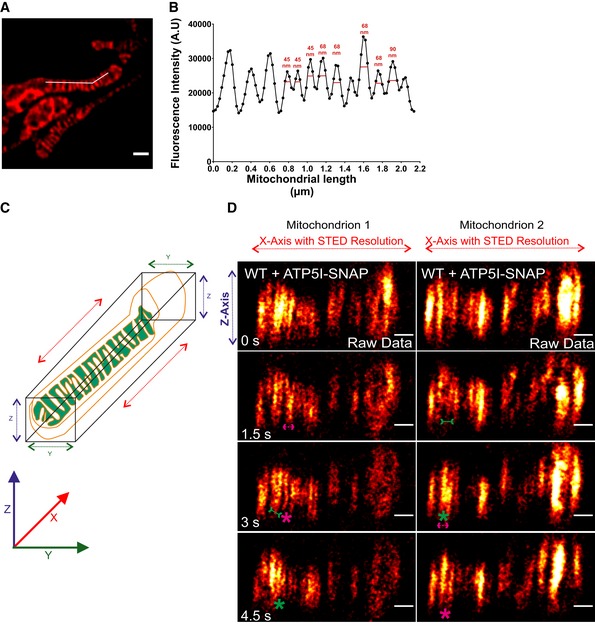
To substantiate our initial observation of cristae membrane dynamics using MIC13‐SNAP, we obtained SNAP‐tagged versions of bona fide cristae markers, ATP5I and COX8A of F1FO ATP synthase and complex IV, respectively. HeLa cells expressing ATP5I‐SNAP and COX8A‐SNAP were imaged by live‐cell STED super‐resolution nanoscopy. The STED images of both ATP5I and COX8A showed transversely spanning bridges across the mitochondria (Fig 7A, Appendix Fig S3A), consistent with electron micrographs of cristae in HeLa cells. ATP5I‐SNAP shows maximum fluorescence intensities in the centre of cristae in exemplary line scans (Fig 7E and F) in accordance with ATP5I, a subunit of F1FO ATP synthase complex, primarily located within the cristae and less at the IBM. Further, intensity profiles of line scans perpendicular to cristae (Figs 7A and EV5A) show that we can resolve adjacent cristae that are only ~50–60 nm apart (Fig EV5B) using live‐cell STED imaging. Cristae were rapidly changing their position in consecutive timeframes confirming that cristae visualized with ATP5I‐SNAP and COX8A‐SNAP are dynamic within mitochondria at a timescale of seconds (Fig 7B, Appendix Fig S3B and Movie EV10). We observed several instances where the fluorescence signals of ATP5I‐/COX8A‐SNAP‐positive cristae merged either across the IBM (transverse‐type mergence) or along their length (X‐ or Y‐type mergence) (Fig 7B, Appendix Fig S3B, Movies EV11 and EV12), consistent with our observations using MIC13‐SNAP (Fig 6). Again, most of the instances of merging events were accompanied by a subsequent splitting event (Figs 7B, and EV4E and F (raw data), Appendix Fig S3B). We also observed merging and splitting events of fluorescence signals when we acquired images in XZ dimension (Z‐axis, diffraction‐limited confocal imaging; X‐axis STED super‐resolution (Fig EV5C and D). This strongly suggests that parallel oriented cristae sheets shown here in the z‐axis do not simply overlap in different planes along the z‐axis but indeed appose each other as close as ~60 nm or less in a reversible manner within a single mitochondrion. Next, we performed a blind quantification of the rate of merging and splitting events of respective fluorescence signals per unit length of mitochondria (μm) and found that they occur in a balanced manner with 4–12 events per μm per min using both ATP5I‐SNAP and COX8A‐SNAP (Fig 7G, Appendix Fig S3E). As opposed to the classical view of static cristae invaginating from the IBM, our results demonstrate that in addition to CJs, cristae constantly change their shape in a way that involves close apposition and subsequent splitting from each other. This challenges the prevailing view that cristae are constantly attached to CJs and represent rather static structures. Moreover, our observations are consistent with another possibility, namely that cristae may even pinch‐off transiently and subsequently reconnect to the IBM or with other cristae.
Figure 7. Cristae undergo balanced merging and splitting events in a MICOS‐dependent manner.
-
ARepresentative live‐cell STED super‐resolution images (t = 0 s) showing WT HeLa cells expressing ATP5I‐SNAP stained with silicon rhodamine. Box in (A) marks selection shown as a zoom in panel (B). Scale bar 500 nm.
-
BTime‐lapse image series of a mitochondrion expressing ATP5I‐SNAP in WT HeLa cells (2.5 s/frame). Green and magenta asterisks show merging and splitting events of cristae marked by ATP5I‐SNAP, respectively. Green arrows pointing inward connected by solid line and magenta arrows pointing outward connected by dotted line show sites of imminent merging and splitting events, respectively. Green “Y” represents Y‐type imminent mergence event. Scale bar 500 nm.
-
CRepresentative live‐cell STED super‐resolution images (t = 0 s) showing MIC13 KO HeLa cells expressing ATP5I‐SNAP stained with silicon rhodamine. Box in (C) marks selection shown as a zoom in panel (D). Scale bar 500 nm.
-
DTime‐lapse image series of a mitochondrion expressing ATP5I‐SNAP in MIC13 KO HeLa cells (2.5 s/frame). Green and magenta asterisks show merging and splitting events of cristae marked by ATP5I‐SNAP, respectively. Green arrows pointing inward connected by solid line and magenta arrows pointing outward connected by dotted line show sites of imminent merging and splitting events, respectively. Scale bar 500 nm.
-
EFirst image from (B) was used for showing the intensity profiles along the length of three cristae (numbered 1–3 and marked with white arrows) in (F).
-
FIntensity profiles of lines drawn across the length of cristae show increased intensities in the middle of the line scans representing the CM. The represented IBM area is superimposed from intensities of MIC13‐SNAP from Fig 6F. Magenta box depicts intensity maxima at cristae membrane apart from IBM.
-
GBlind quantification of cristae merging and splitting events in WT and MIC13 KO HeLa cells expressing ATP5I‐SNAP (three independent experiments, 3–7 mitochondria for each experiment) represented as boxplots. Boxplots show median and interquartile range from 25 to 75 percentile, and whiskers represent minimum and maximum value. ****P < 0.0001, unpaired Student's t‐test.
Figure EV5. Image depicting the resolution of live‐cell STED nanoscopy and axial dimension (XZ) of mitochondria showing cristae dynamics in lateral dimension (X‐axis) at STED resolution.
-
A, BLine scan (white line) along the length of mitochondria (A) from a representative live‐cell STED super‐resolution image from WT HeLa cells expressing ATP5I‐SNAP stained with silicon rhodamine marking cristae intensities (B). Image in panel (A) is already represented in Fig 7A. FWHM (full width at half maximum) of fluorescence intensities of cristae show a resolution of 50–60 nm using live‐cell STED conditions. Scale bar in (A) 500 nm.
-
CCartoon depicting the XYZ axes of mitochondria. Mitochondria were imaged by STED super‐resolution imaging in lateral axis (XY plane), while images were acquired in axial axis (XZ plane, diffraction‐limited).
-
DTime‐lapse image series of axial plane of two mitochondria expressing ATP5I‐SNAP, stained with silicon rhodamine (red hot LUT) in WT HeLa cells (raw data, 1.5 s/frame), as visualized by STED super‐resolution imaging in lateral plane. Green and magenta asterisks show merging and splitting events of cristae, respectively. Green arrows pointing inward connected by solid line and magenta arrows pointing outward connected by dotted line show sites of imminent merging and splitting events, respectively. Scale bar 500 nm.
Next, we checked whether the presence of a fully assembled MICOS complex is required for the dynamic behaviour of cristae using MIC13 KO cells. We overexpressed ATP5I‐SNAP and COX8A‐SNAP in MIC13 KO cells and performed blind quantification of the rate of merging and splitting events of respective fluorescence signals per unit length of mitochondria. This revealed that CM remodelling is significantly reduced in cells lacking MIC13 (Fig 7C, D and G, Appendix Fig S3C–E, Movies EV13 and EV14). Hence, a functional MICOS complex is required for CM dynamics, further supporting the view that CJ formation and dynamics are linked to CM dynamics.
Cristae membrane dynamics is accompanied by redistribution of membrane potential from distinct cristae to other regions of the inner membrane
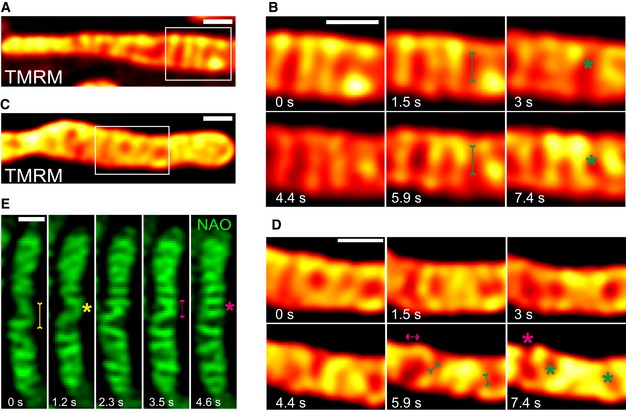
The timescales of intramitochondrial membrane dynamics, the balanced occurrence of these events and the morphological features observed were very similar despite using a variety of protein markers (MIC10‐, MIC60‐, MIC13‐, ATP5I‐ and COX8A‐SNAP) for both CJs and cristae. This makes it unlikely that the observed cristae remodelling events are merely due to diffusion of different membrane protein complexes within a rather static IM. Still, we decided to use mitochondria‐specific membrane dyes not labelling specific protein complexes. We further asked whether cristae merging events may result in an immediate change in the membrane potential ΔΨ between distinct cristae, similar to the situation previously described for fusion between two mitochondria 64. Thus, we used TMRM, a dye labelling the IM in a membrane potential manner. Performing STED with TMRM, as opposed to SNAP‐tagged proteins, is challenging due to its high sensitivity to photobleaching. Nevertheless, we could record movies for a similar time period as we did with SNAP‐tagged protein markers using STED nanoscopy. TMRM labelling showed transversely arranged cristae that were highly dynamic, consistent with our results for SNAP‐tagged IM proteins (Fig 8A–D). Moreover, we observed instances of immediate distribution of a TMRM signal from one crista (e.g. high‐intensity signal at 1.5 s in Fig 8B) to another crista and the IBM (lower‐intensity signal at 3 s in Fig 8B) (Movie EV15), coinciding with the time of a cristae mergence event. Subsequent to this event, the respective cristae are spatially separated again showing a low membrane potential increasing with time. Interestingly, here and in several more instances we observed that the membrane potential is increasing overtime suggesting that the membrane potential can fluctuate within single cristae over time and that this is spatially linked to changes in cristae membrane shape and position within a mitochondrion. This is in line with a physical separation and/or insulation of the cristae from the IBM. Another instance of instantaneous redistribution of TMRM staining is shown (Fig 8C and D). Our observations showing that the location of the TMRM label within one crista can redistribute upon close apposition to the IBM could point to a membrane fusion event accompanied with content mixing. We also stained mitochondria with a non‐potential specific dye, nonyl acridine orange (NAO), and employed another high‐resolution microscopy technique, namely using a Zeiss Airyscan module. We observed that the CM was stained as transverse bridges in mitochondria and found instances of cristae dynamics at similar timescales (Fig 8E). We thus confirmed by two dyes and by a different imaging technique that cristae and CJs are highly dynamic and that these membrane remodelling events are balanced and reversible.
Figure 8. Cristae spatial remodelling is corroborated using mitochondrial inner membrane‐specific dyes.
-
ARepresentative live‐cell STED super‐resolution images (t = 0 s) showing WT HeLa cells stained with TMRM. Box in (A) marks selection shown as a zoom in panel (B) (red hot LUT). Scale bar 500 nm.
-
BTime‐lapse image series of two mitochondria stained with TMRM (1.5 s/frame). Green asterisks show merging events and redistribution of TMRM intensity from a high‐intensity crista to a low‐intensity crista (two such instances are shown at 3 and 7.4 s). Green arrows pointing inward connected by solid line at 1.5 and 5.9 s indicate imminent merging events. Scale bar 500 nm.
-
CRepresentative live‐cell STED super‐resolution images (t = 0 s) showing WT HeLa cells stained with TMRM. Box in (C) marks selection shown as a zoom in panel (D) (red hot LUT). Scale bar 500 nm.
-
DTime‐lapse image series of two mitochondria stained with TMRM (1.5 s/frame). Green and magenta asterisks show cristae merging and splitting cycles (shown at 5.9 s and 7.4 s). Green arrows pointing inward connected by solid line and magenta arrows pointing outward connected by dotted line show sites of imminent merging and splitting events, respectively. Scale bar 500 nm.
-
ERepresentative time‐lapse images of WT HeLa cells stained with NAO, and imaged using Airyscan microscope, indicate cristae merging and splitting dynamics. Yellow and magenta asterisks show merging and splitting events of cristae, respectively. Yellow arrows pointing inward connected by solid line and magenta arrows pointing outward connected by dotted line show sites of imminent merging and splitting events, respectively. Scale bar 500 nm.
Mixing of cristae membrane proteins is linked to cristae membrane dynamics
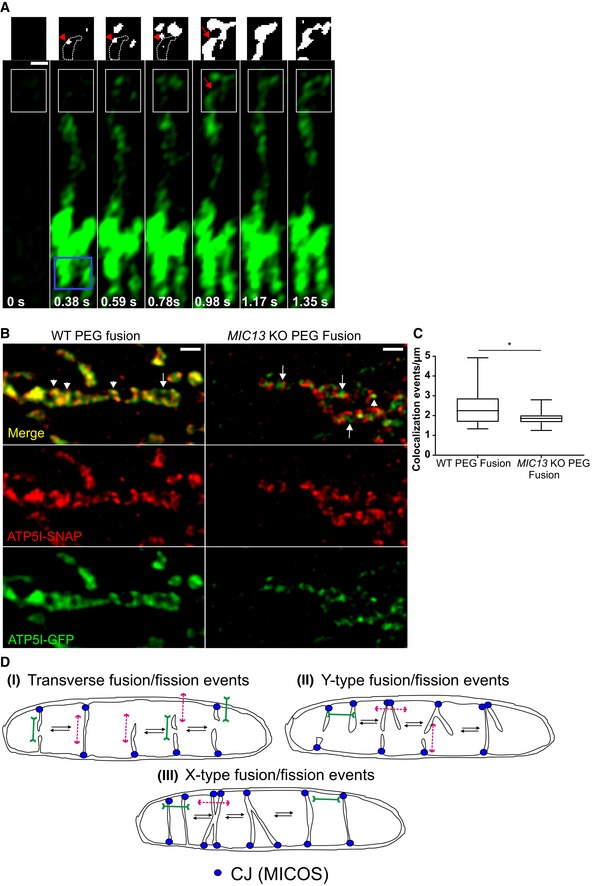
In order to test whether cristae could undergo bona fide fusion events with other cristae or with the IBM, we devised techniques that are based on the principles classically used to monitor membrane fusion between mitochondria and adapted them to study fusion between cristae. Firstly, we constructed ATP5I‐PAGFP (photoactivatable GFP targeted to cristae) and performed photoactivation experiments using the high‐resolution fast Airyscan module (Fig 9A). We rationalized that immediately after photoactivation of ATP5I‐PAGFP, we label those cristae that are in continuity along the IM but barring instances where cristae are transiently isolated from the IBM and exist as cristae vesicles. Initially, putative cristae vesicles would remain in a non‐fluorescent state (dark cristae), while cristae more distant from the site of photoactivation, which are in continuity with the IBM, would show fluorescence earlier. When such dark cristae would undergo fusion with already fluorescing cristae, we could instantaneously observe a previously non‐fluorescent crista that becomes fluorescent. In fact, we found several such instances in mitochondria. An illustration is shown where immediately after photoactivation a dark crista (Fig 9A, red arrowhead in white box at 0.38, 0.59 and 0.78 s) subsequently gained fluorescence (Fig 9A, red arrow in white box at 0.98 s), but this was delayed compared to other cristae that were located more distant from the site of photoactivation. These observations demonstrate that at a certain time, a limited set of cristae are efficiently insulated from the IBM by a physical diffusion barrier preventing membrane protein distribution but that this insulation is dynamically changing over time. This could point to the possibility that transiently isolated cristae vesicles exist and undergo fusion with the IBM or with adjacent cristae. An alternative explanation we cannot exclude at this stage is that the MICOS complex can dynamically regulate the efficiency of such a diffusion barrier at CJs.
Figure 9. Demonstration of content mixing in mitochondria using intramitochondrial cristae photoactivation and PEG fusion experiments.
-
AMitochondrion in WT HeLa cells expressing ATP5I‐PAGFP was photoactivated, in the area shown by a blue box, at 0 s. Inset of white box at 0.98 s clearly shows fluorescent crista (red arrow), absent at 0.38, 0.59 and 0.78 s (red arrowhead showing the area enclosed by white dotted lines), confirming merging of non‐fluorescent cristae vesicle with the IBM. Threshold images of insets are shown above the whole images. Scale bar 500 nm.
-
BDual‐colour STED super‐resolution images of fused mitochondrion in WT HeLa cells (left panel) showing colocalization of cristae marked with ATP5I‐GFP (using anti‐GFP antibody) and ATP5I‐SNAP (stained with silicon rhodamine). (Right panel) Fused mitochondrion in MIC13 KO HeLa cells showing cristae marked with either ATP5I‐GFP (using anti‐GFP antibody) or ATP5I‐SNAP (stained with silicon rhodamine). Arrowheads show merged cristae, while arrows show cristae that maintain their individual identity. Scale bar 500 nm.
-
CBoxplot showing quantification of colocalization events per μm of mitochondria in WT and MIC13 KO HeLa cells. Boxplots show median and interquartile range from 25 to 75 percentile, and whiskers represent minimum and maximum value (15 mitochondria were taken from WT and MIC13 KO cells from four and two independent experiments, respectively, *P = 0.03, unpaired Student's t‐test).
-
DSchematic illustration of the proposed “Cristae fission and fusion” (CriFF) as a working model and its link to CJ dynamics.
Next, we used a cell fusion assay to test these possibilities further. We labelled cristae in two different cell populations either with ATP5I‐SNAP or with ATP5I‐GFP and fused the cells using polyethylene glycol (PEG). We reasoned that if cells with mitochondria expressing differently labelled cristae were fused using PEG, in the presence of cycloheximide which inhibits protein synthesis, cristae fission and fusion would help in the formation of mixed cristae labelled with both ATP5I‐SNAP and ATP5I‐GFP. In light of our results, we would further predict that the extent of mixed cristae after a certain time of cell fusion is dependent on MIC13. Using dual‐colour STED super‐resolution nanoscopy, we observed the majority of individual cristae labelled with both colours, namely silicon rhodamine dye (labelling ATP5I‐SNAP) and anti‐GFP antibody (labelling ATP5I‐GFP) (Fig 9B, left panel) in WT HeLa cells corroborating that cristae have efficiently mixed within the time frame of a few hours. Blind quantification of the number of colocalization events per unit length of mitochondria revealed 1–5 events per μm of mitochondrion in WT HeLa cells. In MIC13 KO cells, we often observed cristae labelled with either ATP5I‐SNAP or ATP5I‐GFP next to each other within single mitochondrion in these cells (Fig 9B, right panel). There was a significant decrease in the number of colocalization events per unit length (μm) of mitochondria in MIC13 KO cells (Fig 9B right panel and 9C). Only mitochondria that contained both colours, and therefore have undergone mitochondrial fusion, were analysed here, and there is no apparent effect of MIC13 deletion on “classical” mitochondrial fusion. Thus, we can exclude that this MIC13‐dependent effect on content mixing is due to a possible effect of MIC13 on “classical” mitochondrial fusion. We rather conclude that MIC13 promotes mixing of CM proteins at an intramitochondrial level.
Discussion
The idea that cristae must be able to undergo remodelling under certain physiological conditions has been around for half a century, yet studying the dynamic behaviour of cristae membranes in real time was technically challenging due to limitations in optical resolution of diffraction‐limited conventional light microscopy and due to the fact that electron microscopy can only capture fixed samples. In addition, the majority of studies using super‐resolution techniques to study mitochondria have used fixed samples 56, 57, 65. STED super‐resolution microscopy of living cells has been utilized so far to visualize other cellular organelles, such as ER or Golgi 66, 67. To date, one study illustrated the power of Hessian structured illumination microscopy by giving an example in a single mitochondrion indicating cristae dynamics 68. While this manuscript was under review, further two studies reported on technical advances in determining cristae dynamics using STED nanoscopy: one using MitoPB Yellow, a novel fluorescent dye 69, and another using a single protein marker of cristae, namely COX8A‐SNAP in WT HeLa cells 70. Here, we provide several lines of evidence demonstrating for the first time that spatial remodelling of CJs as well as of cristae is balanced and reversible process that occurs at a timescale of seconds. We further identified the first molecular player that is required for CJ and CM dynamics: the MICOS complex. These findings are based on the application of different advanced imaging techniques such as live‐cell STED, SPT, FRAP and high‐resolution Airyscan microscopy, which were applied to a wide variety of protein markers to visualize distinct mitochondrial substructures (MIC60‐SNAP, MIC10‐SNAP, MIC13‐SNAP, ATP5I‐SNAP, COX8A‐SNAP), as well as two dyes labelling the IM. We obtained three mammalian knockout cell lines lacking MIC10, MIC60 and MIC13, respectively, and expressed the various constructs of SNAP‐ and GFP‐tagged mitochondrial IM proteins in those and wild‐type cells to reveal the functional role of the MICOS complex in this regard. Our improved tagging and imaging conditions allowed us to achieve a time resolution of up to 1.3–2.6 s per frame revealing that CJs and cristae dynamics occur at very similar timescales (seconds) and both depend on the MICOS complex. The idea of MIC60 as a central initiator of the MICOS complex was proposed earlier from confocal experiments in baker's yeast as reintroducing MIC60‐GFP into a strain lacking all MICOS subunits and showed MIC60‐GFP to be assembled into discrete spots 58. Hence, improved spatial resolution obtained by STED imaging, FRAP, and SPT experiments in combination corroborates that MIC60 is the pioneering subunit of the MICOS complex positioning MICOS assembly and CJ formation in mammalian cells. The careful and extensive characterization of this novel MICOS‐dependent process of continuous cycles of cristae membrane remodelling in living human cells revealed another highly interesting aspect, namely the possibility that cristae can actually be physically insulated or connected to each other and/or the IBM in a dynamic and regulated manner. In principle, there are two possibilities explaining this: (i) the MICOS complex stably forms CJs acting as diffusion barriers and dynamically regulates the permeability of CJs for proteins and lipids. (ii) The MICOS complex dynamically forms CJs and allows transient formation of isolated cristae vesicles by membrane fission and re‐fusion of these transient vesicles with the IBM or with adjacent cristae. Both explanations do not exclude each other, yet based on our findings and the following arguments, we propose a model that is more in line with the second explanation. We term it “Cristae Fission–Fusion” (CriFF) model. The possibility of CMs to actually undergo membrane fission and fusion upon changing between condensed and orthodox states in vitro was proposed earlier using EM tomography under different conditions of isolated mitochondria 11. Here, we now show for the first time, by following the fluctuations of membrane potential in time and space, using photoactivation at the resolution of individual cristae, and performing PEG fusion assays, that cristae might undergo bona fide membrane fusion in living cells and that this occurs in a MICOS‐dependent manner. Overall, the CriFF model integrates our observations as follows (Fig 9D): (i) MIC60 serves as a docking site for the formation of CJs via recruitment of other subunits of the MICOS complex; (ii) once the MICOS complex is fully assembled, CJs are the sites for cristae to grow and emerge from the IBM. This does not exclude that the MICOS complex can dynamically change its composition or assembly state; (iii) CJs can dynamically merge and split; (iv) cristae are mainly, but not necessarily always, attached to CJs; and (v) cristae can undergo transient pinching‐off from CJs and re‐merge at the same CJ or another one (transverse or neighbouring CJ; Fig 9Di). The formation of separated cristae subcompartments is consistent with another study showing that, within the same mitochondrion, individual cristae can maintain a stable membrane potential over time and that neighbouring cristae can maintain disparate ΔΨ 60. This is also consistent with our FRAP data showing that TIMM23‐GFP shows a reduced mobility upon loss of CJs, presumably by enhanced trapping in the CM. (vi) Formation of Y‐type cristae fusion may be preceded by CJ merging and subsequent cristae membrane remodelling (Fig 9Dii). This would represent one possibility to link CJ dynamics and cristae remodelling. (vii) X‐type cristae fusion could represent preceding/following CJ splitting/merging from a Y‐type like cristae morphology or cristae fusion between cristae distant from CJs (Fig 9Diii). This clearly is a working model and will require further testing in future studies.
What could be the physiological advantage for cristae to undergo fusion and fission and why could impairment thereof lead to severe human diseases including mitochondrial encephalopathy with liver dysfunction as reported for mutations in MIC13 48, 49, 50, 51? Although future experiments will have to provide the answer to these questions, from the results shown here and in other studies, it is very clear that OXPHOS is impaired in cells lacking MICOS subunits such as MIC10, MIC60, MIC26, MIC27 or MIC13 42, 43, 44, 45. How can we explain this and what could comprise possible functions of highly dynamic CMs? To answer this, on one hand it is worth considering that cristae fission would result in transient cristae subcompartments, which are physically isolated from the rest of the IM. This goes along with a reduced surface of the IM that is directly accessible to the cytosol via passing the intermembrane space and the outer membrane. On the other hand, cristae fusion reverts this and leads to an increase in accessible IM surface. The former situation is expected to favour trapping of metabolites and protons within the intracristal space, whereas the latter would increase the accessible surface, which is expected to favour metabolite exchange. As both processes, decreasing versus increasing IM surface, are critical for mitochondrial function, we propose that cristae dynamics is a way to adapt between these opposing necessities. Moreover, CriFF may help to distribute and mix proteins, lipids and important metabolites in the mitochondrion. In summary, we propose that CriFF has major implications for the following processes: (i) proton trapping; fission of cristae at CJs, resulting in transient intramitochondrial vesicles, could prevent proton leakage from the intracristal space to the cytosol, thereby promoting ATP synthesis. This does not exclude other ways of proton trapping proposed earlier, including proton buffering via cardiolipin 71 and preferential electrostatic local concentration at highly curved cristae tips 72. Interestingly, pH differences within the intermembrane space have been reported, as the pH near ATP5I‐SEcGFP (Superecliptic GFP, pH‐sensitive version of GFP), residing at cristae tips, was shown to be 0.3 higher compared to COX8A‐SEcGFP 73 located in the cristae. This was proposed to reflect a concentration gradient of protons, which dilutes at the cristae tips, which appear to act as a sink. Furthermore, we have recently shown that cristae behave as independent, bioenergetic units within a single mitochondrion which is fully in line with the transient formation of separated subcompartments that can adopt discrete levels of membrane potential 60. (ii) Content mixing; CriFF may promote metabolite exchange including ADP, which was proposed to be limiting under certain conditions for OXPHOS 9. (iii) Intramitochondrial quality control by protein content mixing; ongoing cristae fission and fusion dynamics may serve to mix partially damaged protein complexes, such as ETC complexes, in the CM to allow intramitochondrial complementation and protein quality control by proteases. (iv) Biogenesis of membrane protein complexes; continuous mixing of newly imported protein subunits (nuclear as well as mtDNA encoded) may promote efficient assembly of membrane protein complexes, in particular when considering that the cristae membrane is very densely packed with proteins. This view is consistent with hybrid cristae, which were reported to be formed upon mitochondrial fusion, following PEG fusion of cells expressing mitochondria with different tags to respiratory chain complexes 74 and supported by our PEG fusion experiment as well (Fig 9B and C). (v) Lipid remodelling, mixing and exchange; cristae dynamics could promote exchange of lipids between organelles and OM and IM and optimize cardiolipin synthesis. Contact sites between the IM and the OM, defined by the MICOS complex, were shown to coordinate the synthesis of phosphatidylethanolamine by Psd1 to dictate lipid remodelling in mitochondrial membranes 75. (vi) Other processes likely to be affected by altered cristae dynamics could include redox homeostasis, thermogenesis, Ca2+ buffering and iron–sulphur biogenesis.
What are the molecular machineries required for these processes? We show that these processes are dependent on fully assembled MICOS complex in a MIC13‐dependent manner. This and the fact that both CJs and cristae dynamics occur at the similar timescales in a balanced manner strongly suggest that they are mechanistically linked. Indeed, the MIC13‐SNAP live‐cell STED movies allow the simultaneous visualization of CJs and cristae supporting this view. Still, we cannot fully exclude that the MICOS complex has two independent functions explaining our observation equally well. Further experiments will provide insights into the bioenergetic parameters and the molecular mechanisms of these fascinatingly fast and continuously occurring dynamics of CJs and cristae.
In conclusion, live‐cell STED super‐resolution nanoscopy in combination with biochemical and genetic methods has expanded our view on the dynamics of IM remodelling at a nanoscopic level in real time. Future research will provide further insights into the regulation, physiology and pathophysiology of these newly revealed dynamic processes occurring within mitochondria.
Materials and Methods
Cell culture, transfection and generation of knockout cell lines
HeLa and HEK293 cells were maintained in DMEM (Sigma‐Aldrich) supplemented with 10% foetal bovine serum (PAN Biotech), 2 mM glutaMAX (Gibco), 1 mM sodium pyruvate (Gibco) and penstrep (Sigma‐Aldrich, penicillin 100 units/ml and streptomycin 100 μg/ml), whereas HAP1 cells were cultured using Iscove's modified DMEM media (IMDM) supplemented with 20% foetal bovine serum (PAN Biotech), 2 mM glutaMAX (Gibco) and penstrep (Sigma‐Aldrich, penicillin 100 units/ml and streptomycin 100 μg/ml). Cells were grown in incubator with 37°C and 5% CO2. All cell lines were tested negative for possible mycoplasma contamination. HeLa and HAP1 cells were transfected with 1 μg of corresponding plasmid using GeneJuice® (Novagen) according to the manufacturer's instructions. In case of SNAP‐tag constructs, 0.2 μg of MitoGFP (matrix‐targeted) and 1 μg of corresponding SNAP‐tag were co‐transfected. HEK293 cells were grown on a large scale in 10 cm dishes and transfected with 10 μg of respective plasmids that were used for biochemical experiments. MIC13 KO HeLa cells were generated using CRISPR/Cas method as described before 44. MIC10 and MIC60 KO HAP1 cells along with WT cells were custom‐made upon our request by Horizon (UK). For TMRM imaging, HeLa cells were stained with 50 nM TMRM dye (Invitrogen) for 30 min followed by three washes with complete medium.
Molecular cloning
Human MIC60, MIC10, MIC13, ATP5I and TOMM20 were cloned into pSNAPf vector (NEB) using Gibson Assembly Cloning Kit (NEB). COX8A‐SNAP vector was obtained from NEB. MIC60 and MIC10 were cloned into pEGFPN1 using restriction digestion by XhoI and BamH1 followed by ligation. Human TOMM20, TIMM23 and ATP5I were cloned into pEGFPN1 vector, and human ATP5I was cloned into pPAGFPN1 vector using Gibson Assembly Cloning Kit (NEB) to acquire their respective GFP‐ or PAGFP‐tagged versions.
SDS electrophoresis and Western blotting
For preparing samples for Western blotting, corresponding cells were collected and proteins were extracted using RIPA lysis buffer. The amount of solubilized proteins in all the samples were determined using the Lowry method (Bio‐Rad). 15% SDS–PAGE was performed, and separated proteins were subsequently blotted onto a PVDF membrane, and probed with indicated antibodies: MIC10 from Abcam (84969), MIC13 (custom‐made by Pineda (Berlin) against human MIC13 peptide CKAREYSKEGWEYVKARTK), MIC19 (Proteintech, 25625‐1‐AP), MIC25 (Proteintech, 20639‐1‐AP), MIC26 (Thermo Fisher, MA5‐15493), MIC27 (Atlas Antibodies, HPA000612), MIC60 (custom‐made, Pineda (Berlin)) against human IMMT using the peptide CTDHPEIGEGKPTPALSEEAS), SNAP‐tag (P9310S, NEB) and β‐tubulin (Abcam, ab6046). Goat anti‐mouse IgG HRP‐conjugated antibody (ab97023) and goat anti‐rabbit IgG HRP‐conjugated antibody (Dianova, 111‐035‐144) were used as secondary antibodies. Chemiluminescence was captured using a VILBER LOURMAT Fusion SL (PEQLAB).
Coimmunoprecipitation
For coimmunoprecipitation, isolated mitochondria from HEK293 cells overexpressing either MIC10‐SNAP, MIC10‐GFP, MIC60‐SNAP or MIC60‐GFP were used. Mitochondrial isolation was done as described before 44. The coimmunoprecipiation experiment was performed using the protocol described in Ref. 28 with the following modification. The beads were incubated with 4 μg of MIC13 antibody (custom‐made by Pineda (Berlin)) against human MIC13 peptide CKAREYSKEGWEYVKARTK). During lysis of the mitochondria, a detergent/protein ratio of 2 g/g was used.
Isolation of macromolecular complexes by blue native gels
Mitochondria from HEK293 cells overexpressing MIC60‐SNAP or MIC60‐GFP were isolated and BN‐PAGE experiment was performed as shown by Ref. 44 with the use of a detergent/protein ration of 2 g/g during solubilization.
Electron microscopy
HAP1 WT, MIC10 KO and MIC60 KO cells were grown on petri dishes, and cells were washed with PBS and fixed using 3% glutaraldehyde in 0.1 M sodium cacodylate buffer, pH 7.2. After fixation, cells were collected in a small tube using a cell scraper and pelleted. These cell pellets were washed with 0.1 M sodium cacodylate, pH 7.2 and subsequently embedded in 2% agarose. The pellets were stained using 1% osmium tetroxide for 50 min and 1% uranyl acetate/1% phosphotungstic acid for 1 h. The samples were dehydrated using graded acetone series and embedded in spur epoxy resin for polymerization at 65°C for 24 h. The ultrathin sections were prepared using microtome, and the images were acquired using transmission electron microscope (Hitachi, H600) at 75V equipped with Bioscan model 792 camera (Gatan) and analysed with ImageJ software.
Cellular respiration measurements
All respiration measurements were performed using Seahorse XFe96 Analyzer (Agilent). The HAP1 cells were seeded into Seahorse XF96 cell culture plate (Agilent) at a density of 30,000 cells per well overnight. Next day, cells were washed and incubated in basic DMEM media (Sigma, D5030) supplemented with glucose, glutamine and pyruvate at 37°C in non‐CO2 incubator 1 h prior to the assay. Mitochondrial respiration function was measured using Seahorse XF Cell Mito Stress Test Kit (Agilent) according to the manufacturer's instructions. Briefly, the delivery chambers of the sensor cartridge were loaded with oligomycin (F1FO‐ATPase synthase inhibitor) or FCCP (uncoupler) or rotenone and antimycin (complex I and complex III inhibitors, respectively) to measure basal, proton leak, maximum and residual respiration. Cell number was normalized after the run using Hoechst staining. Data were analysed using wave software (Agilent).
Immunofluorescence staining
HAP1 cells were fixed with pre‐warmed (37°C) 3.7% paraformaldehyde for 15 min. After fixation, cells were washed three times with PBS, permeabilized with 0.15% Triton X‐100 for 15 min and blocked using 10% goat serum for 15 min followed by incubation with appropriate dilution of primary antibodies for 3 h at room temperature or overnight at 4°C. After washing thrice with PBS, samples were incubated at room temperature with appropriate secondary antibody for 1 h and washed three times with PBS before proceeding for microscopy. For STED super‐resolution imaging, primary antibodies used were against MIC60 (custom‐made, Pineda (Berlin)), MIC10 (Abcam, 84969) and TOMM70 (Santa Cruz Biotechnology, sc‐390545). Goat anti‐rabbit Abberior STAR 635P (Abberior) and goat anti‐mouse Abberior STAR 580 (Abberior) were used as secondary antibodies.
Quantification of mitochondrial interpunctae distance (IPD)
The longitudinal distance along the mitochondrial length between two successive MIC60 or MIC10 punctae is termed as interpunctae distance (IPD). The IPD between MIC60 and MIC10 punctae was calculated using the ImageJ software by manually drawing lines between two spots from the centre of the punctae and measured using the “Analyze” function to calculate the length of that particular line. In order to avoid repetition of measuring the IPD, the length between the punctae was measured in a clockwise direction. If the edges of mitochondria containing the MIC60 or MIC10 spots were curved, a segmented line tool was used to measure the IPD. In rare cases where MIC60 spots were replaced by longitudinal bridges, the centre of the line was taken into consideration for defining the spot. The distance between MIC60 or MIC10 punctae per mitochondrion was calculated (from an average of 36–55 spots/mitochondrion), and a median interpunctae distance was obtained for that individual mitochondrion. Data were represented in a boxplot where a single value represented IPD value for each mitochondrion.
FRAP and associated quantification
FRAP experiments were performed on Leica SP8 using the FRAP module with Fly mode function switched on. Images were acquired with 40× water objective (N.A = 1.1) using 25x zoom. In order to avoid acquisition photobleaching, only 1–1.5% laser power of the Argon laser line at 488 nm was used to acquire the images using a PMT in green emission range. A square region of 0.7 × 0.7 μm was bleached using 100% laser power at 488 nm. Ten pre‐bleach images were acquired, while 10 images were acquired during bleaching. 200 post‐bleach images were acquired at a maximal possible frame rate of 88–89 ms/frame to monitor the recovery of fluorescence. After the images were acquired, quantification of the FRAP experiment was done in the following way: three different regions of interest (ROIs) were taken into consideration: (i) ROI1, an area where no mitochondria were found in the image, was used to perform background subtraction. (ii) ROI2 was the area of mitochondria where the photobleaching was performed. (iii) ROI3, another region of a separate mitochondria not subjected to FRAP, was used to obtain correction factor for acquisition photobleaching. ROI2(P) was the average of 10 pre‐bleach measurements of ROI2, whereas ROI3(P) was the average of 10 pre‐bleach measurements of ROI3. Hence, photobleach correction was performed by using the formula: ROI2‐ROI1/ROI3‐ROI1 and normalization were performed by using the formula: ROI2‐ROI1/ROI3‐ROI1 X ROI3(P)‐ROI1/ROI2(P)‐ROI1. All the mitochondria belonging to a particular condition from independent experiments were pooled and averaged for their FRAP curves. Standard error of mean (SEM) was plotted for all the pooled mitochondria for each condition.
Once the FRAP recovery values were obtained, they were fitted, using GraphPad Prism 7.04, by nonlinear regression two‐phase association model for all molecules. First and second phase association T 1/2 recovery values were obtained for each condition when the curves were fitted by nonlinear regression two‐phase association model. Mobile fraction was calculated by using the formula: F m = F p‐F 0/F initial‐F 0, where F m denotes the mobile fraction, F p denotes the fraction of fluorescence when the plateau is reached, F initial is 1 and F 0 is the fraction of initial fluorescence after the last pulse of photobleaching for all cases except MIC60‐GFP, MIC10‐GFP and TOMM20‐GFP (in MIC13 KO cells), where the Fp was calculated from the average of last 5 intensity values. Diffusion coefficients (D) were calculated using the formula D = 0.25 × r 2/T 1/2, where r is the radius of the bleached ROI and T 1/2 is the recovery time in seconds, as suggested before 76. We bleached a square ROI region of 0.49 μm2 in the mitochondria for our experiments. Hence, we used 0.49 μm2 as the area of the circle to calculate the radius.
Single‐particle tracking imaging and quantification
Cells transfected with the SNAP‐tag and stained with low concentrations of SNAP‐cell 647‐SiR (NEB) (15 nM for MIC60‐SNAP and 0.225 nM for MIC10‐SNAP) were imaged in fluoroBrite DMEM media supplemented with 10% foetal bovine serum (PAN Biotech), 2 mM glutaMAX (Gibco), 1 mM sodium pyruvate (Gibco) and penstrep (Sigma‐Aldrich, penicillin 100 units/ml and streptomycin 100 μg/ml). Lower concentrations of silicon rhodamine were used here compared to STED super‐resolution imaging to allow for selective labelling of only few molecules in a mitochondrion. Movies were acquired on a Zeiss Elyra PS.1 microscope equipped with a 63× (NA = 1.46) objective lens in total internal reflection fluorescence (TIRF) mode, where highly inclined and laminated optical sheet (HILO) illumination was used, at a frame rate of 33 ms/frame for 1,000 frames. The angle of the illuminating laser, EMCCD gain and laser intensity was manually adjusted to acquire the best signal‐to‐noise ratio (SNR). The first 50–100 frames of every movie were not used for analyses so that acquisition bleaching will additionally provide a sufficiently low concentration of single particles. For analyses of movies, a ROI was set around each cell and single‐particle tracking (SPT) was performed using the Fiji/ImageJ 77 plugin TrackMate 78 where the following TrackMate settings were used: Detector: Laplacian of Gaussian, Estimated blob diameter: 0.5 μm, Do sub‐pixel localization: Yes, Initial thresholding: No, Filter on spots: SNR above 0.4. For tracking spots, the linear assignment problem (LAP) tracker with following settings worked well: Frame to frame linking: 0.3 μm, Gap‐closing maximal distance: 0.5 μm, Gap‐closing maximal frame gap: 5 frames. The filter on tracks function was used to only analyse tracks with more than 20 spots within a track. After analysis, the calculated mean square displacement (MSDs) and instantaneous diffusion coefficients (insDs) of all tracks were loaded into the Fiji plugin “Trajectory Classifier” 79. MSD analysis allows to determine the mode of displacement of particles over time. For the calculation of the MSD for every track and time point, the MATLAB class @msdanalyzer was used 80. Additionally, the insDs were calculated using insD = mean MSD/4*dt 81 where mean MSDs were calculated using the first 4 MSD points of every track. Besides the calculation of the MSD and insD, tracks were analysed using the Fiji plugin Trajectory classifier 79. The plugin classifies tracks generated with TrackMate into confined diffusion, subdiffusion, normal diffusion and directed motion in increasing order of directionality. As most tracks were relatively short, following settings for the classification were used: Minimal track length: 20, Window size: 10, Minimal segment length: 10. SPT data were obtained for each condition in two independent experiments from 2 to 5 cells in each experiment.
2D STED (stimulated emission depletion) super‐resolution nanoscopy
Cells transfected with corresponding SNAP tags and stained with silicon rhodamine dye (SNAP‐cell 647‐SiR (NEB) (3 μM)) were imaged at 37°C and 5% CO2 mimicking cell culture incubator conditions in fluoroBrite DMEM media supplemented with 10% foetal bovine serum (PAN Biotech), 2 mM glutaMAX (Gibco), 1 mM sodium pyruvate (Gibco) and penstrep (Sigma‐Aldrich, penicillin 100 units/ml and streptomycin 100 μg/ml). Live‐cell STED super‐resolution nanoscopy was performed on Leica SP8 laser scanning confocal microscope fitted with a STED module. Before imaging, the alignment of excitation and depletion laser was checked in reflection mode using colloidal 80‐nm gold particles (BBI Solutions). Cells expressing the SNAP‐tag and stained with SNAP‐cell 647‐SiR (NEB) were excited with a white light laser at an excitation wavelength of 633 nm. Images were collected using a hybrid detector (HyD) at an emission range from 640 to 730 nm using a 93× glycerol (N.A = 1.3) or 100× oil objective (N.A = 1.4) while using a pulsed STED depletion laser beam at 775‐nm emission wavelength. The images were obtained at a zoom to acquire 9.7 × 9.7 μm area (12× magnification for 100× or 12.9× magnification for 93× objective). Movies were obtained at a frame rate of ~2.5 s/frame or ~ 1.25 s/frame (pixel size was 22.5 nm for live‐cell STED imaging). Gating STED was used from 0.8 to 1 ns onwards in order to increase the specificity of the fluorescence signal.
For dual‐colour STED, we used pulsed STED depletion laser at 775‐nm emission wavelength. Images were collected in sequential mode using a hybrid detector while exciting at 633 and 561 nm to acquire images at emission wavelengths of 660–730 nm and 570–610 nm, respectively. Care was taken to avoid any crosstalk between the channels by performing a sequential scan and reducing the range of emission wavelengths for both the channels mentioned. Additionally, we confirmed that there was no chromatic aberration between both the channels by using an antibody against nuclear pore complex emitting in both channels. Anti‐NUP1 153 (ab 24700) is an antibody, ideally suited to check samples for chromatic aberration during STED imaging, staining the nuclear pores. For imaging of fixed samples in this study, the pixel size was 17 nm. Image processing post‐image acquisition of live‐cell SNAP movies was performed with Huygens Deconvolution software. The raw data images are provided. Due to the strong depletion and the drastic decrease in emitting fluorophores in STED microscopy, the resulting images tend to have a lower signal‐to‐noise ratio. The increase in axial resolution, and by that reduction in out of focus blur, is not the only benefit of deconvolution. The other major advantages are increase in signal‐to‐noise ratio and resolution, which enhance image quality for 2D datasets as well, as shown before 82.
Quantification of crista junction and cristae dynamics
Blind quantification of intramitochondrial merging and splitting events in case of MIC10‐ and MIC60‐SNAP marking CJs and ATP5I‐SNAP, COX8A‐SNAP and MIC13‐SNAP marking cristae was done manually by observing the corresponding live‐cell STED movies for a time span of ~15 s obtained at a frame rate of ~2.5 s/frame. The number of merging/splitting events was divided by the mitochondrial length to yield corresponding number of events/unit length (μm) of mitochondrion. Events/μm/min of mitochondria was subsequently calculated. All quantifications were performed from three independent experiments using 3–10 mitochondria from each experiment, which were all chosen from separate cells.
Airyscan microscopy
HeLa cells were stained with 100 nM nonyl acridine orange for 1 h and imaged using Plan‐Apochromat 100×/1.46 Oil DIC M27 objective on the Zeiss LSM 880 with Airyscan. Raw.czi files were processed into deconvoluted images using the Zen software automatically. HeLa cells expressing ATP5I‐PAGFP and mitocherry were used for photoactivation experiments. Images were acquired by exciting at 488 nm using Plan‐Apochromat 63×/1.4 Oil DIC M27 objective on the Zeiss LSM 880 with Airyscan. We photoactivated a 1 × 1 μm area of the mitochondria by using a 405‐nm laser followed by acquisition of the images in fast mode every 0.2 s after photoactivation.
PEG fusion assay
PEG fusion assay was adapted from Ref. 83. Cells expressing ATP5I‐SNAP and ATP5I‐GFP were co‐plated (1:1 ratio) in such a way that they were 100% confluent and adhering to each other on the day of PEG fusion. Cells were treated with cycloheximide (20 μg/ml) 30 min prior to PEG fusion till the time they were fixed in PFA. After PEG (suitable for hybridoma, Merck) fusion for 60 s, mitochondria from cells expressing ATP5I‐SNAP and ATP5I‐GFP were allowed to fuse for 3 h. In the last 30 min, silicon rhodamine was added to bind to those cells expressing ATP5I‐SNAP followed by three washes in serum‐free medium with cycloheximide (20 μg/ml). Cells were then fixed in pre‐warmed (37°C) 3.7% paraformaldehyde for 15 min. The paraformaldehyde also contained cycloheximide (20 μg/ml). After fixation, cells underwent immunofluorescence staining as described in the section before. Mouse Anti‐GFP (Merck, 11814460001) primary and goat anti‐mouse Abberior STAR 580 (Abberior) secondary antibodies were used.
Statistics
Statistical analysis for different experiments was done in GraphPad Prism 7.04 using unpaired Student's t‐test except for comparison in Seahorse experiments where differences in basal oxygen consumption were compared by one‐sample t‐test. Mean ± SEM was used for different experiments, and sample size was not predetermined using any statistical methods.
Author contributions
AKK, RA and ASR developed the underlying concept of the study, designed the experiments and wrote the manuscript with comments from all other authors. AKK performed all experiments of STED super‐resolution imaging and FRAP with help from SH and SWP. TZ and AKK performed the SPT experiments, while TZ performed quantification of SPT data using ImageJ with a MATLAB interface. RA performed all the biochemical experiments, electron microscopy and blind quantification. AKK and RA performed cristae photoactivation experiments with help from SH and SWP. JU characterized the MIC13 KO cells and performed co‐IP and BN‐PAGE experiments. DMW and MS performed the NAO staining using Zeiss Airyscan imaging and analysis. ML and OSS contributed with scientific and critical inputs to the manuscript.
Conflict of interest
The authors declare that they have no conflict of interest.
Supporting information
Appendix
Expanded View Figures PDF
Movie EV1
Movie EV2
Movie EV3
Movie EV4
Movie EV5
Movie EV6
Movie EV7
Movie EV8
Movie EV9
Movie EV10
Movie EV11
Movie EV12
Movie EV13
Movie EV14
Movie EV15
Review Process File
Acknowledgements
We thank T. Portugall and A. Borchardt for technical assistance in constructing the plasmids used in this study and in electron microscopy experiments, respectively. STED, FRAP, SPT and cristae photoactivation experiments were performed at the Centre for Advanced Imaging (CAi) facility at HHU, Düsseldorf. We are also grateful to Prof. Wilhelm Stahl, Prof. Peter Brenneisen and Dr. Marcel Zimmermann for helpful and stimulating discussions. This work was supported by Deutsche Forschungsgemeinschaft (DFG) grant RE 1575/2‐1 (ASR), Project‐ID 267205415—SFB 1208 project B12 (ASR), SFB 974 Project B09 (ASR), Research Committee of the Medical faculty of Heinrich Heine University Düsseldorf FoKo‐37/2015 (AKK) and Foko‐02/2015 (RA & ASR), SFB 1208 Project Z02 (SWP) and grant WE 5343/1‐1 (SWP).
EMBO Reports (2020) 21: e49776
References
- 1. Zick M, Rabl R, Reichert AS (2009) Cristae formation‐linking ultrastructure and function of mitochondria. Biochem Biophys Acta 1793: 5–19 [DOI] [PubMed] [Google Scholar]
- 2. Zerbes RM, van der Klei IJ, Veenhuis M, Pfanner N, van der Laan M, Bohnert M (2012) Mitofilin complexes: conserved organizers of mitochondrial membrane architecture. Biol Chem 393: 1247–1261 [DOI] [PubMed] [Google Scholar]
- 3. Acehan D, Xu Y, Stokes DL, Schlame M (2007) Comparison of lymphoblast mitochondria from normal subjects and patients with Barth syndrome using electron microscopic tomography. Lab Invest 87: 40–48 [DOI] [PMC free article] [PubMed] [Google Scholar]
- 4. Perkins G, Renken C, Martone ME, Young SJ, Ellisman M, Frey T (1997) Electron tomography of neuronal mitochondria: three‐dimensional structure and organization of cristae and membrane contacts. J Struct Biol 119: 260–272 [DOI] [PubMed] [Google Scholar]
- 5. Perkins GA, Ellisman MH, Fox DA (2003) Three‐dimensional analysis of mouse rod and cone mitochondrial cristae architecture: bioenergetic and functional implications. Mol Vis 9: 60–73 [PubMed] [Google Scholar]
- 6. Perkins GA, Tjong J, Brown JM, Poquiz PH, Scott RT, Kolson DR, Ellisman MH, Spirou GA (2010) The micro‐architecture of mitochondria at active zones: electron tomography reveals novel anchoring scaffolds and cristae structured for high‐rate metabolism. J Neurosci 30: 1015–1026 [DOI] [PMC free article] [PubMed] [Google Scholar]
- 7. Rabl R, Soubannier V, Scholz R, Vogel F, Mendl N, Vasiljev‐Neumeyer A, Körner C, Jagasia R, Keil T, Baumeister W et al (2009) Formation of cristae and crista junctions in mitochondria depends on antagonism between Fcj1 and Su e/g. J Cell Biol 185: 1047–1063 [DOI] [PMC free article] [PubMed] [Google Scholar]
- 8. Frey TG, Renken CW, Perkins GA (2002) Insight into mitochondrial structure and function from electron tomography. Biochem Biophys Acta 1555: 196–203 [DOI] [PubMed] [Google Scholar]
- 9. Mannella CA, Lederer WJ, Jafri MS (2013) The connection between inner membrane topology and mitochondrial function. J Mol Cell Cardiol 62: 51–57 [DOI] [PMC free article] [PubMed] [Google Scholar]
- 10. Mannella CA, Marko M, Penczek P, Barnard D, Frank J (1994) The internal compartmentation of rat‐liver mitochondria: tomographic study using the high‐voltage transmission electron microscope. Microsc Res Tech 27: 278–283 [DOI] [PubMed] [Google Scholar]
- 11. Mannella CA, Pfeiffer DR, Bradshaw PC, Moraru II, Slepchenko B, Loew LM, Hsieh CE, Buttle K, Marko M (2001) Topology of the mitochondrial inner membrane: dynamics and bioenergetic implications. IUBMB Life 52: 93–100 [DOI] [PubMed] [Google Scholar]
- 12. Vogel F, Börnhovd C, Neupert W, Reichert AS (2006) Dynamic subcompartmentalization of the mitochondrial inner membrane. J Cell Biol 175: 237–247 [DOI] [PMC free article] [PubMed] [Google Scholar]
- 13. Hackenbrock CR (1966) Ultrastructural bases for metabolically linked mechanical activity in mitochondria. I. Reversible ultrastructural changes with change in metabolic steady state in isolated liver mitochondria. J Cell Biol 30: 269–297 [DOI] [PMC free article] [PubMed] [Google Scholar]
- 14. Hackenbrock CR (1968) Chemical and physical fixation of isolated mitochondria in low‐energy and high‐energy states. Proc Natl Acad Sci USA 61: 598–605 [DOI] [PMC free article] [PubMed] [Google Scholar]
- 15. Hackenbrock CR (1972) Energy‐linked ultrastructural transformations in isolated liver mitochondria and mitoplasts. Preservation of configurations by freeze‐cleaving compared to chemical fixation. J Cell Biol 53: 450–465 [DOI] [PMC free article] [PubMed] [Google Scholar]
- 16. Nicastro D, Frangakis AS, Typke D, Baumeister W (2000) Cryo‐electron tomography of neurospora mitochondria. J Struct Biol 129: 48–56 [DOI] [PubMed] [Google Scholar]
- 17. Frezza C, Cipolat S, Martins de Brito O, Micaroni M, Beznoussenko GV, Rudka T, Bartoli D, Polishuck RS, Danial NN, De Strooper B et al (2006) OPA1 controls apoptotic cristae remodeling independently from mitochondrial fusion. Cell 126: 177–189 [DOI] [PubMed] [Google Scholar]
- 18. Scorrano L, Ashiya M, Buttle K, Weiler S, Oakes SA, Mannella CA, Korsmeyer SJ (2002) A distinct pathway remodels mitochondrial cristae and mobilizes cytochrome c during apoptosis. Dev Cell 2: 55–67 [DOI] [PubMed] [Google Scholar]
- 19. Vincent AE, Ng YS, White K, Davey T, Mannella C, Falkous G, Feeney C, Schaefer AM, McFarland R, Gorman GS et al (2016) The spectrum of mitochondrial ultrastructural defects in mitochondrial myopathy. Sci Rep 6: 30610 [DOI] [PMC free article] [PubMed] [Google Scholar]
- 20. Koob S, Reichert AS (2014) Novel intracellular functions of apolipoproteins: the ApoO protein family as constituents of the Mitofilin/MINOS complex determines cristae morphology in mitochondria. Biol Chem 395: 285–296 [DOI] [PubMed] [Google Scholar]
- 21. Quintana‐Cabrera R, Mehrotra A, Rigoni G, Soriano ME (2017) Who and how in the regulation of mitochondrial cristae shape and function. Biochem Biophys Res Comm 500: 94–101 [DOI] [PubMed] [Google Scholar]
- 22. Rampelt H, Zerbes RM, van der Laan M, Pfanner N (2016) Role of the mitochondrial contact site and cristae organizing system in membrane architecture and dynamics. Biochem Biophys Acta 1864: 737–746 [DOI] [PubMed] [Google Scholar]
- 23. Harner M, Korner C, Walther D, Mokranjac D, Kaesmacher J, Welsch U, Griffith J, Mann M, Reggiori F, Neupert W (2011) The mitochondrial contact site complex, a determinant of mitochondrial architecture. EMBO J 30: 4356–4370 [DOI] [PMC free article] [PubMed] [Google Scholar]
- 24. Hoppins S, Collins SR, Cassidy‐Stone A, Hummel E, Devay RM, Lackner LL, Westermann B, Schuldiner M, Weissman JS, Nunnari J (2011) A mitochondrial‐focused genetic interaction map reveals a scaffold‐like complex required for inner membrane organization in mitochondria. J Cell Biol 195: 323–340 [DOI] [PMC free article] [PubMed] [Google Scholar]
- 25. von der Malsburg K, Muller JM, Bohnert M, Oeljeklaus S, Kwiatkowska P, Becker T, Loniewska‐Lwowska A, Wiese S, Rao S, Milenkovic D et al (2011) Dual role of mitofilin in mitochondrial membrane organization and protein biogenesis. Dev Cell 21: 694–707 [DOI] [PubMed] [Google Scholar]
- 26. Pfanner N, van der Laan M, Amati P, Capaldi RA, Caudy AA, Chacinska A, Darshi M, Deckers M, Hoppins S, Icho T et al (2014) Uniform nomenclature for the mitochondrial contact site and cristae organizing system. J Cell Biol 204: 1083–1086 [DOI] [PMC free article] [PubMed] [Google Scholar]
- 27. Abrams AJ, Hufnagel RB, Rebelo A, Zanna C, Patel N, Gonzalez MA, Campeanu IJ, Griffin LB, Groenewald S, Strickland AV et al (2015) Mutations in SLC25A46, encoding a UGO1‐like protein, cause an optic atrophy spectrum disorder. Nat Genet 47: 926–932 [DOI] [PMC free article] [PubMed] [Google Scholar]
- 28. Barrera M, Koob S, Dikov D, Vogel F, Reichert AS (2016) OPA1 functionally interacts with MIC60 but is dispensable for crista junction formation. FEBS Lett 590: 3309–3322 [DOI] [PubMed] [Google Scholar]
- 29. Genin EC, Plutino M, Bannwarth S, Villa E, Cisneros‐Barroso E, Roy M, Ortega‐Vila B, Fragaki K, Lespinasse F, Pinero‐Martos E et al (2015) CHCHD10 mutations promote loss of mitochondrial cristae junctions with impaired mitochondrial genome maintenance and inhibition of apoptosis. EMBO Mol Med 8: 58–72 [DOI] [PMC free article] [PubMed] [Google Scholar]
- 30. Glytsou C, Calvo E, Cogliati S, Mehrotra A, Anastasia I, Rigoni G, Raimondi A, Shintani N, Loureiro M, Vazquez J et al (2016) Optic atrophy 1 is epistatic to the core MICOS component MIC60 in mitochondrial cristae shape control. Cell Rep 17: 3024–3034 [DOI] [PMC free article] [PubMed] [Google Scholar]
- 31. Körner C, Barrera M, Dukanovic J, Eydt K, Harner M, Rabl R, Vogel F, Rapaport D, Neupert W, Reichert AS (2012) The C‐terminal domain of Fcj1 is required for formation of crista junctions and interacts with the TOB/SAM complex in mitochondria. Mol Biol Cell 23: 2143–2155 [DOI] [PMC free article] [PubMed] [Google Scholar]
- 32. Ott C, Ross K, Straub S, Thiede B, Gotz M, Goosmann C, Krischke M, Mueller MJ, Krohne G, Rudel T et al (2012) Sam50 functions in mitochondrial intermembrane space bridging and biogenesis of respiratory complexes. Mol Cell Biol 32: 1173–1188 [DOI] [PMC free article] [PubMed] [Google Scholar]
- 33. Pinero‐Martos E, Ortega‐Vila B, Pol‐Fuster J, Cisneros‐Barroso E, Ruiz‐Guerra L, Medina‐Dols A, Heine‐Suner D, Llado J, Olmos G, Vives‐Bauza C (2016) Disrupted in Schizophrenia 1 (DISC1) is a constituent of the mammalian Mitochondrial contact site and Cristae Organizing System (MICOS) complex, and is essential for oxidative phosphorylation. Hum Mol Genet 25: 4157–4169 [DOI] [PMC free article] [PubMed] [Google Scholar]
- 34. Xie J, Marusich MF, Souda P, Whitelegge J, Capaldi RA (2007) The mitochondrial inner membrane protein mitofilin exists as a complex with SAM50, metaxins 1 and 2, coiled‐coil‐helix coiled‐coil‐helix domain‐containing protein 3 and 6 and DnaJC11. FEBS Lett 581: 3545–3549 [DOI] [PubMed] [Google Scholar]
- 35. Barbot M, Jans DC, Schulz C, Denkert N, Kroppen B, Hoppert M, Jakobs S, Meinecke M (2015) Mic10 oligomerizes to bend mitochondrial inner membranes at cristae junctions. Cell Metab 21: 756–763 [DOI] [PubMed] [Google Scholar]
- 36. Bohnert M, Zerbes RM, Davies KM, Muhleip AW, Rampelt H, Horvath SE, Boenke T, Kram A, Perschil I, Veenhuis M et al (2015) Central role of Mic10 in the mitochondrial contact site and cristae organizing system. Cell Metab 21: 747–755 [DOI] [PubMed] [Google Scholar]
- 37. Milenkovic D, Larsson NG (2015) Mic10 oligomerization pinches off mitochondrial cristae. Cell Metab 21: 660–661 [DOI] [PMC free article] [PubMed] [Google Scholar]
- 38. Eydt K, Davies KM, Behrendt C, Wittig I, Reichert AS (2017) Cristae architecture is determined by an interplay of the MICOS complex and the F1FO ATP synthase via Mic27 and Mic10. Microbial Cell 4: 259–272 [DOI] [PMC free article] [PubMed] [Google Scholar]
- 39. Rampelt H, Bohnert M, Zerbes RM, Horvath SE, Warscheid B, Pfanner N, van der Laan M (2017) Mic10, a core subunit of the mitochondrial contact site and cristae organizing system, interacts with the dimeric F1Fo‐ATP synthase. J Mol Biol 429: 1162–1170 [DOI] [PubMed] [Google Scholar]
- 40. Hessenberger M, Zerbes RM, Rampelt H, Kunz S, Xavier AH, Purfurst B, Lilie H, Pfanner N, van der Laan M, Daumke O (2017) Regulated membrane remodeling by Mic60 controls formation of mitochondrial crista junctions. Nat Commun 8: 15258 [DOI] [PMC free article] [PubMed] [Google Scholar]
- 41. Tarasenko D, Barbot M, Jans DC, Kroppen B, Sadowski B, Heim G, Mobius W, Jakobs S, Meinecke M (2017) The MICOS component Mic60 displays a conserved membrane‐bending activity that is necessary for normal cristae morphology. J Cell Biol 216: 889–899 [DOI] [PMC free article] [PubMed] [Google Scholar]
- 42. Weber TA, Koob S, Heide H, Wittig I, Head B, van der Bliek A, Brandt U, Mittelbronn M, Reichert AS (2013) APOOL is a cardiolipin‐binding constituent of the Mitofilin/MINOS protein complex determining cristae morphology in mammalian mitochondria. PLoS ONE 8: e63683 [DOI] [PMC free article] [PubMed] [Google Scholar]
- 43. Koob S, Barrera M, Anand R, Reichert AS (2015) The non‐glycosylated isoform of MIC26 is a constituent of the mammalian MICOS complex and promotes formation of crista junctions. Biochem Biophys Acta 1853: 1551–1563 [DOI] [PubMed] [Google Scholar]
- 44. Anand R, Strecker V, Urbach J, Wittig I, Reichert AS (2016) Mic13 is essential for formation of crista junctions in mammalian cells. PLoS ONE 11: e0160258 [DOI] [PMC free article] [PubMed] [Google Scholar]
- 45. Guarani V, McNeill EM, Paulo JA, Huttlin EL, Frohlich F, Gygi SP, Van Vactor D, Harper JW (2015) QIL1 is a novel mitochondrial protein required for MICOS complex stability and cristae morphology. Elife 4: 06265 [DOI] [PMC free article] [PubMed] [Google Scholar]
- 46. Penttila S, Jokela M, Bouquin H, Saukkonen AM, Toivanen J, Udd B (2015) Late onset spinal motor neuronopathy is caused by mutation in CHCHD10. Ann Neurol 77: 163–172 [DOI] [PubMed] [Google Scholar]
- 47. Tsai PI, Lin CH, Hsieh CH, Papakyrikos AM, Kim MJ, Napolioni V, Schoor C, Couthouis J, Wu RM, Wszolek ZK et al (2018) PINK1 phosphorylates MIC60/mitofilin to control structural plasticity of mitochondrial crista junctions. Mol Cell 69: 744–756.e6 [DOI] [PubMed] [Google Scholar]
- 48. Godiker J, Gruneberg M, DuChesne I, Reunert J, Rust S, Westermann C, Wada Y, Classen G, Langhans CD, Schlingmann KP et al (2018) QIL1‐dependent assembly of MICOS complex‐lethal mutation in C19ORF70 resulting in liver disease and severe neurological retardation. J Hum Genet 63: 707–716 [DOI] [PubMed] [Google Scholar]
- 49. Guarani V, Jardel C, Chretien D, Lombes A, Benit P, Labasse C, Lacene E, Bourillon A, Imbard A, Benoist JF et al (2016) QIL1 mutation causes MICOS disassembly and early onset fatal mitochondrial encephalopathy with liver disease. Elife 5: e17163 [DOI] [PMC free article] [PubMed] [Google Scholar]
- 50. Russell BE, Whaley KG, Bove KE, Labilloy A, Lombardo RC, Hopkin RJ, Leslie ND, Prada C, Assouline Z, Barcia G et al (2019) Expanding and underscoring the hepato‐encephalopathic phenotype of QIL1/MIC13. Hepatology 70: 1066–1070 [DOI] [PMC free article] [PubMed] [Google Scholar]
- 51. Zeharia A, Friedman JR, Tobar A, Saada A, Konen O, Fellig Y, Shaag A, Nunnari J, Elpeleg O (2016) Mitochondrial hepato‐encephalopathy due to deficiency of QIL1/MIC13 (C19orf70), a MICOS complex subunit. Eur J Hum Genet 24: 1778–1782 [DOI] [PMC free article] [PubMed] [Google Scholar]
- 52. Huynen MA, Muhlmeister M, Gotthardt K, Guerrero‐Castillo S, Brandt U (2016) Evolution and structural organization of the mitochondrial contact site (MICOS) complex and the mitochondrial intermembrane space bridging (MIB) complex. Biochem Biophys Acta 1863: 91–101 [DOI] [PubMed] [Google Scholar]
- 53. Munoz‐Gomez SA, Slamovits CH, Dacks JB, Baier KA, Spencer KD, Wideman JG (2015) Ancient homology of the mitochondrial contact site and cristae organizing system points to an endosymbiotic origin of mitochondrial cristae. Curr Biol 25: 1489–1495 [DOI] [PubMed] [Google Scholar]
- 54. Callegari S, Muller T, Schulz C, Lenz C, Jans DC, Wissel M, Opazo F, Rizzoli SO, Jakobs S, Urlaub H et al (2019) A MICOS‐TIM22 association promotes carrier import into human mitochondria. J Mol Biol 431: 2835–2851 [DOI] [PubMed] [Google Scholar]
- 55. John GB, Shang Y, Li L, Renken C, Mannella CA, Selker JM, Rangell L, Bennett MJ, Zha J (2005) The mitochondrial inner membrane protein mitofilin controls cristae morphology. Mol Biol Cell 16: 1543–1554 [DOI] [PMC free article] [PubMed] [Google Scholar]
- 56. Jans DC, Wurm CA, Riedel D, Wenzel D, Stagge F, Deckers M, Rehling P, Jakobs S (2013) STED super‐resolution microscopy reveals an array of MINOS clusters along human mitochondria. Proc Natl Acad Sci USA 110: 8936–8941 [DOI] [PMC free article] [PubMed] [Google Scholar]
- 57. Stoldt S, Stephan T, Jans DC, Bruser C, Lange F, Keller‐Findeisen J, Riedel D, Hell SW, Jakobs S (2019) Mic60 exhibits a coordinated clustered distribution along and across yeast and mammalian mitochondria. Proc Natl Acad Sci USA 116: 9853–9858 [DOI] [PMC free article] [PubMed] [Google Scholar]
- 58. Friedman JR, Mourier A, Yamada J, McCaffery JM, Nunnari J (2015) MICOS coordinates with respiratory complexes and lipids to establish mitochondrial inner membrane architecture. Elife 4: 07739 [DOI] [PMC free article] [PubMed] [Google Scholar]
- 59. Appelhans T, Busch KB (2017) Dynamic imaging of mitochondrial membrane proteins in specific sub‐organelle membrane locations. Biophys Rev 9: 345–352 [DOI] [PMC free article] [PubMed] [Google Scholar]
- 60. Wolf DM, Segawa M, Kondadi AK, Anand R, Bailey ST, Reichert AS, van der Bliek AM, Shackelford DB, Liesa M, Shirihai OS (2019) Individual cristae within the same mitochondrion display different membrane potentials and are functionally independent. EMBO J 38: e101056 [DOI] [PMC free article] [PubMed] [Google Scholar]
- 61. Gautier A, Juillerat A, Heinis C, Correa IR Jr, Kindermann M, Beaufils F, Johnsson K (2008) An engineered protein tag for multiprotein labeling in living cells. Chem Biol 15: 128–136 [DOI] [PubMed] [Google Scholar]
- 62. Keppler A, Gendreizig S, Gronemeyer T, Pick H, Vogel H, Johnsson K (2003) A general method for the covalent labeling of fusion proteins with small molecules in vivo . Nat Biotechnol 21: 86–89 [DOI] [PubMed] [Google Scholar]
- 63. Lukinavicius G, Umezawa K, Olivier N, Honigmann A, Yang G, Plass T, Mueller V, Reymond L, Correa IR Jr, Luo ZG et al (2013) A near‐infrared fluorophore for live‐cell super‐resolution microscopy of cellular proteins. Nat Chem 5: 132–139 [DOI] [PubMed] [Google Scholar]
- 64. Twig G, Elorza A, Molina AJA, Mohamed H, Wikstrom JD, Walzer G, Stiles L, Haigh SE, Katz S, Las G et al (2008) Fission and selective fusion govern mitochondrial segregation and elimination by autophagy. EMBO J 27: 433–446 [DOI] [PMC free article] [PubMed] [Google Scholar]
- 65. Kukat C, Davies KM, Wurm CA, Spahr H, Bonekamp NA, Kuhl I, Joos F, Polosa PL, Park CB, Posse V et al (2015) Cross‐strand binding of TFAM to a single mtDNA molecule forms the mitochondrial nucleoid. Proc Natl Acad Sci USA 112: 11288–11293 [DOI] [PMC free article] [PubMed] [Google Scholar]
- 66. Schroeder LK, Barentine AES, Merta H, Schweighofer S, Zhang Y, Baddeley D, Bewersdorf J, Bahmanyar S (2018) Dynamic nanoscale morphology of the ER surveyed by STED microscopy. J Cell Biol 218: 83–96 [DOI] [PMC free article] [PubMed] [Google Scholar]
- 67. Shin W, Ge L, Arpino G, Villarreal SA, Hamid E, Liu H, Zhao WD, Wen PJ, Chiang HC, Wu LG (2018) Visualization of membrane pore in live cells reveals a dynamic‐pore theory governing fusion and endocytosis. Cell 173: 934–945.e12 [DOI] [PMC free article] [PubMed] [Google Scholar]
- 68. Huang X, Fan J, Li L, Liu H, Wu R, Wu Y, Wei L, Mao H, Lal A, Xi P et al (2018) Fast, long‐term, super‐resolution imaging with Hessian structured illumination microscopy. Nat Biotechnol 36: 451–459 [DOI] [PubMed] [Google Scholar]
- 69. Wang C, Taki M, Sato Y, Tamura Y, Yaginuma H, Okada Y, Yamaguchi S (2019) A photostable fluorescent marker for the superresolution live imaging of the dynamic structure of the mitochondrial cristae. Proc Natl Acad Sci USA 116: 15817–15822 [DOI] [PMC free article] [PubMed] [Google Scholar]
- 70. Stephan T, Roesch A, Riedel D, Jakobs S (2019) Live‐cell STED nanoscopy of mitochondrial cristae. Sci Rep 9: 12419 [DOI] [PMC free article] [PubMed] [Google Scholar]
- 71. Kates M, Syz JY, Gosser D, Haines TH (1993) pH‐dissociation characteristics of cardiolipin and its 2’‐deoxy analogue. Lipids 28: 877–882 [DOI] [PubMed] [Google Scholar]
- 72. Strauss M, Hofhaus G, Schroder RR, Kuhlbrandt W (2008) Dimer ribbons of ATP synthase shape the inner mitochondrial membrane. EMBO J 27: 1154–1160 [DOI] [PMC free article] [PubMed] [Google Scholar]
- 73. Rieger B, Junge W, Busch KB (2014) Lateral pH gradient between OXPHOS complex IV and F(0)F(1) ATP‐synthase in folded mitochondrial membranes. Nat Commun 5: 3103 [DOI] [PubMed] [Google Scholar]
- 74. Wilkens V, Kohl W, Busch K (2013) Restricted diffusion of OXPHOS complexes in dynamic mitochondria delays their exchange between cristae and engenders a transitory mosaic distribution. J Cell Sci 126: 103–116 [DOI] [PubMed] [Google Scholar]
- 75. Aaltonen MJ, Friedman JR, Osman C, Salin B, di Rago JP, Nunnari J, Langer T, Tatsuta T (2016) MICOS and phospholipid transfer by Ups2‐Mdm35 organize membrane lipid synthesis in mitochondria. J Cell Biol 213: 525–534 [DOI] [PMC free article] [PubMed] [Google Scholar]
- 76. Kang M, Day CA, Kenworthy AK, DiBenedetto E (2012) Simplified equation to extract diffusion coefficients from confocal FRAP data. Traffic 13: 1589–1600 [DOI] [PMC free article] [PubMed] [Google Scholar]
- 77. Schindelin J, Arganda‐Carreras I, Frise E, Kaynig V, Longair M, Pietzsch T, Preibisch S, Rueden C, Saalfeld S, Schmid B et al (2012) Fiji: an open‐source platform for biological‐image analysis. Nat Methods 9: 676–682 [DOI] [PMC free article] [PubMed] [Google Scholar]
- 78. Tinevez JY, Perry N, Schindelin J, Hoopes GM, Reynolds GD, Laplantine E, Bednarek SY, Shorte SL, Eliceiri KW (2017) TrackMate: an open and extensible platform for single‐particle tracking. Methods 115: 80–90 [DOI] [PubMed] [Google Scholar]
- 79. Wagner T, Kroll A, Haramagatti CR, Lipinski HG, Wiemann M (2017) Classification and segmentation of nanoparticle diffusion trajectories in cellular micro environments. PLoS ONE 12: e0170165 [DOI] [PMC free article] [PubMed] [Google Scholar]
- 80. Tarantino N, Tinevez JY, Crowell EF, Boisson B, Henriques R, Mhlanga M, Agou F, Israel A, Laplantine E (2014) TNF and IL‐1 exhibit distinct ubiquitin requirements for inducing NEMO‐IKK supramolecular structures. J Cell Biol 204: 231–245 [DOI] [PMC free article] [PubMed] [Google Scholar]
- 81. Giannone G, Hosy E, Levet F, Constals A, Schulze K, Sobolevsky AI, Rosconi MP, Gouaux E, Tampe R, Choquet D et al (2010) Dynamic superresolution imaging of endogenous proteins on living cells at ultra‐high density. Biophys J 99: 1303–1310 [DOI] [PMC free article] [PubMed] [Google Scholar]
- 82. Schoonderwoert V, Dijkstra R, Luckinavicius G, Kobler O, Voort HVD (2013) Huygens STED deconvolution increases signal‐to‐noise and image resolution towards 22 nm. Microsc Today 21: 38–44 [Google Scholar]
- 83. Cipolat S, Martins de Brito O, Dal Zilio B, Scorrano L (2004) OPA1 requires mitofusin 1 to promote mitochondrial fusion. Proc Natl Acad Sci USA 101: 15927–15932 [DOI] [PMC free article] [PubMed] [Google Scholar]
Associated Data
This section collects any data citations, data availability statements, or supplementary materials included in this article.
Supplementary Materials
Appendix
Expanded View Figures PDF
Movie EV1
Movie EV2
Movie EV3
Movie EV4
Movie EV5
Movie EV6
Movie EV7
Movie EV8
Movie EV9
Movie EV10
Movie EV11
Movie EV12
Movie EV13
Movie EV14
Movie EV15
Review Process File