

Abstract
Mitochondrial dysfunction promotes metabolic stress responses in a cell‐autonomous as well as organismal manner. The wasting hormone growth differentiation factor 15 (GDF15) is recognized as a biomarker of mitochondrial disorders, but its pathophysiological function remains elusive. To test the hypothesis that GDF15 is fundamental to the metabolic stress response during mitochondrial dysfunction, we investigated transgenic mice (Ucp1‐TG) with compromised muscle‐specific mitochondrial OXPHOS capacity via respiratory uncoupling. Ucp1‐TG mice show a skeletal muscle‐specific induction and diurnal variation of GDF15 as a myokine. Remarkably, genetic loss of GDF15 in Ucp1‐TG mice does not affect muscle wasting or transcriptional cell‐autonomous stress response but promotes a progressive increase in body fat mass. Furthermore, muscle mitochondrial stress‐induced systemic metabolic flexibility, insulin sensitivity, and white adipose tissue browning are fully abolished in the absence of GDF15. Mechanistically, we uncovered a GDF15‐dependent daytime‐restricted anorexia, whereas GDF15 is unable to suppress food intake at night. Altogether, our evidence suggests a novel diurnal action and key pathophysiological role of mitochondrial stress‐induced GDF15 in the regulation of systemic energy metabolism.
Keywords: anorexia, GDF15, integrated stress response, mitochondrial dysfunction, muscle wasting
Subject Categories: Metabolism, Molecular Biology of Disease
Growth differentiation factor 15 (GDF15) is highly induced during mitochondrial dysfunction, which in turn promotes a diurnal anorectic response that controls systemic metabolic adaptation.

Introduction
Mitochondria are essential organelles for cellular ATP production through oxidative phosphorylation (OXPHOS) as well as the regulation of cellular physiology 1. Moreover, mitochondrial function is crucial for integration and generation of metabolic signals via interaction with other cellular organelles such as the endoplasmic reticulum 2. Mitochondrial diseases are one of the most common types of inherited metabolic disorders that can manifest at different stages of age and in any organ with strong variability in clinical features 3. Notably, the first human mitochondrial disease, Luft's disease, was discovered 60 years ago 4, with clinical presentation of skeletal muscle atrophy due to increased muscle‐specific mitochondrial respiratory uncoupling, energy depletion, and systemic hypermetabolism 5. Thereby, Luft and colleagues first described how a tissue‐specific compromised mitochondrial function governs systemic energy homeostasis. Currently, our understanding of the mechanisms that promote the pathophysiological consequences of mitochondrial dysfunction still remains limited. Mounting evidence indicates that the impairment of mitochondrial OXPHOS is underlying the induction of an integrated stress response (ISR) that involves both cell‐autonomous signaling pathways 6, 7, 8 as well as the induction of cytokines which potentially affect systemic metabolism in an cell‐non‐autonomous fashion 9, 10. However, crucial metabolic mediators guiding the endocrine crosstalk during muscle mitochondrial OXPHOS deficiency are poorly described.
In the last decade, the wasting hormone growth differentiation factor 15 (GDF15, also named macrophage inhibitory cytokine‐1 [MIC‐1], placental bone morphogenetic protein [PLAB], placental transforming growth factor‐β [PTGF‐beta], prostate derived factor [PDF], or non‐steroidal anti‐inflammatory drugs‐activated gene [NAG‐1]) gained momentum as a biomarker of cancer cachexia, cellular stress, mitochondrial dysfunction, and aging 11, 12, 13. GDF15 belongs to the transforming growth factor beta superfamily and was first identified 1997 in activated macrophages 14 as well as a secretory protein with high expression in the placenta 15. Circulating GDF15 is highly elevated in patients with cancer and severe anorexia 16, chronic inflammation 17, and pediatric heart disorder 18, as well as in patients with mitochondrial diseases 19, 20, 21, 22. By now, elevated skeletal muscle expression of GDF15 has been documented under conditions of muscle‐specific mitochondrial stress in humans and different mouse models 7, 20, 23, 24, 25. With regard to systemic energy homeostasis, a potent anorectic action of endogenous GDF15 was initially described in a mouse model of cancer and cachexia wasting syndrome 26 and very recently for exogenously administrated GDF15 in mice 27, 28, 29, 30, 31. However, the biological function of GDF15 as muscle‐secreted cytokine (also termed myokine) in response to mitochondrial dysfunction remains elusive.
Here, we propose a crucial role for endogenous GDF15 as a metabolic mediator in facilitating muscle mitochondrial stress‐induced systemic metabolic remodeling. We report that GDF15 as a myokine is negligible for muscle mitochondrial function, cell‐autonomous ISR induction, and mitochondrial stress‐driven skeletal muscle atrophy. On the other hand, we uncovered that genetic ablation of GDF15 during muscle mitochondrial dysfunction prevented a daytime‐restricted anorexia, promotes a robust fat mass expansion, and abolishes white adipose tissue browning and insulin sensitivity. Based on our results, muscle‐derived GDF15 emerges as a critical regulator of diurnal energy balance which is instrumental for driving a systemic metabolic response during mitochondrial dysfunction.
Results
Muscle mitochondrial stress promotes GDF15 as a myokine
Using transgenic mice with compromised skeletal muscle‐specific mitochondrial OXPHOS capacity via respiratory uncoupling (HSA‐Ucp1‐TG [TG]) 32, 33, we explored the potential induction of GDF15 as a myokine (Fig 1A). First, using high‐resolution respirometry of permeabilized muscle fibers, we confirmed the increased uncoupled (LEAK) respiration in soleus (SOL, slow‐oxidative fiber type) and extensor digitorum longus (EDL, fast‐glycolytic fiber type) of TG mice compared to wild‐type (WT) controls (Fig 1B). Next, we validated the induction of muscle ISR via elevated gene expression of Atf4, Atf5, Atf6, and Chop (Fig 1C) and phosphorylation of eukaryotic translation initiation factor 2 alpha (eIF2α) (Fig 1D and E) in TG mice. Recently, a CHOP‐dependent induction of GDF15 during muscle ISR was described 23. To test for Gdf15 induction in TG mice, we performed a multi‐tissue transcriptomic profiling. In line with the HSA‐driven skeletal muscle‐specific UCP1 transgene 32, we found a strong induction of Gdf15 exclusively in skeletal muscles of TG mice, with the highest induction observed in mixed and predominantly fast‐glycolytic fiber type muscle (EDL, tibialis anterior [TA], gastrocnemius [Gastroc], quadriceps [Quad]) and a lower induction in oxidative fiber type muscles (SOL, diaphragm, esophagus) of TG animals (Fig 1F and G). Importantly, Gdf15 expression was not affected in the heart, as well as in non‐muscle tissues such as liver, kidney, spleen, lung, or different adipose tissue depots of TG mice. Accordingly, skeletal muscle GDF15 protein expression (Fig 1H) and ex vivo secretion from soleus or EDL muscles were induced in TG mice only (Fig 1I). Plasma concentrations of circulating GDF15 levels were strongly increased in TG mice independent of sex, low or high caloric diet, or age (Fig 1J–L). To confirm the induction of GDF15 by mitochondrial uncoupling in muscle cells in vitro, we treated immortalized mouse C2C12 myocytes for 5 h with the chemical mitochondrial uncoupler FCCP (Fig 1M) and revealed a dose‐dependent mRNA induction of Gdf15 and ISR markers (Fig 1N). Altogether, these findings validate our genetic mouse model of muscle mitochondrial stress‐induced ISR induction and skeletal muscle‐derived GDF15 secretion.
Figure 1. Muscle mitochondrial stress promotes GDF15 as a myokine.

-
ASchematic representation of HSA‐Ucp1‐transgenic (TG) mouse line as model of compromised skeletal muscle‐specific mitochondrial OXPHOS capacity via respiratory uncoupling.
-
BUncoupled (LEAK) mitochondrial respiration of soleus (SOL) and extensor digitorum longus (EDL) muscle of wild‐type (WT) versus Ucp1‐TG (TG) mice (WT n = 9, TG n = 5).
-
CRelative mRNA expression in quadriceps (Quad) of ISR components (n = 8 per genotype).
-
D, ERepresentative immunoblots of ISR component eIF2α and quantification of phospho‐eIF2α (p‐eIF2aSer51) relative protein expression in quadriceps skeletal muscle (WT n = 3, TG n = 4).
-
F, GMulti‐tissue transcriptomic profiling of Gdf15 gene expression. Heatmap is shown as raw ct expression values (n = 4 per genotype). Quantification of Gdf15 mRNA expression in TG mice is shown as fold change compared to WT littermates (WT n = 5, TG n = 4).
-
HSkeletal muscle (Quad and Gastroc) GDF15 protein content normalized to total protein content (WT n = 9, TG n = 18).
-
IEx vivo secretion of GDF15 from SOL and EDL muscle of WT versus TG mice (n = 6 per genotype) after 2‐h incubation normalized to muscle wet weight (mg).
-
JMouse GDF15 plasma levels in post‐absorptive state of male and female WT versus TG mice at 20 weeks of age (male WT n = 8, TG n = 9; female WT n = 5, TG n = 6).
-
KMouse GDF15 plasma levels in post‐absorptive state of male WT versus TG mice fed low‐fat diet (LFD) or high‐fat diet (HFD) at 24 weeks of age (LFD WT n = 6, TG n = 5; HFD WT n = 5, TG n = 5).
-
LMouse GDF15 plasma levels in post‐absorptive state of young (10 weeks) versus old (95 weeks) male WT and TG mice (young WT n = 10, TG n = 13; old WT n = 13, TG n = 13).
-
MRepresentative scheme of in vitro study design in differentiated C2C12 myocytes.
-
NGdf15 gene expression of differentiated C2C12 myotubes treated with vehicle control (Ctrl) or chemical mitochondrial uncoupler (FCCP, 1 μM versus 5 μM) for 5 h (n = 3 biological replicates).
GDF15‐independent muscle wasting and mitochondrial integrated stress response
Given the robust induction of GDF15 during muscle mitochondrial uncoupling and the fact that the pathophysiological role of ISR‐induced GDF15 as a myokine is unknown, we crossbred TG and whole‐body Gdf15‐knockout (KO) 34 mice and performed a comprehensive in vivo phenotypic, metabolic, and molecular profiling in WT, KO, TG, and Ucp1‐TGxGdf15‐KO (TGxKO) animals. All mouse experiments were accomplished under standard chow feeding conditions. The genotypes were determined by PCR (Fig 2A) and further confirmed on mRNA expression level (Fig 2B). We further confirmed elevated plasma GDF15 levels in TG mice, which were undetectable in age‐matched KO and TGxKO mice (Figs 2C and EV1A).
Figure 2. GDF15‐independent muscle wasting and mitochondrial integrated stress response.

-
AGenotyping PCR panel of Gdf15 and HSA‐Ucp1 loci shown for wild‐type (WT), Gdf15‐KO (KO), Ucp1‐TG (TG), and Ucp1‐TGxGdf15‐KO (TGxKO) mice.
-
BRelative mRNA expression in quadriceps (Quad) of Ucp1 and Gdf15 in 20‐week‐old male WT (n = 8), TG (n = 7), and TGxKO (n = 6) mice.
-
CPlasma mGDF15 levels at 20 weeks of age (WT n = 9, TG n = 10, TGxKO n = 9).
-
DVoluntary wheel running (VWR) activity shown hourly over 24 h at 15 weeks of age (n = 4 per genotype).
-
EGrip strength at 10–20 weeks of age (WT n = 15, TG n = 14, TGxKO n = 11).
-
FSkeletal muscle mass relative to body lean mass of quadriceps (Quad) and gastrocnemius (Gastroc) from mice at 95 weeks of age (WT n = 8, TG n = 5, TGxKO n = 5).
-
G, HRepresentative H&E histological staining of tibialis anterior (TA) muscle (G) (scale bars represent 50 μm), and cross‐sectional area (CSA) of myofibers (H) at 95 weeks (WT n = 12, TG n = 8, TGxKO n = 8).
-
IRepresentative traces of oxygen consumption rate (OCR) during substrate–uncoupler–inhibitor titration (SUIT) protocol for mitochondrial respiratory capacity in permeabilized mouse soleus muscle fibers, PM (pyruvate+malate; LEAK respiration), ADP (OXPHOS capacity), Cyt c (cytochrome c, integrity of outer mt‐membrane), G (glutamate;), S (succinate), U (uncoupler, FCCP), Rot (rotenone), and Ama (antimycin A; less than 2% residual oxygen consumption, ROX).
-
J–LMitochondrial respiratory capacity (oxygen consumption rate, OCR) from oxidative soleus (SOL) (J) and glycolytic extensor digitorum longus (EDL) muscle fibers (K), and NetOXPHOS control ratio of 95‐week‐old mice (L) (n = 5 per genotype).
-
MQuadriceps (Quad) relative mRNA expression of ISR components at 95 weeks of age (WT n = 8, TG n = 5, TGxKO n = 5).
-
NRepresentative immunoblots of ISR component eIF2α in quadriceps (Quad) muscle of 95‐week‐old mice.
-
OGastrocnemius enzyme activity of NAD(P)H quinone dehydrogenase 1 (NQO1) and total glutathione peroxidase (GPX) in 95‐week‐old male mice (WT n = 8, TG n = 5, TGxKO n = 5).
Figure EV1. Skeletal muscle phenotype and function of male Gdf15‐KO animals.

-
APlasma GDF15 levels at 20 weeks of age (WT n = 9, KO n = 9).
-
BVoluntary wheel running (VWR) activity shown hourly over 24 h at 15 weeks of age (n = 4 per genotype).
-
CGrip strength at 10–20 weeks of age (WT n = 15, KO n = 14).
-
DSkeletal muscle mass relative to body lean mass of quadriceps (Quad), gastrocnemius (Gastroc), soleus, and EDL (WT n = 9, KO = 10).
-
ERepresentative H&E histological staining of tibialis anterior (TA) muscle (G) (scale bars represent 50 μm)
-
F–HMitochondrial respiratory capacity (oxygen consumption rate, OCR) from oxidative soleus (SOL) (F) and glycolytic extensor digitorum longus (EDL) muscle fibers (G), and NetOXPHOS control ratio (H) (n = 5 per genotype).
-
I, JRepresentative immunoblots of OXPHOS in quadriceps (Quad) muscle (I) and their corresponding quantifications normalized to MFN2 (J) (n = 6 per genotype).
-
KSkeletal muscle (Quad) relative mRNA expression of ISR components (WT n = 8, KO n = 6).
-
LRepresentative immunoblots of ISR component eIF2α and phospho‐eIF2α (p‐eIF2aSer51), TG sample was included as positive control.
-
MSkeletal muscle (Gastroc) enzyme activity of NQO1 and GPX (WT n = 8, KO n = 6).
Consistent with previous findings 35, male KO mice were indistinguishable in appearance and skeletal muscle phenotype from age‐matched WT controls (Fig EV1B–H), suggesting that GDF15 does not play a major role as a physiological regulator of skeletal muscle function and body weight in healthy animals. Next, we sought to evaluate the muscle cell‐autonomous relevance of GDF15 induction for skeletal muscle during compromised mitochondrial function. In both TG and TGxKO mice, voluntary wheel running (VWR) activity was not impaired (Fig 2D) whereas muscle grip strength was dramatically reduced compared to WT controls (Fig 2E). As reported previously 7, we found a 50% decrease of quadriceps and gastrocnemius muscle‐to‐lean body mass ratio in TG mice, suggesting a substantial wasting of skeletal muscle tissue (Fig 2F). This skeletal muscle atrophy was unaffected in TGxKO mice (Figs 2F and EV2A). In addition, morphological analyses showed no presence of severe structural alterations but a 40% reduction of the cross‐sectional area of myofibers in both TG and TGxKO mice at 20 weeks (Fig EV2B and C) and up to 95 weeks of age (Fig 2G and H). Immunoblotting analyses confirmed a muscle fiber switch toward slow‐oxidative type 36, and activation of AMP‐activated protein kinase (AMPK) as well as a preserved protein expression of mitochondrial OXPHOS complexes in muscles of TG and TGxKO mice (Fig EV2D–I). Furthermore, characterization of skeletal muscle mitochondrial respiratory capacity (Fig 2I) displayed no difference between TG and TGxKO mice. Both oxidative soleus and glycolytic EDL muscles showed higher uncoupled respiration (Fig 2J and K), consequently causing a reduction in total OXPHOS capacity independent of GDF15 action (Fig 2L). Mitochondrial respiratory function and OXPHOS protein expression were unaffected in KO controls (Fig EV1I,J).
Figure EV2. GDF15‐independent muscle wasting and cell‐autonomous stress response.

-
AMuscle mass relative to body lean mass of quadriceps (Quad), gastrocnemius (Gastroc), soleus, and extensor digitorum longus (EDL) muscles in 20‐week‐old male mice (WT n = 9, TG, n = 9, TGxKO = 10).
-
B, CRepresentative H&E histological staining of tibialis anterior (TA) muscle (B), and cross‐sectional area (CSA) of myofibers (C) at 20 weeks (WT n = 8, TG n = 6, TGxKO n = 8), scale bars represent 50 μm.
-
D–IRepresentative immunoblots and their corresponding quantifications (WT n = 8, TG n = 8, TGxKO n = 8), normalized to ATUB of p‐AMPKThr172/t‐AMPK (D, E), slow myosin (F, G), and OXPHOS (H, I) in quadriceps (Quad) muscle at 20 weeks of age.
-
JQuantification of ISR component eIF2α and of phospho‐eIF2α (p‐eIF2aSer51) relative protein expression in quadriceps skeletal muscle at 95 weeks of age (WT n = 8, TG n = 8, TGxKO n = 8).
We next evaluated skeletal muscle mitochondrial stress‐induced ISR induction. Here, we found that gene expression of ISR components Atf4, Atf6, and Chop (Fig 2M) and phosphorylation of eIF2a protein (Figs 2N and EV2J) remained highly induced in TGxKO muscles, while only Atf5 induction was reduced in aged TGxKO mice. Previously, we have shown a ISR‐driven remodeling of amino acid and one‐carbon metabolism in skeletal muscle of TG mice 7, which was later confirmed in a mouse model for mitochondrial myopathy 8. The expression level of the enzyme Psat1, involved in de novo serine synthesis, remained highly elevated, whereas expression of Mthfd2 as marker of one‐carbon metabolism expression was decreased in TGxKO versus TG animals (Fig 2M). Furthermore, chronic mild mitochondrial stress activates the anti‐oxidative capacity via NAD(P)H quinone dehydrogenase 1 (NQO1) and total glutathione peroxidase (GPX) induction 37. We could confirm the induction of NQO1 and GPX in TG muscle, which remained highly induced in TGxKO mice (Fig 2O). Under basal, non‐mitochondrial stress conditions, ISR markers as well as activity of anti‐oxidant enzymes remained unaffected in KO animals (Fig EV1K–M). Collectively, these findings suggest that GDF15 has neither a protective nor a detrimental cell‐autonomous action during muscle mitochondrial stress.
Genetic ablation of GDF15 drives adiposity during mitochondrial dysfunction
To determine whether muscle mitochondrial stress‐induced GDF15 impacts systemic metabolic phenotype, body mass development in early life as well as body composition during aging was monitored. Previous studies showed that the hepatic overexpression of GDF15 in mice lead to decreased body weight and fat mass under a normal chow diet 38, 39. In young adult mice up to 20 weeks of age, the decreased body mass of TG mice was partly recovered in TGxKO animals (Fig 3A). Importantly, this was not due to changes in body lean mass but a substantial increase in body fat mass of TGxKO mice (Fig 3B and C). With progressive aging, TGxKO mice fully recovered their body mass via body fat mass expansion while body lean mass remained unaffected (Fig 3D–F). In line with body fat mass, we found the subcutaneous and epididymal white adipose tissue (sWAT and eWAT) depot weights increased in TGxKO mice compared to TG and WT controls (Fig 3G and H). Male KO mice were indistinguishable in body composition and adipose tissue phenotype from age‐matched WT controls (Fig EV3A–H). Thus, genetic ablation of GDF15 during chronic muscle mitochondrial dysfunction promotes a robust fat mass expansion.
Figure 3. Genetic ablation of GDF15 drives adiposity during mitochondrial dysfunction.

-
A–CBody mass (A), body lean mass (B), and body fat mass (C) development.
-
D–FBody mass (D), body lean mass (E), and body fat mass (F) during aging at 20, 45, and 95 weeks of age.
-
G, HSubcutaneous white adipose tissue (sWAT) (G) and epididymal white adipose tissue (eWAT) (H) mass development at 10, 20, 45, and 95 weeks of age.
Figure EV3. Body composition and white adipose tissue mass of male Gdf15‐KO animals.

-
A–CBody mass (A), body lean mass (B), and body fat mass (C) development.
-
D–FBody mass (D), body lean mass (E), and body fat mass (F) during aging at 20, 45, and 95 weeks of age.
-
G, HSubcutaneous white adipose tissue (sWAT) (G) and epididymal white adipose tissue (eWAT) (H) mass development at 20, 45, and 95 weeks of age.
Genetic ablation of GDF15 abolishes white adipose tissue browning and systemic insulin sensitivity during mitochondrial dysfunction
Based on the above results, we tested whether genetic loss of GDF15 during muscle mitochondrial dysfunction further affects systemic metabolic responses. Recently, we and others have demonstrated that mitochondrial dysfunction in muscle promotes metabolic activation of WAT depots 23, 40, 41, 42, 43. In line with body composition and adipose tissue mass, male KO mice showed no differences in sWAT morphology, gene expression of browning markers, or UCP1 protein expression (Fig EV4A–C). Notably, sWAT browning with enhanced multilocular morphology (Fig 4A) and induced gene expression of brown fat markers observed in TG mice was fully blunted in adult TGxKO mice at 20 weeks of age (Fig 4B). In line with the transcriptional profile, UCP1 protein expression was highly induced in sWAT of TG mice, but absent in TGxKO mice (Fig 4C and D). In visceral eWAT, known as the classic WAT depot 44, no mRNA induction of brown fat markers was detected in both TG and TGxKO animals (Fig 4E), as well as KO control mice (Fig 4D). Despite the robust fat mass expansion observed in TGxKO mice, mRNA expression of Pparg as a transcriptional master regulator of adipogenesis as well as of the classic adipokines Leptin and Adipoq remained unaffected in both sWAT and eWAT depots in TG and TGxKO (Fig 4B and E).
Figure EV4. White adipose tissue browning profile, plasma metabolic mediators, and insulin sensitivity of male Gdf15‐KO animals.

-
A, BRepresentative H&E histological staining of sWAT at 20 weeks of age (scale bars represent 50 μm) (A) and relative mRNA expression profile in sWAT of male mice (WT n = 7, KO n = 8) (B).
-
CRepresentative immunoblots of UCP1 protein expression in sWAT of male mice at 20 weeks of age. TG samples were included as positive control.
-
DRelative mRNA expression profile in eWAT (WT n = 7, KO n = 8).
-
EPlasma FGF21 levels from male mice at 20 weeks of age (WT n = 8, KO n = 10).
-
FPlasma Leptin levels from male mice at 20 weeks of age (WT n = 8, KO n = 10).
-
GPost‐absorptive plasma insulin levels at 20 weeks of age (WT n = 8, KO n = 10).
-
H–JBlood glucose (H) and insulin levels (I) with total area under the curve (AUC) of insulin (J) during oral glucose tolerance test (oGTT) at 17 weeks of age (WT n = 5, KO n = 3).
Figure 4. Genetic ablation of GDF15 abolishes white adipose tissue browning and insulin sensitivity during mitochondrial dysfunction.

-
A, BRepresentative H&E histological staining of subcutaneous white adipose tissue (sWAT) at 20 weeks of age (scale bars represent 50 μm) (A) and relative mRNA expression profile in sWAT of male mice (WT n = 7, TG n = 8, TGxKO n = 8) (B).
-
C, DRepresentative immunoblots (C) and quantification (D) of UCP1 protein expression in sWAT of male mice at 20 weeks of age (WT n = 4, TG n = 6, TGxKO n = 4).
-
ERelative mRNA expression profile in epididymal white adipose tissue (eWAT) (WT n = 7, TG n = 8, TGxKO n = 8).
-
FPlasma FGF21 levels from male mice at 20 weeks of age (n = 10 per genotype).
-
GPlasma Leptin levels from male mice at 20 weeks of age (n = 5 per genotype).
-
HPost‐absorptive plasma insulin levels at 20 weeks of age (WT n = 8, TG n = 9, TG n = 9).
-
I–KBlood glucose (I) and insulin levels (J) with total area under the curve (AUC) of insulin (K) during oral glucose tolerance test (oGTT) at 17 weeks of age (WT n = 8, TG n = 11, TG n = 11).
Previously, a link between fibroblast growth factor 21 (FGF21), another well‐established marker of mitochondrial diseases, and sWAT browning during mitochondrial dysfunction was proposed 25, 40, 42, 43, 45. Remarkably, the loss of sWAT browning in TGxKO animals occurred despite high circulating FGF21 levels (Fig 4F). Consistent with body fat mass differences, plasma leptin levels were lowest in TG and elevated in TGxKO mice (Fig 4G). Finally, post‐absorptive hypoinsulinemia (Fig 4H) and improved systemic insulin sensitivity of TG mice were abolished in TGxKO mice (Fig 4I–K). Importantly, male KO mice showed no differences in plasma levels of FGF21, leptin, and insulin as well as in insulin sensitivity compared to WT mice (Fig EV4E–J). These data suggest a crucial role of GDF15 as endocrine acting metabolic cytokine in response to muscle‐specific mitochondrial dysfunction.
Mitochondrial stress‐induced GDF15 drives daytime‐restricted anorectic action
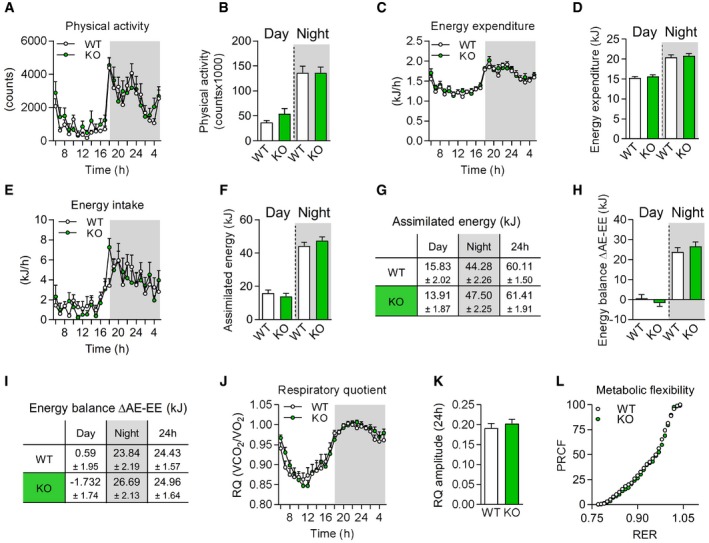
Next, to understand how mitochondrial stress‐induced GDF15 as a myokine regulates fat mass balance and systemic metabolic response we performed a comprehensive in vivo metabolic phenotyping via indirect calorimetry with simultaneous measurement of food intake, energy expenditure, and physical cage activity. Adult mice of all four genotypes at around 17 weeks of age were continuously recorded for 3 days and the last 24 h quantitatively analyzed. Consistent with the above described phenotypic parameters, KO controls showed no differences in any metabolic parameter from age‐matched WT mice (Fig EV5A–L).
Figure EV5. In vivo metabolic phenotyping of male Gdf15‐KO animals.
-
A–FPhysical activity (A, B), energy expenditure (C, D), total assimilated energy (E, F) of male mice shown hourly over 24 h and as day and night time.
-
GTable showing mean values of assimilated energy (kJ) at day/night time and per 24 h.
-
HEnergy balance calculated as delta of assimilated energy (AE) and energy expenditure (EE) and energy balance (J) per 24 h.
-
ITable showing mean values of energy balance (∆AE‐EE, kJ) at day/night time and per 24 h.
-
J–LRespiratory quotient (RQ) shown hourly over 24 h (J), RQ amplitude (K), and metabolic flexibility via percentage relative cumulative frequency (PRCF) (L).
There were no differences in physical activity (Fig 5A and B) but intriguingly, we observed a shift in the circadian course of food intake and energy expenditure in TG mice which was prevented in TGxKO animals (Fig 5C and E). In TG mice, total energy expenditure (Fig 5D) was reduced in particular during the day, consistent with a daytime‐restricted suppression of food intake (Fig 5F and G). Remarkably, genetic ablation of GDF15 fully abolished these effects in TGxKO animals. Accordingly, overall energy balance was negative during daytime in TG mice (−5.99 kJ ± 0.85) which was abrogated in TGxKO mice (Fig 5H). In contrast, assimilated energy (Fig 5F and G) and energy balance (Fig 5H and I) were higher in both TG and TGxKO mice compared to WT controls during the activity phase at night. Finally, calculation of the 24‐h energy balance revealed an excess daily energy incorporation by TGxKO mice of +3.48 kJ and +5.79 kJ compared to WT and TG mice, respectively (Fig 5I). This daily energy surplus is sufficient to explain the differences in body fat mass accumulation. The loss of GDF15‐dependent daytime‐restricted anorexia together with a preserved elevated night time energy intake thus drives the progressive fat accumulation observed in TGxKO mice. As a consequence of the diurnal variation of energy balance, skeletal muscle mitochondrial stress in TG mice promotes systemic metabolic flexibility as evident by an increased amplitude (Fig 5J and K) and shift of percent relative cumulative frequency (PRCF) (Fig 5L) of the respiratory quotient (RQ) 46. Strikingly, this increased metabolic flexibility was fully absent in TGxKO mice. Taken together, we here demonstrate for the first time a GDF15‐dependent diurnal anorexic response that reprograms systemic energy homeostasis and metabolic flexibility.
Figure 5. Muscle‐derived GDF15 promotes diurnal anorexia during mitochondrial dysfunction.

-
A–FPhysical activity (A, B), energy expenditure (C, D), total assimilated energy (E, F) of male mice shown hourly over 24 h and as day and night time.
-
GTable showing mean values of assimilated energy (kJ) at day/night time and per 24 h.
-
HEnergy balance (kJ) calculated as delta of assimilated energy (AE) and energy expenditure (EE).
-
ITable showing mean values of energy balance (∆AE‐EE, kJ) at day/night time and per 24 h.
-
J–LRespiratory quotient (RQ) shown hourly over 24 h (J), RQ amplitude (K), and metabolic flexibility via percentage relative cumulative frequency (PRCF) (L).
Diurnal variation of muscle‐derived GDF15 during mitochondrial dysfunction
As our data suggest a daytime‐restricted action of muscle‐derived GDF15, we further investigated whether mitochondrial stress‐induced ISR and GDF15 induction differ between day (10 am) and night (10 pm) time. Skeletal muscle gene expression of ISR markers and phosphorylation of eIF2α protein remained highly induced in TG mice at both day and night (Fig 6A–C). We next evaluated the transcriptional regulation of Rev‐erba, a well‐described regulator of metabolic genes in a circadian manner 47. Here, we found a regular circadian oscillation of Rev‐erba expression in skeletal muscle, liver, and eWAT of both WT and TG mice (Fig 6D), suggesting that the clock molecular machinery was not affected by mitochondrial dysfunction. Interestingly, skeletal muscle‐specific induction of Gdf15 mRNA (Fig 6E) and GDF15 protein expression (Fig 6F) was lower although still significantly elevated in TG mice at night versus day. Circadian Gdf15 expression remained unaffected in liver and eWAT of TG compared to WT control mice (Fig 6E). Finally, plasma analysis confirmed high circulating GDF15 levels of ≥ 400 pg/ml at day, whereas plasma levels at night dropped consistently to below 400 pg/ml (Fig 5G). The mechanisms behind the diurnal variations in GDF15 plasma and skeletal muscle expression are still to be understood but, altogether, these data suggest that endogenous GDF15 below a certain plasma level is unable to provide an endocrine signal and anorectic action at night during mitochondrial dysfunction. Thus, we propose a diurnal variation and daytime‐restricted anorectic action of muscle‐derived GDF15 that potentially drives a systemic metabolic response during mitochondrial dysfunction (Fig 6H).
Figure 6. Diurnal variation of muscle‐derived GDF15 during mitochondrial dysfunction.

-
ARelative quadriceps (Quad) mRNA expression of the ISR components Atf4, Atf5, Atf6, and Chop (WT day n = 9, WT night n = 5, TG day n = 20, TG night n = 12).
-
B, CRepresentative immunoblots of ISR component eIF2α (B) and quantification of phospho‐eIF2α (p‐eIF2aSer51) relative protein expression (C) in skeletal muscle (Gastroc, WT day n = 4, WT night n = 5, TG day n = 9, TG night n = 9).
-
D, ERelative mRNA expression of Rev‐erba (D) and Gdf15 (E) in quadriceps, liver, and eWAT (WT day n = 9, WT night n = 5, TG day n = 20, TG night n = 12).
-
FSkeletal muscle (Quad) GDF15 protein content normalized to total protein content (WT day n = 4, WT night n = 5, TG day n = 14, TG night n = 12)
-
GCirculating GDF15 plasma levels (WT day n = 9, WT night n = 5, TG day n = 18, TG night n = 12).
-
HGraphical summary showing muscle mitochondrial stress induced secretion and diurnal variation of GDF15 to drive a daytime‐restricted anorexia, affecting in turn metabolic flexibility, adiposity, WAT browning, and systemic insulin sensitivity. Parts of this cartoon were created using Servier Medical Art (http://smart.servier.com).
Discussion
Within the last decade, we and others have proposed a profound importance for inter‐tissue communication during mitochondrial stress to control systemic energy homeostasis and metabolic response 23, 24, 25, 40, 42, 43, 45, 48, 49, 50. However, key metabolic mediators and their pathophysiological role in response to mitochondrial dysfunction remained poorly understood. Here, using a transgenic mouse model of mitochondrial stress with compromised muscle‐specific OXPHOS capacity via respiratory uncoupling, we (i) demonstrate the induction and diurnal variation of GDF15 as a myokine, (ii) show that genetic ablation of GDF15 during mitochondrial stress prevents a systemic metabolic response, and (iii) provide mechanistic in vivo evidence for a GDF15‐dependent daytime‐restricted anorexia and metabolic flexibility. Hence, we uncovered a novel diurnal action for GDF15 as a myokine in a cell‐non‐autonomous fashion, whereas this is negligible for mitochondrial stress‐driven skeletal muscle atrophy.
A role of endogenous GDF15 as regulator of appetite was originally shown in cancer‐related anorexia 26. Notably, transgenic mice overexpressing GDF15 in the liver have a persistent lean phenotype due to decreased energy intake 38. Exogenously administrated GDF15 induces an acute anorectic response in mammals including monkeys. This is considered to be centrally mediated by its recently described receptor GFRAL which is exclusively expressed in the hindbrain 27, 28, 29, 30. The anorectic action of GDF15 was proposed to be triggered by neurons within the AP/NTS 51, and ablation of GFRAL completely prevents it. GDF15 and GFRAL are currently discussed as possible targets for the treatment of anorexia/cachexia syndromes 52. GFRAL knockdown in AP and NTS increased adiposity of mice on a high‐fat diet, which shows that the central GDF15‐GFRAL axis plays an important role in energy homeostasis 53. Future investigations may address whether a diurnal anorectic response during muscle mitochondrial dysfunction is based on a muscle–brain axis and requires endogenous GDF15 action in the hindbrain.
In our studies, we demonstrated that the genetic ablation of GDF15 drives adiposity and abolishes sWAT browning and systemic insulin sensitivity as a metabolic response to muscle mitochondrial dysfunction. As pointed out by Breit et al 52 there is the possibility that GDF15 effects on other cells or tissues could be mediated by a soluble form of GFRAL resulting from an alternative transcript which lacks transmembrane and cytoplasmatic domains. In contrast, it has been demonstrated previously in several studies that GFRAL is not expressed in WAT depots 27, 28, 29, 30, 54, 55. However, we cannot rule out a possible direct GDF15‐dependent muscle–adipose tissue crosstalk, independent of a GFRAL receptor signaling. Notably, genetic ablation of GDF15 in a mouse model of skeletal muscle‐specific deficiency of Crif1, an integral protein of the large mitoribosomal subunit, prevented a mitochondrial stress‐driven improved insulin sensitivity and resistance to diet‐induced obesity 23. Based on in vitro experiments, this was attributed to potential elevated oxidative metabolism and lipid mobilization in the liver, muscle, and WAT depots. However, the direct impact of GDF15 on energy balance, sWAT browning, and systemic insulin sensitivity of muscle‐specific Crif1‐knockout mice under non‐dietary challenged conditions was not investigated 23. We have previously described the myokine FGF21 as an essential regulator of sWAT browning in response to muscle mitochondrial stress 56. Remarkably, the increase in circulating FGF21 was not affected by loss of GDF15 in TGxKO mice but sWAT browning was still suppressed, which was accompanied by a progressive adiposity. It has been described before that increased adiposity leads to a suppression of sWAT browning 57, as well as a coordinated restructuring of metabolism that could contribute to the whitening of adipose tissue in mice 58. Thus, we hypothesize that the effects on sWAT browning of high circulating FGF21 are affected by the lack of GDF15, possibly due to an indirect effect via fat mass expansion. Notably, in line with previous studies in obese mice and humans who display a leptin resistance 57, 59, 60, adiposity in TGxKO mice also promoted an increase in circulating leptin levels suggesting no particular disturbance of the leptin axis in the TG mouse model.
Interestingly, our here uncovered GDF15‐dependent diurnal anorexia resembles an endogenous mimic of time‐restricted feeding response. In mice and humans, time‐restricted feeding without reducing caloric intake improves systemic glucose tolerance, insulin sensitivity, and metabolic flexibility 61, 62, 63. Metabolic flexibility describes efficient switches in metabolism depending on organismal energy demand 64, 65, which was previously reported in response to chronic mitochondrial stress in mice 66, 67. Here, we demonstrate that the genetic ablation of GDF15 in TG mice fully abolishes the metabolic flexibility as well as systemic insulin sensitivity. Thus, our findings suggest a crucial function of endogenous GDF15 as an endocrine acting regulator of systemic metabolic homeostasis and fat mass balance during mitochondrial dysfunction.
In Drosophila, a myokine‐mediated diurnal inter‐tissue communication between muscle and adipose tissue was recently described, affecting systemic energy homeostasis 68. In healthy humans, it was shown that circulating GDF15 levels vary in a diurnal pattern 69. Here, we found that despite a preserved skeletal muscle ISR induction, GDF15 expression and circulating plasma concentrations at night were significantly lower than daytime levels. The reasons for this are unclear, but may reflect variations of intracellular processing of GDF15 70 in a circadian manner. Paradoxically, induction of GDF15 as a myokine was unable to suppress food intake at night, which was rather increased compared to WT control. Whether the anorectic action requires a certain threshold of circulating GDF15 (≥ 400 pg/ml) or an additional appetite‐stimulating signal during muscle mitochondrial dysfunction limits GDF15 action at night remains to be elucidated.
Based on our results, we suggest that the GDF15‐dependent diurnal anorexia represents the so far missing link between muscle mitochondrial dysfunction and remodeling of systemic energy homeostasis. Circulating GDF15 levels are highly elevated in cancer patients with severe anorexia 26, 71, 72 and in patients with mitochondrial diseases 19, 20, 21, 22. Noteworthy, poor feeding in infants and multiple episodes of nausea as well as vomiting are common phenotypes in human mitochondrial disorders 73, 74. Interestingly, GDF15 was recently associated with severe nausea, vomiting, weight loss, and anorexia symptoms during pregnancy, known as hyperemesis gravidarum 75. This raises the intriguing question whether endogenous GDF15 mediates an anorectic response in patients with mitochondrial dysfunction.
In conclusion, our novel findings align with the notion that mitochondrial stress drives an endocrine crosstalk, although further studies are necessary to better understand the central actions of muscle‐derived GDF15 during mitochondrial dysfunction. Our evidence contributes to a better understanding of the mechanisms that promote the pathophysiological consequences of mitochondrial dysfunction. Consequently, this should stimulate translational research on GDF15 as a therapeutic target for the treatment of anorexia and hypermetabolism during mitochondrial disorders.
Materials and Methods
Animals
Animal experiments were approved by the ethics committee of the Ministry of Agriculture and Environment (State Brandenburg, Germany, permission number GZ 2347‐9‐2016). HSA‐Ucp1‐transgenic mice (TG) 32 were crossed with whole‐body Gdf15‐knockout (KO) mice 34 kindly provided by Dr. Se‐Jin Lee (University of Connecticut School of Medicine, Department of Genetics and Genome Sciences) to generate the four experimental genotypes: wild‐type (WT), Gdf15‐KO (KO), TG, and TGxGdf15‐KO (TGxKO) mice. Notably, the human skeletal actin (HSA) promoter of TG mice is well described to drive a skeletal muscle‐specific expression 76, in all muscle fiber types but preferentially in fast‐glycolytic type muscle fibers 77. All animals were group‐housed and random‐caged with ad libitum access to a standard chow diet (Sniff, Soest, Germany) and water at 23°C and a 12:12‐h dark‐light cycle and kept to different ages. For the experiments, female and male animals were used and sacrificed in the end of the experiment after 3‐h food withdrawal to collect plasma and tissue samples.
In vivo phenotyping
For body composition measurement, quantitative magnetic resonance (QMR, EchoMRI 2012 Body Composition Analyzer, Houston, USA) was used. Voluntary running wheel activity was determined by IR motion detectors (TSE Systems GmbH, Homburg, Germany). Grip strength was measured using a Grip Strength Meter (BIOSEB). Energy expenditure, food intake, physical activity, and respiratory quotient (RQ = CO2 produced/O2 consumed) were assessed by indirect calorimetry using an open respiratory system with the simultaneous measurement of cage activity, food, and water intake (TSE PhenoMaster, TSE Systems, Germany). Measurements were performed in male mice at 17 weeks of age in 10 min intervals over a period of 72 h. The last 24 h were analyzed to assess genotypic differences of energy metabolism. For the oral glucose tolerance test, 2 mg glucose per gram body weight was applied 2 h after food withdrawal. Blood glucose levels were measured before and 15, 30, 60, and 120 min after glucose application using a glucose sensor (Bayer, Germany). Insulin levels were measured before and 15, 30, and 60 min after application by an ultra‐sensitive ELISA assay (DRG Instruments GmbH, Germany).
Ex vivo skeletal muscle culture and cell culture
Skeletal muscle ex vivo culture was adapted to a protocol described previously 78. Briefly, mice were fasted for 4 h prior the dissection of muscles. Mice were sacrificed under isoflurane anesthesia. Extensor digitorum longus (EDL) and soleus muscles were rapidly removed, washed, and incubated in pre‐oxygenated (95% O2/5% CO2) Krebs–Henseleit buffer (KHB) supplemented with 15 mM mannitol and 5 mM glucose for 2 h at 30°C in a humidified incubator containing 5% CO2. Conditioned medium was centrifuged, and supernatant was stored at −20°C until analysis. C2C12 cells were cultured in DMEM medium supplemented with 10% FBS and 1% penicillin‐streptomycin at 37°C in a 5% CO2 atmosphere. When C2C12 cells reached to 90% confluence, differentiation was induced by incubation for 6 days with DMEM medium containing 2% horse serum and 1% penicillin‐streptomycin. For RNA isolation, the differentiated C2C12 muscle cells were treated with vehicle control (Ctrl) or mitochondrial uncoupler (FCCP, 5 μM), for 5 h (n = 3 biological replicates).
Gene expression analysis
RNA isolation and quantitative real‐time PCR from cells and tissues were performed as described previously 79. Briefly, total RNA was isolated using peqGOLD TriFast (#732‐3314) from VWR, followed by a DNase digest treatment (#EN0521, Fischer Scientific). cDNA synthesis was performed using the RevertAid First Strand cDNA Synthesis Kit (#K1622) from Thermo Fischer Scientific from 1 μg of RNA. Quantitative real‐time PCR analyses were performed on a ViiA™ 7 Real‐Time PCR System from Applied Biosystems using 384‐well plates (#72.1984.202, Sarstedt). The qPCR mix contained 5 ng of cDNA, Power SYBR Green Master Mix (#4367660, Thermo Fischer Scientific), and 1.5 μM of each corresponding primer pair in a total volume of 5 μl per well. The following primers were used: Actb: 5′ GCCAACCGTGAAAAGAGAC 3′ (F), 5′ TACGACCAGAGGCATACAG 3′ (R); Atf4: 5′ GGAATGGCCGGCTATGG 3′ (F), 5′ TCCCGGAAAAGGCATCCT 3′ (R); Atf5: 5′CTACCCCTCCATTCCACTTTCC 3′ (F), 5′TTCTTGACTGGCTTCTCACTTGTG 3′ (R); Atf6: 5′ CTTCCTCCAGTTGCTCCATC 3′ (F), 5′ CAACTCCTCAGGAACGTGCT 3′ (R); B2 m: 5′ CCCCACTGAGACTGATACATACGC 3′ (F), 5′ AGAAACTGGATTTGTAATTAAGCAGGTTC3′ (R); Chop: 5′ AGAGTGGTCAGTGCGCAGC 3′ (F), 5′ CTCATTCTCCTGCTCCTTCTCC 3′ (R); Gdf15: 5′ GAGCTACGGGGTCGCTTC 3′ (F), 5′ GGGACCCCAATCTCACCT 3′ (R); Psat1: 5′ AGTGGAGCGCCAGAATAGAA 3′ (F), 5′ CTTCGGTTGTGACAGCGTTA 3′ (R); Mthfd2: 5′ CATGGGGCGTGTGGGAGATAAT 3′ (F), 5′ CCGGGCCGTTCGTGAGC 3′ (R); Ucp1: 5′ TGGAGGTGTGGCAGTATTC 3′ (F), 5′ AGCTCTGTACAGTTGATGATGAC 3′ (R); Cpt1b: 5′ GAAGAGATCAAGCCGGTCAT 3′ (F), 5′ CTCCATCTGGTAGGAGCACA 3′ (R), 6‐FAM‐TGGGCACCATACCCAGTGCC‐TAMRA (P), for which TaqMan™ Gene Expression Master Mix (#10015414, Fischer Scientific) was used; Cidea: 5′ TGCTCTTCTGTATCGCCCAGT 3′ (F), 5′ GCCGTGTTAAGGAATCTGCTG 3′ (R); Dio2: 5′ TGCCACCTTCTTGACTTTGC 3′ (F), 5′ GGTTCCGGTGCTTCTTAACC 3′ (R); Elovl3: 5′ TCCGCGTTCTCATGTAGGTCT 3′ (F), 5′ GGACCTGATGCAACCCTATGA 3′ (R); Fgf21: 5′ GCTGCTGGAGGACGGTTACA 3′ (F), 5′ CACAGGTCCCCAGGATGTTG 3′ (R); Aspg: 5′ AGGCATCAGAGTGTCATT 3′ (F), 5′ GGCACAGTGTCCATCATA 3′ (R); Pgc1a: 5′ AGCCGTGACCACTGACAACGAG 3′ (F), 5′ GCTGCATGGTTCTGAGTGCTAAG 3′ (R); Prdm16: 5′ CAGCACGGTGAAGCCATTC 3′ (F), 5′ GCGTGCATCCGCTTGTG 3′ (R). Rev‐erba: 5′ CGTTCGCATCAATCGCAACC 3′ (F), 5′ GATGTGGAGTAGGTGAGGT 3′ (R). Relative gene expression to WT controls was calculated as ∆CT using B2 m or Actb for normalization.
Plasma and cytokine analysis
Blood glucose concentrations were determined in samples from lateral tail vein using a glucose sensor (Bayer, Germany). Post‐absorptive plasma insulin levels were measured by an ultra‐sensitive ELISA assay (DRG Instruments GmbH, Germany). The plasma concentrations of cytokines (Mouse/Rat GDF15, FGF21, and Leptin Quantikine ELISA Kit, R&D Systems, USA) were determined by enzyme‐linked immunosorbent assays (ELISA) following manufacturer instructions. Mouse GDF15 (mGDF15) protein levels were analyzed in skeletal muscle lysates of quadriceps from 20‐week‐old male WT and Ucp1‐TG animals. Muscle tissue was homogenized in hypotonic buffer (10 mM Tris pH 7.4, 0.02% Triton X‐100, 1× COMPLETE EDTA‐free), GDF15 was measured using Mouse/Rat GDF15 ELISA Kit (R&D Systems), and values were normalized to total protein concentration (DC™ Protein Assay Reagent [#500‐0114, BioRad]).
Immunoblotting
For protein extraction, tissue was homogenized in RIPA buffer containing protease and phosphatase inhibitor cocktail (#A32959, Thermo Scientific) and protein concentration was measured using the DC™ Protein Assay Reagent (#500‐0114, BioRad). The following primary antibodies were used: phospho‐AMPK (Thr172) (#2531, Cell Signaling Technology), total AMPK (#2603, Cell Signaling Technology), phospho‐eIF2α (Ser51) (#3597, Cell Signaling Technology), eIF2α antibodies (#3524, Cell Signaling Technology), OXPHOS antibody (#ab110413, Abcam), slow myosin (#ab11083, Abcam), and UCP1 antibodies (#ab23841, Abcam). Protein expression was normalized to α‐Tubulin (ATUB) (#T6074, SIGMA). Horseradish peroxidase‐conjugated secondary antibodies were used: anti‐rabbit IgG (#7074, Cell Signaling Technology) or anti‐mouse IgG (#7076, Cell Signaling Technology).
Histology
Muscle (tibialis anterior [TA]), and subcutaneous white adipose tissue (sWAT) pieces were fixed in 4% formaldehyde for 24 h and embedded in paraffin. Tissue slices were cut (2–4 μM, Microm HM 355 S Rotatory Microtome), mounted, and dehydrated in increasing ethanol series for hematoxylin and eosin (H&E) (Roth, Fluka) staining. Bright field images were taken with an Axioplan 2 (Zeiss) using an AxioCam MRm camera. Quantification of cross‐sectional area was performed using ImageJ (version 1.52k).
OROBOROS high‐resolution respirometry
Mitochondrial respiration ex vivo analysis was performed in soleus and extensor digitorum longus (EDL) muscle as previously described using the high‐resolution Oxygraph‐2k (OROBOROS Instruments, Innsbruck, Austria) 37. Briefly, muscle samples were gently dissected, immediately placed in ice‐cold biopsy preservation medium (BIOPS: 2.77 mM CaK2EGTA, 7.23 mM K2EGTA, 5.77 mM Na2ATP, 6.56 mM MgCl2•6 H2O, 20 mM taurine, 15 mM Na2phosphocreatine, 20 mM imidazole, 0.5 mM dithiothreitol, 50 mM MES hydrate, pH 7.1) 80, separated with a pair of fine‐tipped forceps, and finally permeabilized with saponin (50 μg/ml) for 30 min at 4°C. After permeabilization, muscle fibers were washed in mitochondrial respiration medium (Mir05: 0,5 mM EGTA, 3 mM MgCl2•6H2O, 60 mM K‐lactobionate, 20 mM taurine, 10 mM KH2PO4, 20 mM HEPES, 110 mM sucrose, 1 g/l fatty acid‐free BSA) for 10 min at 4°C and kept on ice until analysis. Respiratory capacity was analyzed performing a multiple substrate–uncoupler–inhibitor titration (SUIT) protocol 81, 82 at 37°C in a hyper‐oxygenated environment using following substrate concentrations: 0.5 mM malate + 5 mM pyruvate (LEAK respiration [L]), 5 mM ADP, 10 μM cytochrome c (integrity of outer mt‐membrane, data not shown), 10 mM glutamate + 10 mM succinate (OXPHOS [P]), 0.5 μM FCCP (ETSCI&CII, electron transfer system, [E]), and 0.5 μM rotenone + 2.5 μM antimycin A (residual oxygen consumption, ROX, data not shown). Oxygen flux was quantified using DatLab software (version 6, OROBOROS Instruments, Innsbruck, Austria). Oxygen consumption rate (OCR) was normalized to muscle wet weight of dry blotted fiber bundles. The netOXPHOS control ratio ([P‐L]/E) was calculated to express the OXPHOS capacity (corrected for LEAK respiration) as a fraction of ETS capacity.
Statistical analysis
Statistical analyses were performed using Stat GraphPad Prism 7 (GraphPad Software, San Diego, CA, USA). All plasma components are expressed as interleaved box and whiskers (min to max) plots, and all other data are expressed as means with SEM. After testing for equal distribution of the data and equal variances with the datasets using D'Agostino & Pearson normality test and Student's t‐test (unpaired, 2‐tailed), one‐way ANOVA followed by the Tukey's multiple comparison test was used to determine differences between genotypes, treatments, or time points. Statistical significance was assumed at P < 0.05 and denoted by *P < 0.05, **P < 0.01, ***P < 0.001. Means with asterisk are significantly different to WT or indicated group.
Author contributions
MO and SKl designed the study. MO and CIG conceived experiments and analyzed the majority of the data. MO, CIG and VC performed the majority of experiments. VV, SE and MW performed transcriptomic and proteomic analyses and analyzed data. SKe performed ex vivo muscle secretion assay and helped analyze data. MO and CIG prepared the figures, drafted, and wrote the manuscript, which was substantially proof‐read, commented, and edited by all authors.
Conflict of interest
The authors declare that they have no conflict of interest.
Supporting information
Expanded View Figures PDF
Review Process File
Acknowledgements
This work was supported by the German Research Foundation (DFG, grant KL613/23–1 to SKl) and by COST Action CA15203 MitoEAGLE, supported by COST (European Cooperation in Science and Technology). The authors would like to thank Antje Sylvester, Petra Albrecht, Sandra Rumberger, Carola Gehrmann, Elisabeth Meyer, Dr. Wenke Jonas, and Andrea Teichmann for excellent technical assistance. Parts of graphical abstract as well as Figs 1A and M, and 6H were created using Sevier Medical Art (https://smart.servier.com).
EMBO Reports (2020) 21: e48804
Contributor Information
Mario Ost, Email: mario.ost@dife.de.
Susanne Klaus, Email: klaus@dife.de.
References
- 1. Nunnari J, Suomalainen A (2012) Mitochondria: in sickness and in health. Cell 148: 1145–1159 [DOI] [PMC free article] [PubMed] [Google Scholar]
- 2. Gordaliza‐Alaguero I, Canto C, Zorzano A (2019) Metabolic implications of organelle‐mitochondria communication. EMBO Rep 20: e47928 [DOI] [PMC free article] [PubMed] [Google Scholar]
- 3. Suomalainen A, Battersby BJ (2018) Mitochondrial diseases: the contribution of organelle stress responses to pathology. Nat Rev Mol Cell Biol 19: 77–92 [DOI] [PubMed] [Google Scholar]
- 4. Ernster L, Ikkos D, Luft R (1959) Enzymic activities of human skeletal muscle mitochondria: a tool in clinical metabolic research. Nature 184: 1851–1854 [DOI] [PubMed] [Google Scholar]
- 5. Luft R, Ikkos D, Palmieri G, Ernster L, Afzelius B (1962) A case of severe hypermetabolism of nonthyroid origin with a defect in the maintenance of mitochondrial respiratory control: a correlated clinical, biochemical, and morphological study. J Clin Invest 41: 1776–1804 [DOI] [PMC free article] [PubMed] [Google Scholar]
- 6. Quiros PM, Prado MA, Zamboni N, D'Amico D, Williams RW, Finley D, Gygi SP, Auwerx J (2017) Multi‐omics analysis identifies ATF4 as a key regulator of the mitochondrial stress response in mammals. J Cell Biol 216: 2027–2045 [DOI] [PMC free article] [PubMed] [Google Scholar]
- 7. Ost M, Keipert S, van Schothorst EM, Donner V, van der Stelt I, Kipp AP, Petzke KJ, Jove M, Pamplona R, Portero‐Otin M et al (2015) Muscle mitohormesis promotes cellular survival via serine/glycine pathway flux. FASEB J 29: 1314–1328 [DOI] [PubMed] [Google Scholar]
- 8. Nikkanen J, Forsstrom S, Euro L, Paetau I, Kohnz RA, Wang L, Chilov D, Viinamaki J, Roivainen A, Marjamaki P et al (2016) Mitochondrial DNA replication defects disturb cellular dNTP pools and remodel one‐carbon metabolism. Cell Metab 23: 635–648 [DOI] [PubMed] [Google Scholar]
- 9. Quiros PM, Mottis A, Auwerx J (2016) Mitonuclear communication in homeostasis and stress. Nat Rev Mol Cell Biol 17: 213–226 [DOI] [PubMed] [Google Scholar]
- 10. Durieux J, Wolff S, Dillin A (2011) The cell‐non‐autonomous nature of electron transport chain‐mediated longevity. Cell 144: 79–91 [DOI] [PMC free article] [PubMed] [Google Scholar]
- 11. Davis RL, Liang C, Sue CM (2016) A comparison of current serum biomarkers as diagnostic indicators of mitochondrial diseases. Neurology 86: 2010–2015 [DOI] [PMC free article] [PubMed] [Google Scholar]
- 12. Corre J, Hebraud B, Bourin P (2013) Concise review: growth differentiation factor 15 in pathology: a clinical role? Stem Cells Transl Med 2: 946–952 [DOI] [PMC free article] [PubMed] [Google Scholar]
- 13. Conte M, Ostan R, Fabbri C, Santoro A, Guidarelli G, Vitale G, Mari D, Sevini F, Capri M, Sandri M et al (2018) Human aging and longevity are characterized by high levels of mitokines. J Gerontol A Biol Sci Med Sci 74: 600–607 [DOI] [PubMed] [Google Scholar]
- 14. Bootcov MR, Bauskin AR, Valenzuela SM, Moore AG, Bansal M, He XY, Zhang HP, Donnellan M, Mahler S, Pryor K et al (1997) MIC‐1, a novel macrophage inhibitory cytokine, is a divergent member of the TGF‐beta superfamily. Proc Natl Acad Sci USA 94: 11514–11519 [DOI] [PMC free article] [PubMed] [Google Scholar]
- 15. Yokoyama‐Kobayashi M, Saeki M, Sekine S, Kato S (1997) Human cDNA encoding a novel TGF‐beta superfamily protein highly expressed in placenta. J Biochem 122: 622–626 [DOI] [PubMed] [Google Scholar]
- 16. Tsai VW, Husaini Y, Manandhar R, Lee‐Ng KK, Zhang HP, Harriott K, Jiang L, Lin S, Sainsbury A, Brown DA et al (2012) Anorexia/cachexia of chronic diseases: a role for the TGF‐beta family cytokine MIC‐1/GDF15. J Cachexia Sarcopenia Muscle 3: 239–243 [DOI] [PMC free article] [PubMed] [Google Scholar]
- 17. Breit SN, Johnen H, Cook AD, Tsai VW, Mohammad MG, Kuffner T, Zhang HP, Marquis CP, Jiang L, Lockwood G et al (2011) The TGF‐beta superfamily cytokine, MIC‐1/GDF15: a pleotrophic cytokine with roles in inflammation, cancer and metabolism. Growth Factors 29: 187–195 [DOI] [PubMed] [Google Scholar]
- 18. Wang T, Liu J, McDonald C, Lupino K, Zhai X, Wilkins BJ, Hakonarson H, Pei L (2017) GDF15 is a heart‐derived hormone that regulates body growth. EMBO Mol Med 9: 1150–1164 [DOI] [PMC free article] [PubMed] [Google Scholar]
- 19. Lehtonen JM, Forsstrom S, Bottani E, Viscomi C, Baris OR, Isoniemi H, Hockerstedt K, Osterlund P, Hurme M, Jylhava J et al (2016) FGF21 is a biomarker for mitochondrial translation and mtDNA maintenance disorders. Neurology 87: 2290–2299 [DOI] [PMC free article] [PubMed] [Google Scholar]
- 20. Kalko SG, Paco S, Jou C, Rodriguez MA, Meznaric M, Rogac M, Jekovec‐Vrhovsek M, Sciacco M, Moggio M, Fagiolari G et al (2014) Transcriptomic profiling of TK2 deficient human skeletal muscle suggests a role for the p53 signalling pathway and identifies growth and differentiation factor‐15 as a potential novel biomarker for mitochondrial myopathies. BMC Genom 15: 91 [DOI] [PMC free article] [PubMed] [Google Scholar]
- 21. Montero R, Yubero D, Villarroya J, Henares D, Jou C, Rodriguez MA, Ramos F, Nascimento A, Ortez CI, Campistol J et al (2016) GDF‐15 is elevated in children with mitochondrial diseases and is induced by mitochondrial dysfunction. PLoS ONE 11: e0148709 [DOI] [PMC free article] [PubMed] [Google Scholar]
- 22. Koene S, de Laat P, van Tienoven DH, Weijers G, Vriens D, Sweep FC, Timmermans J, Kapusta L, Janssen MC, Smeitink JA (2015) Serum GDF15 levels correlate to mitochondrial disease severity and myocardial strain, but not to disease progression in adult m.3243A>G carriers. JIMD Rep 24: 69–81 [DOI] [PMC free article] [PubMed] [Google Scholar]
- 23. Chung HK, Ryu D, Kim KS, Chang JY, Kim YK, Yi HS, Kang SG, Choi MJ, Lee SE, Jung SB et al (2017) Growth differentiation factor 15 is a myomitokine governing systemic energy homeostasis. J Cell Biol 216: 149–165 [DOI] [PMC free article] [PubMed] [Google Scholar]
- 24. Morrow RM, Picard M, Derbeneva O, Leipzig J, McManus MJ, Gouspillou G, Barbat‐Artigas S, Dos Santos C, Hepple RT, Murdock DG et al (2017) Mitochondrial energy deficiency leads to hyperproliferation of skeletal muscle mitochondria and enhanced insulin sensitivity. Proc Natl Acad Sci USA 114: 2705–2710 [DOI] [PMC free article] [PubMed] [Google Scholar]
- 25. Forsstrom S, Jackson CB, Carroll CJ, Kuronen M, Pirinen E, Pradhan S, Marmyleva A, Auranen M, Kleine IM, Khan NA et al (2019) Fibroblast growth factor 21 drives dynamics of local and systemic stress responses in mitochondrial myopathy with mtDNA deletions. Cell Metab 30: 1040–1054.e7 [DOI] [PubMed] [Google Scholar]
- 26. Johnen H, Lin S, Kuffner T, Brown DA, Tsai VW, Bauskin AR, Wu L, Pankhurst G, Jiang L, Junankar S et al (2007) Tumor‐induced anorexia and weight loss are mediated by the TGF‐beta superfamily cytokine MIC‐1. Nat Med 13: 1333–1340 [DOI] [PubMed] [Google Scholar]
- 27. Hsu JY, Crawley S, Chen M, Ayupova DA, Lindhout DA, Higbee J, Kutach A, Joo W, Gao Z, Fu D et al (2017) Non‐homeostatic body weight regulation through a brainstem‐restricted receptor for GDF15. Nature 550: 255–259 [DOI] [PubMed] [Google Scholar]
- 28. Yang L, Chang C‐C, Sun Z, Madsen D, Zhu H, Padkjær SB, Wu X, Huang T, Hultman K, Paulsen SJ (2017) GFRAL is the receptor for GDF15 and is required for the anti‐obesity effects of the ligand. Nat Med 23: 1158–1166 [DOI] [PubMed] [Google Scholar]
- 29. Mullican SE, Lin‐Schmidt X, Chin C‐N, Chavez JA, Furman JL, Armstrong AA, Beck SC, South VJ, Dinh TQ, Cash‐Mason TD (2017) GFRAL is the receptor for GDF15 and the ligand promotes weight loss in mice and nonhuman primates. Nat Med 23: 1150–1157 [DOI] [PubMed] [Google Scholar]
- 30. Emmerson PJ, Wang F, Du Y, Liu Q, Pickard RT, Gonciarz MD, Coskun T, Hamang MJ, Sindelar DK, Ballman KK (2017) The metabolic effects of GDF15 are mediated by the orphan receptor GFRAL. Nat Med 23: 1215 [DOI] [PubMed] [Google Scholar]
- 31. Patel S, Alvarez‐Guaita A, Melvin A, Rimmington D, Dattilo A, Miedzybrodzka EL, Cimino I, Maurin AC, Roberts GP, Meek CL et al (2019) GDF15 provides an endocrine signal of nutritional stress in mice and humans. Cell Metab 29: 707–718 e8 [DOI] [PMC free article] [PubMed] [Google Scholar]
- 32. Klaus S, Rudolph B, Dohrmann C, Wehr R (2005) Expression of uncoupling protein 1 in skeletal muscle decreases muscle energy efficiency and affects thermoregulation and substrate oxidation. Physiol Genomics 21: 193–200 [DOI] [PubMed] [Google Scholar]
- 33. Keipert S, Klaus S, Heldmaier G, Jastroch M (2010) UCP1 ectopically expressed in murine muscle displays native function and mitigates mitochondrial superoxide production. Biochim Biophys Acta 1797: 324–330 [DOI] [PubMed] [Google Scholar]
- 34. Hsiao EC, Koniaris LG, Zimmers‐Koniaris T, Sebald SM, Huynh TV, Lee SJ (2000) Characterization of growth‐differentiation factor 15, a transforming growth factor beta superfamily member induced following liver injury. Mol Cell Biol 20: 3742–3751 [DOI] [PMC free article] [PubMed] [Google Scholar]
- 35. Tsai VW, Macia L, Johnen H, Kuffner T, Manadhar R, Jorgensen SB, Lee‐Ng KK, Zhang HP, Wu L, Marquis CP et al (2013) TGF‐b superfamily cytokine MIC‐1/GDF15 is a physiological appetite and body weight regulator. PLoS ONE 8: e55174 [DOI] [PMC free article] [PubMed] [Google Scholar]
- 36. Ost M, Werner F, Dokas J, Klaus S, Voigt A (2014) Activation of AMPKalpha2 is not crucial for mitochondrial uncoupling‐induced metabolic effects but required to maintain skeletal muscle integrity. PLoS ONE 9: e94689 [DOI] [PMC free article] [PubMed] [Google Scholar]
- 37. Coleman V, Sa‐Nguanmoo P, Koenig J, Schulz TJ, Grune T, Klaus S, Kipp AP, Ost M (2018) Partial involvement of Nrf2 in skeletal muscle mitohormesis as an adaptive response to mitochondrial uncoupling. Sci Rep 8: 2446 [DOI] [PMC free article] [PubMed] [Google Scholar]
- 38. Macia L, Tsai VW, Nguyen AD, Johnen H, Kuffner T, Shi YC, Lin S, Herzog H, Brown DA, Breit SN et al (2012) Macrophage inhibitory cytokine 1 (MIC‐1/GDF15) decreases food intake, body weight and improves glucose tolerance in mice on normal & obesogenic diets. PLoS ONE 7: e34868 [DOI] [PMC free article] [PubMed] [Google Scholar]
- 39. Chrysovergis K, Wang X, Kosak J, Lee SH, Kim JS, Foley JF, Travlos G, Singh S, Baek SJ, Eling TE (2014) NAG‐1/GDF‐15 prevents obesity by increasing thermogenesis, lipolysis and oxidative metabolism. Int J Obes 38: 1555–1564 [DOI] [PMC free article] [PubMed] [Google Scholar]
- 40. Keipert S, Ost M, Johann K, Imber F, Jastroch M, van Schothorst EM, Keijer J, Klaus S (2014) Skeletal muscle mitochondrial uncoupling drives endocrine cross‐talk through the induction of FGF21 as a myokine. Am J Physiol Endocrinol Metab 306: E469–E482 [DOI] [PubMed] [Google Scholar]
- 41. Becker C, Kukat A, Szczepanowska K, Hermans S, Senft K, Brandscheid CP, Maiti P, Trifunovic A (2018) CLPP deficiency protects against metabolic syndrome but hinders adaptive thermogenesis. EMBO Rep 19: e45126 [DOI] [PMC free article] [PubMed] [Google Scholar]
- 42. Kim KH, Jeong YT, Oh H, Kim SH, Cho JM, Kim YN, Kim SS, Kim DH, Hur KY, Kim HK et al (2013) Autophagy deficiency leads to protection from obesity and insulin resistance by inducing Fgf21 as a mitokine. Nat Med 19: 83–92 [DOI] [PubMed] [Google Scholar]
- 43. Tyynismaa H, Carroll CJ, Raimundo N, Ahola‐Erkkila S, Wenz T, Ruhanen H, Guse K, Hemminki A, Peltola‐Mjosund KE, Tulkki V et al (2010) Mitochondrial myopathy induces a starvation‐like response. Hum Mol Genet 19: 3948–3958 [DOI] [PubMed] [Google Scholar]
- 44. de Jong JM, Larsson O, Cannon B, Nedergaard J (2015) A stringent validation of mouse adipose tissue identity markers. Am J Physiol Endocrinol Metab 308: E1085–E1105 [DOI] [PubMed] [Google Scholar]
- 45. Wall CE, Whyte J, Suh JM, Fan W, Collins B, Liddle C, Yu RT, Atkins AR, Naviaux JC, Li K et al (2015) High‐fat diet and FGF21 cooperatively promote aerobic thermogenesis in mtDNA mutator mice. Proc Natl Acad Sci USA 112: 8714–8719 [DOI] [PMC free article] [PubMed] [Google Scholar]
- 46. Riachi M, Himms‐Hagen J, Harper ME (2004) Percent relative cumulative frequency analysis in indirect calorimetry: application to studies of transgenic mice. Can J Physiol Pharmacol 82: 1075–1083 [DOI] [PubMed] [Google Scholar]
- 47. Cho H, Zhao X, Hatori M, Yu RT, Barish GD, Lam MT, Chong LW, DiTacchio L, Atkins AR, Glass CK et al (2012) Regulation of circadian behaviour and metabolism by REV‐ERB‐alpha and REV‐ERB‐beta. Nature 485: 123–127 [DOI] [PMC free article] [PubMed] [Google Scholar]
- 48. Vandanmagsar B, Warfel JD, Wicks SE, Ghosh S, Salbaum JM, Burk D, Dubuisson OS, Mendoza TM, Zhang J, Noland RC et al (2016) Impaired mitochondrial fat oxidation induces FGF21 in muscle. Cell Rep 15: 1686–1699 [DOI] [PMC free article] [PubMed] [Google Scholar]
- 49. Pereira RO, Tadinada SM, Zasadny FM, Oliveira KJ, Pires KMP, Olvera A, Jeffers J, Souvenir R, McGlauflin R, Seei A et al (2017) OPA1 deficiency promotes secretion of FGF21 from muscle that prevents obesity and insulin resistance. EMBO J 36: 2126–2145 [DOI] [PMC free article] [PubMed] [Google Scholar]
- 50. Pospisilik JA, Knauf C, Joza N, Benit P, Orthofer M, Cani PD, Ebersberger I, Nakashima T, Sarao R, Neely G et al (2007) Targeted deletion of AIF decreases mitochondrial oxidative phosphorylation and protects from obesity and diabetes. Cell 131: 476–491 [DOI] [PubMed] [Google Scholar]
- 51. Tsai VW, Manandhar R, Jorgensen SB, Lee‐Ng KK, Zhang HP, Marquis CP, Jiang L, Husaini Y, Lin S, Sainsbury A et al (2014) The anorectic actions of the TGFbeta cytokine MIC‐1/GDF15 require an intact brainstem area postrema and nucleus of the solitary tract. PLoS ONE 9: e100370 [DOI] [PMC free article] [PubMed] [Google Scholar]
- 52. Breit SN, Tsai VW, Brown DA (2017) Targeting obesity and cachexia: identification of the GFRAL receptor‐MIC‐1/GDF15 pathway. Trends Mol Med 23: 1065–1067 [DOI] [PubMed] [Google Scholar]
- 53. Tsai VW, Zhang HP, Manandhar R, Schofield P, Christ D, Lee‐Ng KKM, Lebhar H, Marquis CP, Husaini Y, Brown DA et al (2019) GDF15 mediates adiposity resistance through actions on GFRAL neurons in the hindbrain AP/NTS. Int J Obes 43: 2370–2380 [DOI] [PubMed] [Google Scholar]
- 54. Li Z, Wang B, Wu X, Cheng SY, Paraoan L, Zhou J (2005) Identification, expression and functional characterization of the GRAL gene. J Neurochem 95: 361–376 [DOI] [PubMed] [Google Scholar]
- 55. Luan HH, Wang A, Hilliard BK, Carvalho F, Rosen CE, Ahasic AM, Herzog EL, Kang I, Pisani MA, Yu S et al (2019) GDF15 is an inflammation‐induced central mediator of tissue tolerance. Cell 178: 1231–1244 e11 [DOI] [PMC free article] [PubMed] [Google Scholar]
- 56. Ost M, Coleman V, Voigt A, van Schothorst EM, Keipert S, van der Stelt I, Ringel S, Graja A, Ambrosi T, Kipp AP et al (2016) Muscle mitochondrial stress adaptation operates independently of endogenous FGF21 action. Mol Metab 5: 79–90 [DOI] [PMC free article] [PubMed] [Google Scholar]
- 57. Geurts L, Everard A, Van Hul M, Essaghir A, Duparc T, Matamoros S, Plovier H, Castel J, Denis RG, Bergiers M et al (2015) Adipose tissue NAPE‐PLD controls fat mass development by altering the browning process and gut microbiota. Nat Commun 6: 6495 [DOI] [PMC free article] [PubMed] [Google Scholar]
- 58. Cummins TD, Holden CR, Sansbury BE, Gibb AA, Shah J, Zafar N, Tang Y, Hellmann J, Rai SN, Spite M et al (2014) Metabolic remodeling of white adipose tissue in obesity. Am J Physiol Endocrinol Metab 307: E262–E277 [DOI] [PMC free article] [PubMed] [Google Scholar]
- 59. Blum WF, Englaro P, Hanitsch S, Juul A, Hertel NT, Muller J, Skakkebaek NE, Heiman ML, Birkett M, Attanasio AM et al (1997) Plasma leptin levels in healthy children and adolescents: dependence on body mass index, body fat mass, gender, pubertal stage, and testosterone. J Clin Endocrinol Metab 82: 2904–2910 [DOI] [PubMed] [Google Scholar]
- 60. Ostlund RE Jr, Yang JW, Klein S, Gingerich R (1996) Relation between plasma leptin concentration and body fat, gender, diet, age, and metabolic covariates. J Clin Endocrinol Metab 81: 3909–3913 [DOI] [PubMed] [Google Scholar]
- 61. Hatori M, Vollmers C, Zarrinpar A, DiTacchio L, Bushong EA, Gill S, Leblanc M, Chaix A, Joens M, Fitzpatrick JA et al (2012) Time‐restricted feeding without reducing caloric intake prevents metabolic diseases in mice fed a high‐fat diet. Cell Metab 15: 848–860 [DOI] [PMC free article] [PubMed] [Google Scholar]
- 62. Sutton EF, Beyl R, Early KS, Cefalu WT, Ravussin E, Peterson CM (2018) Early time‐restricted feeding improves insulin sensitivity, blood pressure, and oxidative stress even without weight loss in men with prediabetes. Cell Metab 27: 1212–1221 e3 [DOI] [PMC free article] [PubMed] [Google Scholar]
- 63. Chaix A, Lin T, Le HD, Chang MW, Panda S (2019) Time‐restricted feeding prevents obesity and metabolic syndrome in mice lacking a circadian clock. Cell Metab 29: 303–319 e4 [DOI] [PMC free article] [PubMed] [Google Scholar]
- 64. Smith RL, Soeters MR, Wust RCI, Houtkooper RH (2018) Metabolic flexibility as an adaptation to energy resources and requirements in health and disease. Endocr Rev 39: 489–517 [DOI] [PMC free article] [PubMed] [Google Scholar]
- 65. Goodpaster BH, Sparks LM (2017) Metabolic flexibility in health and disease. Cell Metab 25: 1027–1036 [DOI] [PMC free article] [PubMed] [Google Scholar]
- 66. Bhaskaran S, Pharaoh G, Ranjit R, Murphy A, Matsuzaki S, Nair BC, Forbes B, Gispert S, Auburger G, Humphries KM et al (2018) Loss of mitochondrial protease ClpP protects mice from diet‐induced obesity and insulin resistance. EMBO Rep 19: e45009 [DOI] [PMC free article] [PubMed] [Google Scholar]
- 67. Katterle Y, Keipert S, Hof J, Klaus S (2008) Dissociation of obesity and insulin resistance in transgenic mice with skeletal muscle expression of uncoupling protein 1. Physiol Genomics 32: 352–359 [DOI] [PubMed] [Google Scholar]
- 68. Zhao X, Karpac J (2017) Muscle directs diurnal energy homeostasis through a myokine‐dependent hormone module in Drosophila . Curr Biol 27: 1941–1955 e6 [DOI] [PMC free article] [PubMed] [Google Scholar]
- 69. Tsai VW, Macia L, Feinle‐Bisset C, Manandhar R, Astrup A, Raben A, Lorenzen JK, Schmidt PT, Wiklund F, Pedersen NL et al (2015) Serum levels of human MIC‐1/GDF15 vary in a diurnal pattern, do not display a profile suggestive of a satiety factor and are related to BMI. PLoS ONE 10: e0133362 [DOI] [PMC free article] [PubMed] [Google Scholar]
- 70. Bauskin AR, Jiang L, Luo XW, Wu L, Brown DA, Breit SN (2010) The TGF‐beta superfamily cytokine MIC‐1/GDF15: secretory mechanisms facilitate creation of latent stromal stores. J Interferon Cytokine Res 30: 389–397 [DOI] [PubMed] [Google Scholar]
- 71. Lerner L, Tao J, Liu Q, Nicoletti R, Feng B, Krieger B, Mazsa E, Siddiquee Z, Wang R, Huang L et al (2016) MAP3K11/GDF15 axis is a critical driver of cancer cachexia. J Cachexia Sarcopenia Muscle 7: 467–482 [DOI] [PMC free article] [PubMed] [Google Scholar]
- 72. Lerner L, Hayes TG, Tao N, Krieger B, Feng B, Wu Z, Nicoletti R, Chiu MI, Gyuris J, Garcia JM (2015) Plasma growth differentiation factor 15 is associated with weight loss and mortality in cancer patients. J Cachexia Sarcopenia Muscle 6: 317–324 [DOI] [PMC free article] [PubMed] [Google Scholar]
- 73. Luft R, Landau BR (1995) Mitochondrial medicine. J Intern Med 238: 405–421 [DOI] [PubMed] [Google Scholar]
- 74. Boles RG, Chun N, Senadheera D, Wong LJ (1997) Cyclic vomiting syndrome and mitochondrial DNA mutations. Lancet 350: 1299–1300 [DOI] [PubMed] [Google Scholar]
- 75. Fejzo MS, Sazonova OV, Sathirapongsasuti JF, Hallgrimsdottir IB, Vacic V, MacGibbon KW, Schoenberg FP, Mancuso N, Slamon DJ, Mullin PM et al (2018) Placenta and appetite genes GDF15 and IGFBP7 are associated with hyperemesis gravidarum. Nat Commun 9: 1178 [DOI] [PMC free article] [PubMed] [Google Scholar]
- 76. McCarthy JJ, Srikuea R, Kirby TJ, Peterson CA, Esser KA (2012) Inducible Cre transgenic mouse strain for skeletal muscle‐specific gene targeting. Skelet Muscle 2: 8 [DOI] [PMC free article] [PubMed] [Google Scholar]
- 77. Corbett MA, Robinson CS, Dunglison GF, Yang N, Joya JE, Stewart AW, Schnell C, Gunning PW, North KN, Hardeman EC (2001) A mutation in alpha‐tropomyosin(slow) affects muscle strength, maturation and hypertrophy in a mouse model for nemaline myopathy. Hum Mol Genet 10: 317–328 [DOI] [PubMed] [Google Scholar]
- 78. Keipert S, Ost M, Chadt A, Voigt A, Ayala V, Portero‐Otin M, Pamplona R, Al‐Hasani H, Klaus S (2013) Skeletal muscle uncoupling‐induced longevity in mice is linked to increased substrate metabolism and induction of the endogenous antioxidant defense system. Am J Physiol Endocrinol Metab 304: E495–E506 [DOI] [PubMed] [Google Scholar]
- 79. Neschen S, Katterle Y, Richter J, Augustin R, Scherneck S, Mirhashemi F, Schurmann A, Joost HG, Klaus S (2008) Uncoupling protein 1 expression in murine skeletal muscle increases AMPK activation, glucose turnover, and insulin sensitivity in vivo . Physiol Genomics 33: 333–340 [DOI] [PubMed] [Google Scholar]
- 80. Pesta D, Gnaiger E (2012) High‐resolution respirometry: OXPHOS protocols for human cells and permeabilized fibers from small biopsies of human muscle. Methods Mol Biol 810: 25–58 [DOI] [PubMed] [Google Scholar]
- 81. Lemieux H, Blier PU, Gnaiger E (2017) Remodeling pathway control of mitochondrial respiratory capacity by temperature in mouse heart: electron flow through the Q‐junction in permeabilized fibers. Sci Rep 7: 2840 [DOI] [PMC free article] [PubMed] [Google Scholar]
- 82. Holmstrom MH, Iglesias‐Gutierrez E, Zierath JR, Garcia‐Roves PM (2012) Tissue‐specific control of mitochondrial respiration in obesity‐related insulin resistance and diabetes. Am J Physiol Endocrinol Metab 302: E731–E739 [DOI] [PubMed] [Google Scholar]
Associated Data
This section collects any data citations, data availability statements, or supplementary materials included in this article.
Supplementary Materials
Expanded View Figures PDF
Review Process File