

Abstract
Background
Peri-implantitis is an inflammatory reaction affecting both hard and soft tissues surrounding dental implants. This pathological condition is caused by a polymicrobial aggressive biofilm that colonizes the implant and abutment surface at the peri-implant crevice level. The present in vitro study evaluated different methods of implant surface decontamination and assessed whether the type of the implant surface influences the results.
Material/Methods
The study was conducted in an in vitro model of peri-implantitis using 30 implants. The implants were divided into 3 equal groups based on the surface characteristics: machined-surface, sand-blasted and acid-etched, and HA-coated. Implants were coated with E. coli biofilm. After an incubation period, they were decontaminated with 4 different methods: sonic scaler application, sonic scaler application with the chemical agent Perisolv® combination, Er: YAG laser treatment, and PDT therapy with methylene blue as a photosensitizer.
Results
The highest level of decontamination was achieved for machined-surface implants and for the combined chemical-mechanical and Er: YAG laser treatment.
Conclusions
The results of our study suggest that the method of implant decontamination should be customized to the type of implant surface.
MeSH Keywords: Biofilms, Decontamination, Laser Therapy, Peri-Implantitis, Photochemotherapy
Background
Peri-implantitis is an inflammatory process in tissues around dental implants, gradually leading to loss of supporting bone [1]. The biofilm, which is predominantly made up with gram-negative bacteria and anaerobes, is highly associated with this condition [2]. The most common microbes present in the biofilm are Aggregatibacter actinomycetemcomitans, Porphyromonas gingivalis, Prevotella intermedia, Fusobacterium spp., Tannerella forsythia, Treponema denticola, and Selenomonas sputigena [3]. Other microorganisms are less commonly involved in periodontal patients, such as Staphylococcus aureus, Staphylococcus epidermidis, Enterobacter aerogenes, Enterobacter cloace, Escherichia coli, Helicobacter pylori, Parvimonas micra, Pseudomonas spp., and Candida spp. [4].
There is a direct correlation between the increased use of dental implants and peri-implantitis, which, if not treated, can affect not only the junctional epithelium, but also can spread to bone marrow.
Due to its complexity, the treatment of peri-implantitis is challenging and involves many techniques to regenerate the bone and soft tissue. Regardless of the details, the first and most important step of every treatment is to decontaminate the implant surfaces. For this purpose, a number of mechanical interventions (e.g., abrasive air-powder, Teflon and plastic curettes, and ultrasonic devices) and chemical agents (e.g., chlorhexidine and hydrogen peroxide) are used, solely, or in combination. Although all the of these procedures are somewhat successful, none are excellent. Recently, the application of Er: YAG laser and photodynamic therapy (PDT) was introduced as a possibly better option [5–8].
Since the introduction of dental implants with improved osteoconductive surface, the issue of dental implant decontamination has gained complexity. Previously used machined-surface implants were less likely to be coated with bacterial film and were easier to decontaminate in a dental office with one of the above-mentioned procedures. However, this issue became more problematic with the introduction of SLA implants, which have rough surfaces. SLA implants have gained in popularity due to their high level of bone-to-implant contact (BIC), which results in faster and stronger osteointegration [9]. Apart from using SLA implants, the other option to improve osteointegration is coating the titanium implants with Ca: P. Due to many its disadvantages, the previously used plasma-sprayed (sprayed HA) implants were replaced by electrochemical deposition, which creates a microporous structure with an optimal solubility and resorption [10]. Unlike the highly crystalline, poorly soluble plasma-sprayed HA coatings, the electrochemical coating technology yields a fine crystalline structure. The process eliminates hard particles and flaking of the coating [11]. The present in vitro study evaluated different methods of bacterial biofilm decontamination of dental implants with various types of surfaces. Peri-implantitis is caused by gram-negative and anaerobic bacteria. As a model for gram-negative bacteria, Escherichia coli was used, which is a microorganism associated with the early stage of peri-implantitis [12].
Material and Methods
Implants
Total of 30 implants were used in this study, which were divided into 3 equal groups. All implants had the same length and diameter (L12Ø4 mm). The first group consisted of machined-surface (M) implants (SGS Dental Implant System Holding -Zn St. Gallen, Switzerland), with an average surface roughness (Ra) of 0.4 μm (machined group). In the second group (group SLA), Dentium Superline II (Dentium, Korea) SLA was used (Ra 1.35 μm). The third group (group HA) was HA-coated dental implants (SGS Dental Implant System Holding – Zn St. Gallen, Switzerland) (Ra 1.3 μm).
Bacterial species choice and cultivation
We used MacConkey’s medium (BioMaxima/Biocorp), sugar broth (BioMaxima/Biocorp), saponin (SIGMA), and E. coli reference strain ATCC 25922.
Conduct of the experiment
Preparation of the inoculums
The E. coli ATCC 25922 strain from MacConkey medium was seeded into sugar broth and incubated at 37°C for 24 h. From this culture, an inoculum was prepared, with a density of 0.5 on the MacFarland scale (MFa)
Implants coating
We inoculated 500 μl of inoculums with 50 mL of sugar broth. Then, the implant was aseptically inserted and the whole was incubated at 37°C for 24 h.
Preparation of implants for further tests
After incubation, the implants were removed from the culture and rinsed 3 times in 10 mL of sterile saline to remove the plankton forms of the culture, leaving only the biofilm formed by E. coli on the surface. These prepared implants were transferred for further tests.
Model of the jaw
The peri-implantitis model of the jaw was created from Acrylonitrile butadiene styrene (ABS). Following the CIST (Cumulative Interceptive Supportive Therapy) guidelines, we chose a 6-mm bone loss defect model as representative of advanced-stage peri-implantitis. The artificial deficiency imitating bone defect was created by removing the material with a calibrated trephine drill around the implant side. Before decontamination, each implant was placed in the peri-implantitis jaw model.
Decontamination protocols
All groups of implants were decontaminated with 4 different methods. The following decontamination protocols were used in the study:
Solely mechanical biofilm removal by the use of a Woodpecker PT5 sonic scaler (Woodpecker, China) (s). Each implant was treated with a sonic device for 2 min alone with set parameters of water pressure 0.5 MPa, tip vibration frequency 28 kHz, and output power 20W.
Mechanical debridement with sonic scaler and combination of chemical agent Perisolv® (Regedent AG, Switzerland). Each implant was pre-treated with Perisolv® application, making sure that the entire surface was covered and left in situ for 30 s, then the sonic scaler was applied for 2 min with set parameters of water pressure 0.5 MPa, tip vibration frequency 28 kHz, and output power 20W (s+p) (Figure 1).
Er: YAG laser treatment. Implants were decontaminated with Er-YAG (LiteTouch™, Israel) laser irradiation with the tip 1.3×17 mm, working up and down continuously for 2 min, with laser beam parameters set for 40 mJ, 0.80 W, and 20 Hz (Er: YAG) (Figure 2).
PDT (PeriowaveTM, Vancouver, BC, Canada [k 660–675 nm, 11 mW]) was used.
Figure 1.
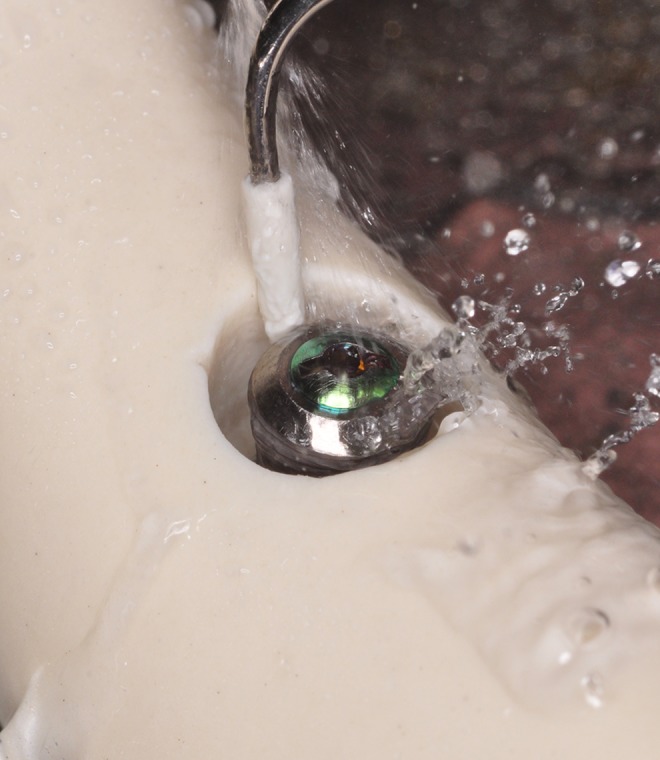
Solely mechanical biofilm removal using a Woodpecker PT5 sonic scaler (Woodpecker, China), working continuously for 2 min with parameters of water pressure 0.5 MPa, tip vibration frequency 28 kHz, and output power 20 W.
Figure 2.
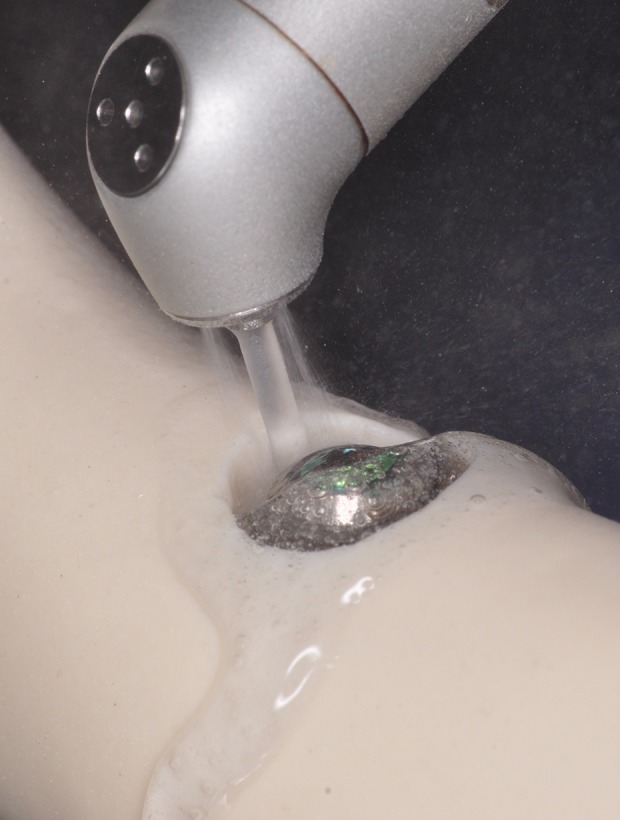
Er: YAG (LiteTouch™, Israel) laser irradiation with the tip 1.3×17 mm, working up and down continuously for 2 min, and the laser beam parameters were set for 40 mJ, 0.80 W, and 20 Hz.
One milliliter of photosensitizer consisted of 3,7-bis (dimethyl-amino) phenazathionium chloride trihydrate (methylene blue) at the concentration of 0.005% (w/v) was added to each implant, making sure that the entire surface was covered and left in situ for 60 s prior to irradiation. An even light was emitted from the tip of the pulsed diode soft laser (PeriowaveTM, Vancouver, BC, Canada) at a fixed distance of 10 cm from the implant. Static irradiation (25 mW/cm2) for the entire implant was completed in 60 s. Afterwards, the implant was rinsed with 0.9% NaCl (Figure 3).
Figure 3.
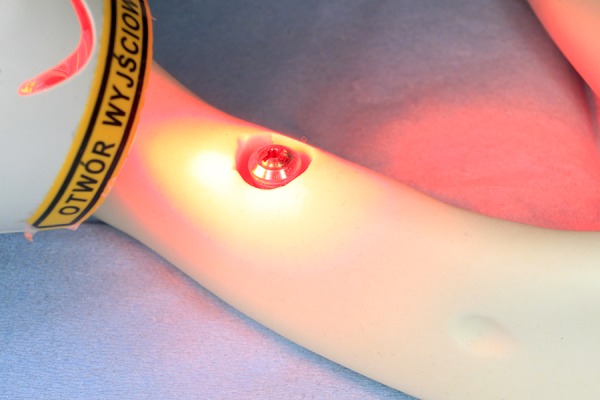
One milliliter of photosensitizer consisted of 3,7-bis (dimethyl-amino) phenazathionium chloride trihydrate (methylene blue) at the concentration of 0.005% (w/v) was added. PDT (PeriowaveTM, Vancouver, BC, Canada [k 660–675 nm, 11 mW]) was used.
Each implant was treated with the specific method and sent for further microbiological evaluation.
Quantitative evaluation of microorganisms present in the biofilm on the implants surface
To remove the biofilm from the implant surfaces, a watery saponin solution was used. Each implant was placed separately in 1 mL of 0.5% saponin solution and shaken for 1 min (2500 rpm; vortex: Heidolph Reax Control). The obtained suspension of strains (saponin solution and bacteria suspended in it, detached from the implants) was immediately cultured on MacConkey’s medium. In the inoculation of bacteria, undiluted suspension was used and suspension with dilutions from 1: 10 to 1: 1000 inoculating volume: 10 L, 20 L, 50 L, and 100 L. To obtain maximum separation of the biofilm, the procedure was repeated 3 times.
Inoculated plates with MacConkey medium were incubated at 37°C for 22–24 h.
Reading the results
After incubation, the colonies grown on the plates were counted and the results obtained were given as the number of CFU (colony-forming units) per 1 mL.
The following formula was used to calculate the percentage of biofilm reduction R [%]:
SC (CFU/mL] – a total number of E. coli cells detached from the implant coating biofilm without the test factor acting (number of CFU/mL on the control implant).
S (CFU/mL) – a total number of E. coli cells detached from the implant coating biofilm, which remains after the test factor acted.
In addition, to compare and reduce the measurement error, the degree of biofilm reduction was calculated after the rejection of extreme values:
S’C (CFU/ml] – a total number of E. coli cells detached from the implant coating biofilm without the test factor acting (number of CFU/ml on the control implant), with no maximum or minimum value.
S’ (CFU/ml) – a total number of E. coli cells detached from the implant coating biofilm, which remains after the test factor acted, with no maximum or minimum value.
Statistical analysis
The Shapiro-Wilk test was used to assess normality of distribution. Then, the results were tested with Tukey’s HSD test to check the differences between methods of treatment and among and between groups of implants.
Results
Machined-surface implants and SLA implants achieved the highest level of decontamination, with an efficacy level of over 96.25% (R) and 95.80% (R’) average among this group for M and 93.19% and 92.21%, respectively, for SLA, without any statistically significant differences. The most difficult type of implant surface to decontaminate was the HA-coated implant (81.87% and 81.06%) of averaged decontamination level with statistically significant differences from other groups (Tables 1–4). Laser irradiation was to be 95.23% (R) and 94.83% (R’) with the statistically significant differences from group PDT but not from other groups (Tables 5, 6). Only for SLA implants the decontamination with scaler and Perisolv® application had comparable effectivity to laser irradiation (without statistically significant differences between groups). In 2 other groups the laser irradiation was superior to other methods of treatment. In fact, in HA-coated implants laser irradiation was the only method of decontamination that achieved higher than 90% level. Surprisingly, the poorest results of decontamination were generally achieved with PDT treatment, with the statistically significant differences vs. S+P and Er: YAG. The additional application of Perisolv® generally improved the effectivity of the scaler, and in machined-surface implants both mechanical and combined mechanical and chemical treatment had comparably high results (Table 6).
Table 1.
Results of decontamination in group M.
| R[%] | R’[%] | R[%] | R’[%] | R[%] | R’[%] | R[%] | R’[%] | |
|---|---|---|---|---|---|---|---|---|
| Method of decontamination | s+p | s+p | s | s | Pdt | pdt | Er: YAG | Er: YAG |
| 97.31 | 97.35 | 99.61 | 99.61 | 88.36 | 88.25 | 98.03 | 99.38 | |
| 98.87 | 99.08 | 99.10 | 99.25 | 87.52 | 87.25 | 99.99 | 99.02 | |
| 100.00 | 100.00 | 97.13 | 97.44 | 86.06 | 85.92 | 97.95 | 98.97 | |
| 99.19 | 99.22 | 98.49 | 98.66 | 88.27 | 88.07 | 99.58 | 98.99 | |
| 98.87 | 98.92 | 99.79 | 98.70 | 87.92 | 87.89 | 99.82 | 99.95 | |
| 99.01 | 98.14 | 99.08 | 99.05 | 87.34 | 87.11 | 99.66 | 89.91 | |
| 98.84 | 99.49 | 96.91 | 99.85 | 86.41 | 86.68 | 98.79 | 99.97 | |
| 99.76 | 97.36 | 98.26 | 98.35 | 87.51 | 86.97 | 99.75 | 99.54 | |
| 96.93 | 98.07 | 99.79 | 97.65 | 88.02 | 88.09 | 99.89 | 99.94 | |
| 97.95 | 98.45 | 97.99 | 98.03 | 97.04 | 87.45 | 99.29 | 99.99 | |
| Average | 98.67 | 98.61 | 98.62 | 98.66 | 88.45 | 87.37 | 99.28 | 98.57 |
Table 2.
Results of decontamination in group SLA.
| R[%] | R’[%] | R[%] | R’[%] | R[%] | R’[%] | R[%] | R’[%] | |
|---|---|---|---|---|---|---|---|---|
| Method of decontamination | s+p | s+p | s | s | Pdt | pdt | Er: YAG | Er: YAG |
| 97.71 | 98.14 | 93.20 | 92.38 | 97.72 | 97.34 | 99.31 | 99.22 | |
| 93.10 | 93.19 | 97.52 | 97.85 | 74.82 | 74.58 | 94.15 | 94.56 | |
| 96.28 | 96.44 | 92.58 | 92.42 | 98.45 | 98.49 | 99.92 | 99.93 | |
| 95.71 | 99.03 | 95.32 | 95.09 | 92.29 | 92.13 | 99.56 | 99.60 | |
| 94.91 | 98.92 | 89.29 | 90.55 | 77.25 | 76.90 | 99.86 | 99.84 | |
| 96.71 | 91.91 | 93.65 | 93.67 | 86.79 | 86.97 | 96.87 | 96.99 | |
| 93.51 | 96.04 | 95.62 | 95.02 | 84.34 | 81.67 | 88.86 | 86.38 | |
| 91.37 | 93.56 | 91.44 | 92.09 | 89.04 | 88.55 | 90.22 | 90.53 | |
| 97.92 | 97.23 | 95.06 | 92.52 | 88.64 | 88.09 | 96.11 | 96.85 | |
| 97.99 | 97.51 | 92.04 | 94.97 | 86.49 | 86.22 | 95.99 | 94.86 | |
| Average | 95.52 | 96.20 | 93.57 | 93.66 | 87.58 | 87.09 | 96.09 | 95.88 |
Table 3.
Results of decontamination in group HA.
| R[%] | R’[%] | R[%] | R’[%] | R[%] | R’[%] | R[%] | R’[%] | |
|---|---|---|---|---|---|---|---|---|
| Method of decontamination | s+p | s+p | s | s | Pdt | pdt | Er: YAG | Er: YAG |
| 93.48 | 94.03 | 79.03 | 78.99 | 95.01 | 95.44 | 84.70 | 84.25 | |
| 69.27 | 65.61 | 65.35 | 65.13 | 88.36 | 87.32 | 99.93 | 99.93 | |
| 94.22 | 94.02 | 86.07 | 86.07 | 13.34 | 30.07 | 99.73 | 99.74 | |
| 87.61 | 87.02 | 86.25 | 86.65 | 63.67 | 65.59 | 79.32 | 78.53 | |
| 86.14 | 85.18 | 80.02 | 79.29 | 17.95 | 13.70 | 69.75 | 68.47 | |
| 87.24 | 85.26 | 79.21 | 86.78 | 91.73 | 91.94 | 98.64 | 98.65 | |
| 85.67 | 85.02 | 78.91 | 76.04 | 90.50 | 91.69 | 99.85 | 99.88 | |
| 85.78 | 86.04 | 81.06 | 78.87 | 82.90 | 78.48 | 91.34 | 90.77 | |
| 86.27 | 84.95 | 78.09 | 76.41 | 88.65 | 89.07 | 89.06 | 90.34 | |
| 86.37 | 85.48 | 78.01 | 73.95 | 85.44 | 84.92 | 91.04 | 89.88 | |
| Average | 86.21 | 85.26 | 79.20 | 78.82 | 71.76 | 70.12 | 90.34 | 90.04 |
Table 4.
Tukey’s HSD test. Differences between surfaces. Statistically significant differences are highlighted in bold font.
| Surface | 1 | 2 | 3 |
|---|---|---|---|
| M | 0.00002 | 0.20822 | |
| HA | 0.00002 | 0.00002 | |
| SLA | 0.20822 | 0.00002 |
Table 5.
Tukey’s HSD test. Differences between methods of decontaminations. Statistically significant differences are highlighted in bold font.
| Method | 1 | 2 | 3 | 4 | 5 | 6 | 7 | 8 |
|---|---|---|---|---|---|---|---|---|
| S+P R | 1.000 | 0.957 | 0.950 | 0.002 | 0.001 | 0.998 | 0.999 | |
| S+P R’ | 1.000 | 0.965 | 0.959 | 0.002 | 0.001 | 0.997 | 0.999 | |
| S R | 0.957 | 0.965 | 1.000 | 0.076 | 0.024 | 0.656 | 0.751 | |
| S R’ | 0.950 | 0.957 | 1.000 | 0.083 | 0.026 | 0.635 | 0.732 | |
| PDT R | 0.002 | 0.002 | 0.076 | 0.083 | 0.999 | 0.001 | 0.001 | |
| PDT R’ | 0.001 | 0.001 | 0.024 | 0.026 | 0.999 | 0.001 | 0.001 | |
| Er: YAG R | 0.998 | 0.997 | 0.656 | 0.635 | 0.001 | 0.001 | 1.000 | |
| Er: YAG R’ | 0.999 | 0.999 | 0.751 | 0.732 | 0.001 | 0.001 | 1.000 |
Table 6.
Tukey’s HSD test among all groups and decontamination methods. Statistically significant differences are highlighted in bold font.
| Surface | Method | 1 | 2 | 3 | 4 | 5 | 6 | 7 | 8 | 9 | 10 | 11 | 12 | 13 | 14 | 15 | 16 | 17 | 18 | 19 | 20 | 21 | 22 | 23 | 24 |
|---|---|---|---|---|---|---|---|---|---|---|---|---|---|---|---|---|---|---|---|---|---|---|---|---|---|
| M | S+P R | 1.000 | 1.000 | 1.000 | 0.888 | 0.756 | 1.000 | 1.000 | 0.566 | 0.408 | 0.008 | 0.006 | 0.001 | 0.001 | 0.987 | 0.980 | 1.000 | 1.000 | 0.999 | 0.999 | 0.787 | 0.714 | 1.000 | 1.000 | |
| M | S+P R’ | 1.000 | 1.000 | 1.000 | 0.894 | 0.765 | 1.000 | 1.000 | 0.578 | 0.419 | 0.008 | 0.006 | 0.001 | 0.001 | 0.988 | 0.982 | 1.000 | 1.000 | 0.999 | 0.999 | 0.795 | 0.724 | 1.000 | 1.000 | |
| M | S R | 1.000 | 1.000 | 1.000 | 0.893 | 0.764 | 1.000 | 1.000 | 0.576 | 0.417 | 0.008 | 0.006 | 0.001 | 0.001 | 0.988 | 0.982 | 1.000 | 1.000 | 0.999 | 0.999 | 0.794 | 0.723 | 1.000 | 1.000 | |
| M | S R’ | 1.000 | 1.000 | 1.000 | 0.889 | 0.758 | 1.000 | 1.000 | 0.569 | 0.410 | 0.008 | 0.006 | 0.001 | 0.001 | 0.987 | 0.981 | 1.000 | 1.000 | 0.999 | 0.999 | 0.787 | 0.716 | 1.000 | 1.000 | |
| M | PDT R | 0.888 | 0.894 | 0.893 | 0.889 | 1.000 | 0.821 | 0.898 | 1.000 | 1.000 | 0.958 | 0.936 | 0.071 | 0.001 | 1.000 | 1.000 | 0.998 | 0.995 | 0.999 | 0.999 | 1.000 | 1.000 | 0.996 | 0.997 | |
| M | PDT R’ | 0.756 | 0.764 | 0.764 | 0.758 | 1.000 | 0.661 | 0.771 | 1.000 | 1.000 | 0.990 | 0.982 | 0.138 | 0.001 | 1.000 | 1.000 | 0.990 | 0.974 | 0.999 | 0.999 | 1.000 | 1.000 | 0.978 | 0.983 | |
| M | Er: YAG R | 1.000 | 1.000 | 1.000 | 1.000 | 0.821 | 0.661 | 1.000 | 0.464 | 0.317 | 0.005 | 0.003 | 0.001 | 0.001 | 0.971 | 0.958 | 1.000 | 1.000 | 0.999 | 0.999 | 0.696 | 0.615 | 1.000 | 1.000 | |
| M | Er: YAG R’ | 1.000 | 1.000 | 1.000 | 1.000 | 0.898 | 0.771 | 1.000 | 0.585 | 0.425 | 0.009 | 0.006 | 0.001 | 0.001 | 0.989 | 0.983 | 1.000 | 1.000 | 0.999 | 0.999 | 0.801 | 0.731 | 1.000 | 1.000 | |
| HA | S+P R | 0.567 | 0.578 | 0.576 | 0.569 | 1.000 | 1.000 | 0.464 | 0.585 | 1.000 | 0.998 | 0.997 | 0.258 | 0.104 | 1.000 | 1.000 | 0.954 | 0.909 | 0.999 | 0.997 | 1.000 | 1.000 | 0.918 | 0.933 | |
| HA | S+P R’ | 0.408 | 0.419 | 0.417 | 0.410 | 1.000 | 1.000 | 0.317 | 0.425 | 1.000 | 0.999 | 0.999 | 0.393 | 0.181 | 0.999 | 0.999 | 0.885 | 0.807 | 0.986 | 0.986 | 1.000 | 1.000 | 0.821 | 0.847 | |
| HA | S R | 0.008 | 0.008 | 0.008 | 0.008 | 0.959 | 0.990 | 0.005 | 0.009 | 0.998 | 0.999 | 1.000 | 0.997 | 0.965 | 0.780 | 0.819 | 0.090 | 0.057 | 0.258 | 0.258 | 0.986 | 0.993 | 0.062 | 0.071 | |
| HA | S R’ | 0.006 | 0.006 | 0.006 | 0.006 | 0.936 | 0.982 | 0.003 | 0.006 | 0.997 | 0.999 | 1.000 | 0.998 | 0.978 | 0.723 | 0.767 | 0.070 | 0.438 | 0.213 | 0.213 | 0.976 | 0.998 | 0.047 | 0.055 | |
| HA | PDT R | 0.001 | 0.001 | 0.001 | 0.001 | 0.070 | 0.138 | 0.001 | 0.001 | 0.258 | 0.393 | 0.997 | 0.998 | 1.000 | 0.017 | 0.022 | 0.001 | 0.001 | 0.001 | 0.001 | 0.122 | 0.162 | 0.001 | 0.001 | |
| HA | PDT R’ | 0.001 | 0.001 | 0.001 | 0.001 | 0.021 | 0.048 | 0.001 | 0.001 | 0.104 | 0.181 | 0.965 | 0.978 | 1.000 | 0.004 | 0.005 | 0.001 | 0.001 | 0.001 | 0.001 | 0.041 | 0.058 | 0.001 | 0.001 | |
| HA | Er: YAG R | 0.987 | 0.988 | 0.988 | 0.987 | 1.000 | 1.000 | 0.971 | 0.989 | 1.000 | 0.999 | 0.780 | 0.723 | 0.017 | 0.004 | 1.000 | 0.999 | 0.999 | 1.000 | 1.000 | 1.000 | 1.000 | 0.999 | 0.999 | |
| HA | Er: YAG R’ | 0.980 | 0.982 | 0.982 | 0.981 | 1.000 | 1.000 | 0.958 | 0.983 | 1.000 | 0.999 | 0.819 | 0.767 | 0.022 | 0.005 | 1.000 | 0.999 | 0.999 | 1.000 | 1.000 | 1.000 | 1.000 | 0.999 | 0.999 | |
| SLA | S+P R | 1.000 | 1.000 | 1.000 | 1.000 | 0.998 | 0.990 | 1.000 | 1.000 | 0.954 | 0.885 | 0.090 | 0.070 | 0.001 | 0.001 | 0.999 | 0.999 | 1.000 | 1.000 | 1.000 | 0.993 | 0.985 | 1.000 | 1.000 | |
| SLA | S+P R’ | 1.000 | 1.000 | 1.000 | 1.000 | 0.995 | 0.974 | 1.000 | 1.000 | 0.909 | 0.807 | 0.057 | 0.043 | 0.001 | 0.001 | 0.999 | 0.999 | 1.000 | 1.000 | 1.000 | 0.981 | 0.964 | 1.000 | 1.000 | |
| SLA | S R | 0.999 | 0.999 | 0.999 | 0.999 | 0.999 | 0.999 | 0.999 | 0.999 | 0.997 | 0.9897 | 0.268 | 0.222 | 0.001 | 0.001 | 1.000 | 1.000 | 1.000 | 1.000 | 1.000 | 0.999 | 0.999 | 1.000 | 1.000 | |
| SLA | S R’ | 0.999 | 0.999 | 0.999 | 0.999 | 0.999 | 0.999 | 0.999 | 0.999 | 0.997 | 0.9896 | 0.252 | 0.213 | 0.001 | 0.001 | 1.000 | 1.000 | 1.000 | 1.000 | 1.000 | 0.999 | 0.999 | 1.000 | 1.000 | |
| SLA | PDT R | 0.787 | 0.795 | 0.794 | 0.788 | 1.000 | 1.000 | 0.696 | 0.801 | 1.000 | 1.000 | 0.998 | 0.976 | 0.122 | 0.041 | 1.000 | 1.000 | 0.993 | 0.981 | 0.999 | 0.999 | 1.000 | 0.983 | 0.988 | |
| SLA | PDT R’ | 0.714 | 0.724 | 0.723 | 0.716 | 1.000 | 1.000 | 0.615 | 0.731 | 1.000 | 1.000 | 0.993 | 0.988 | 0.162 | 0.058 | 1.000 | 1.000 | 0.985 | 0.964 | 0.999 | 0.999 | 1.000 | 0.969 | 0.976 | |
| SLA | Er: YAG R | 1.000 | 1.000 | 1.000 | 1.000 | 0.996 | 0.978 | 1.000 | 1.000 | 0.918 | 0.821 | 0.062 | 0.047 | 0.001 | 0.001 | 0.999 | 0.999 | 1.000 | 1.000 | 1.000 | 1.000 | 0.983 | 0.969 | 1.000 | |
| SLA | Er: Yag R’ | 1.000 | 1.000 | 1.000 | 1.000 | 0.997 | 0.983 | 1.000 | 1.000 | 0.933 | 0.847 | 0.071 | 0.055 | 0.001 | 0.001 | 0.999 | 0.999 | 1.000 | 1.000 | 1.000 | 1.000 | 0.988 | 0.976 | 1.000 |
Discussion
Historically, first methods used to decontaminate dental implants and manage peri-implantitis were simply imported from general dentistry and periodontology. However, the success was limited and the methods used damaged the fragile implant surface [13], which stimulated further research. Schwarz was one of the first to compare the effectiveness of an Er: YAG laser vs. mechanical debridement with plastic curettes and antiseptic therapy with 0.2% chlorhexidine on 20 patients with moderate-to-advanced peri-implantitis. The effect of Er: YAG laser in reducing the bleeding on probing index was reported to be statistically significant [14]. The superiority of Er laser application in calculus removal, when compared with citric acid application, was also reported in an in vitro study on contaminated failed blasted implants [15]. Denisson et al. were one of the first groups to compare chemical and mechanical protocols for dental implant decontamination, performing an in vitro study using an air-powder abrasive with sodium bicarbonate as well as a citric acid solution, and 0.12% chlorhexidine used as a decontamination method on 3 different dental implant surfaces (TPS, HA-coated, and machined). They found a prevalence of chemical methods. Similar to our study, the machined implants were found to be decontaminated more effectively in comparison to the other surfaces by every kind of treatment [16]. A study by Ferreira et al. was one of the first that used E. coli as a model for implant surface decontamination. The study was conducted on SLA implants and the decontamination protocol included CO2 laser irradiation with different parameters. They found the highest decontamination level (85.5%) when continuous wave (CW) at 2.5 W was applied vs. super-pulsed waves (SPW) at 2 W at 100-Hz frequency (51.7%). However, SEM assessment showed crater-like wear damage and accretions to the implant surfaces that increased progressively along with the power used [17]. Thus, attention was focused on finding an alternative laser method of implants decontamination that would not damage the fragile implant surface. Shin et al. proved the safety of Er: YAG laser applications for that purpose, as no changes were observed in HA-coated implants or fluoride-modified TiO2-blasted implants after irradiation at an intensity of 100 mJ/pulse and 10 Hz for 1 min. Consequently, although there were minor surface alterations, including surface flattening and microfractures, no statistically significant differences were found between tested and control implants in general roughness after irradiation [18]. Furthermore, Saffarpour et al. proved that use of Er: YAG laser irradiation and PDT at 630 nm light-emitting diode and toluidine blue O as photosensitizer did not alter the surfaces of sand-blasted, large-grit, acid-etched implants [6].
Al-Hashedi et al. reported the superiority of physical methods to eliminate organic contaminants and bacteria vs. Er: YAG laser. Alternatively, Er: YAG laser-treated surfaces showed the lowest live-to-dead bacterial ratio [19]. On the contrary, Eick et al. reported significantly higher decontamination of the bacterial biofilm on titanium disks with Er: YAG laser application than with any other method, including combine curates and PDT application [20]. A different approach to implant’s surface decontamination is to modify it to achieve a surface with higher microbiocidal properties. One possible method is the deposition of silver nanoparticles. Godoy-Gallardo et al. evaluated silver-doped titanium implant surfaces prepared with an electrochemical anodizing process, reporting significant reduction of bacterial adhesion, reaching up to 98% in the group with the highest silver concentration vs. a titanium control group [21].
Conclusions
We demonstrated the superiority of Er: YAG laser treatment and combined chemical-mechanical method of implant’s surface decontamination on SLA and machined-surface implants. Er: YAG laser irradiation was found to be the best option for decontamination of HA-coated implants. The results of the present study suggest that the choice of peri-implantitis management depends on the type of implant surface.
Footnotes
Source of support: Departmental sources
Conflicts of interests
None.
References
- 1.Lindhe J, Meyle J. Peri-implant diseases: Consensus report of the sixth European workshop on periodontology. J Clin Periodontol. 2008;35:282–85. doi: 10.1111/j.1600-051X.2008.01283.x. [DOI] [PubMed] [Google Scholar]
- 2.Kumar PS, Mason MR, Broker MR, O’Brien K. Pyrosequencing reveals unique microbial signatures associated with healthy and failing dental implants. J Clin Periodontol. 2012;39(5):425–23. doi: 10.1111/j.1600-051X.2012.01856.x. [DOI] [PMC free article] [PubMed] [Google Scholar]
- 3.Belibasakis GN, Charalampakis G, Bostanci N, Stadlinger B. Peri-implant infections of oral biofilm etiology. Adv Exp Med Biol. 2015;830:69–74. doi: 10.1007/978-3-319-11038-7_4. [DOI] [PubMed] [Google Scholar]
- 4.Belibasakis GN. Microbiological and immuno-pathological aspects of peri-implant diseases. Arch Oral Biol. 2014;59(1):66–62. doi: 10.1016/j.archoralbio.2013.09.013. [DOI] [PubMed] [Google Scholar]
- 5.Heitz-Mayfield L, Lang NP. Comparative biology of chronic and aggressive periodontitis vs. peri-implantitis. Periodont 2000. 2010;53:167–71. doi: 10.1111/j.1600-0757.2010.00348.x. [DOI] [PubMed] [Google Scholar]
- 6.Saffarpour A, Nozari A, Fekrazad R, et al. Evaluation of contaminated implant surface treated by laser, photodynamic therapy, and Chlorhexidine 2 percent. Int J Oral Maxillofac Implants. 2018;33(5):1019–26. doi: 10.11607/jomi.6325. [DOI] [PubMed] [Google Scholar]
- 7.Jin SH, Lee EM, Park JB, et al. Decontamination methods to restore the biocompatibility of contaminated titanium surfaces. J Periodontal Implant Sci. 2019;49(3):193–94. doi: 10.5051/jpis.2019.49.3.193. [DOI] [PMC free article] [PubMed] [Google Scholar]
- 8.Kuo HN, Mei HI, Liu TY, et al. In vitro laser treatment platform construction with dental implant thread surface on bacterial adhesion for peri-implantitis. Biomed Res Int. 2017;2017:e4732302. doi: 10.1155/2017/4732302. [DOI] [PMC free article] [PubMed] [Google Scholar]
- 9.Lang NP, Salvi GE, Huynh-Ba G, et al. Early osseointegration to hydrophilic and hydrophobic implant surfaces in humans. Clin Oral Implants Res. 2011;22(4):349–46. doi: 10.1111/j.1600-0501.2011.02172.x. [DOI] [PubMed] [Google Scholar]
- 10.De Groot K, Wolke JCG, Jansen JA. State of the art: Hydroxyapatite coatings for dental implants. J Oral Implant. 1994;20:232. [Google Scholar]
- 11.Becker P, Neumann H-G, Nebe B, et al. Cellular investigation on electrochemically deposited calcium phosphate composites. J Mater Sci Mater Med. 2004;15:437–40. doi: 10.1023/b:jmsm.0000021116.13016.61. [DOI] [PubMed] [Google Scholar]
- 12.Medina CMA, Villa-Correa YA. Gram-negative enteric rods associated to early implant failure and peri-implantitis: Case report and systematic literature review. Int J Odontostomat. 2015;9(2):329–36. [Google Scholar]
- 13.Shumaker ND, Metcalf BT, Toscano NT, Holtzclaw DJ. Periodontal and peri-implant maintenance: A critical factor in long-term treatment success. Comp Contin Educ Dent. 2009;30:388–90. [PubMed] [Google Scholar]
- 14.Schwarz F, Sculean A, Rothamel D, et al. Clinical evaluation of an Er: YAG laser for nonsurgical treatment of peri-implantitis: A pilot study. Clin Oral Impl Res. 2004;16(1):44–52. doi: 10.1111/j.1600-0501.2004.01051.x. [DOI] [PubMed] [Google Scholar]
- 15.Gholami GA, Karamlou M, Fekrazad R, et al. Comparison of the effects of Er, Cr: YSGG laser and super-saturated citric acid on the debridement of contaminated implant surfaces. J Lasers Med Sci. 2018;9(4):254–60. doi: 10.15171/jlms.2018.46. [DOI] [PMC free article] [PubMed] [Google Scholar]
- 16.Dennison DK, Huerzeler MB, Quinones C, Caffesse RG. Contaminated implant surfaces: An in vitro comparison of implant surface coating and treatment modalities for decontamination. J Periodontol. 1994;65(10):942–48. doi: 10.1902/jop.1994.65.10.942. [DOI] [PubMed] [Google Scholar]
- 17.Ferreira CF, Babu J, Migliorati EK, et al. Assessment of the effect of CO2 laser irradiation on the reduction of bacteria seeded on commercially available sandblasted acid-etched titanium dental implants: An in vitro study. Int J Maxillofac Impl. 2015;30(3):588–95. doi: 10.11607/jomi.3925. [DOI] [PubMed] [Google Scholar]
- 18.Shin SI, Lee EK, Kim JH, et al. The effect of Er: YAG laser irradiation on hydroxyapatite-coated implants and fluoride-modified TiO2-blasted implant surfaces: A microstructural analysis. Lasers Med Sci. 2013;28(3):823–31. doi: 10.1007/s10103-012-1162-8. [DOI] [PubMed] [Google Scholar]
- 19.Al-Hashedi AA, Laurenti M, Benhamou V, Tamimi F. Decontamination of titanium implants using physical methods. Clin Oral Impl Res. 2017;28(8):1013–21. doi: 10.1111/clr.12914. [DOI] [PubMed] [Google Scholar]
- 20.Eick S, Meier I, Spoerlé F, et al. In vitro activity of Er: YAG laser in comparison with other treatment modalities on biofilm ablation from implant and tooth surfaces. PLoS Onem. 2017;12(1):e0171086. doi: 10.1371/journal.pone.0171086. [DOI] [PMC free article] [PubMed] [Google Scholar]
- 21.Godoy-Gallardo M, Rodríguez-Hernández AG, Delgado LM, et al. Silver deposition on titanium surface by electrochemical anodizing process reduces bacterial adhesion of Streptococcus sanguinis and Lactobacillus salivarius. Clin Oral Impl Res. 2014;26(10):1170–79. doi: 10.1111/clr.12422. [DOI] [PubMed] [Google Scholar]