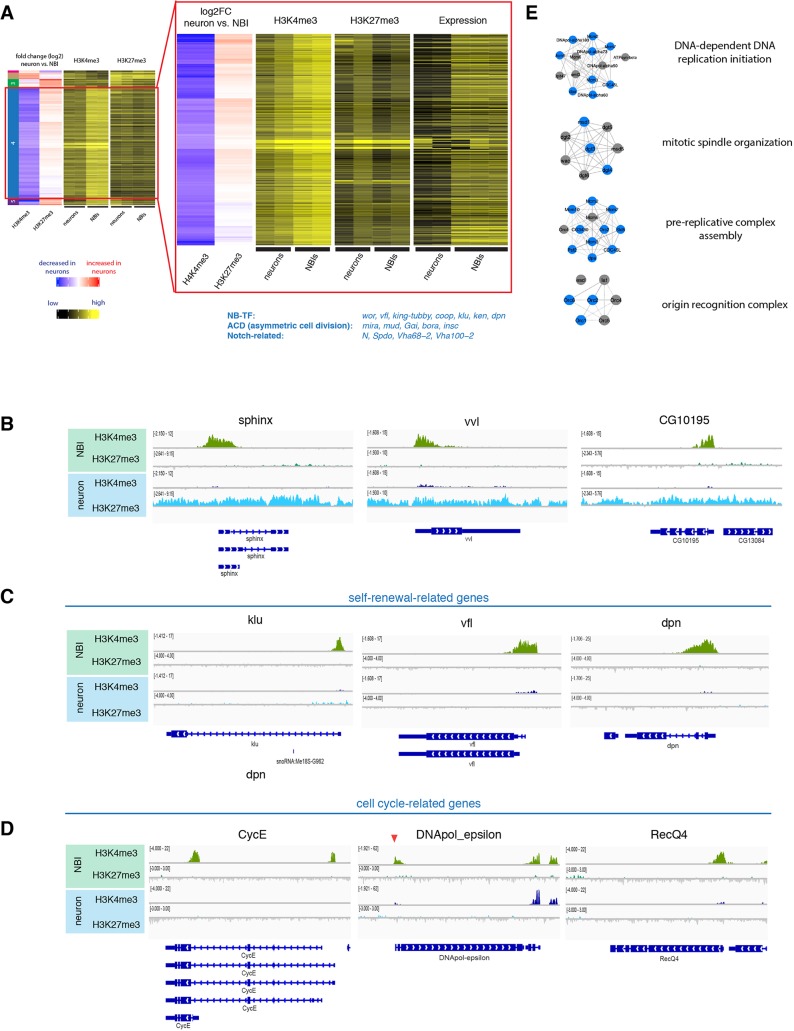
Fig. 2.
Changes of active and repressive histone modifications upon differentiation. (A) Unsupervised hierarchical clustering analysis of gene log2 fold change between NBIs and neurons. NB-related genes of cluster 4 according to literature are indicated blue. Close up to cluster 4 genes showing heatmap of TPM values, together with H3K4me3 and H3K27me3 changes between neurons versus NBIs. (B) ChIP-seq tracks of representative examples for genes of cluster 5. (C,D) ChIP-seq tracks of representative examples for cell-cycle-related genes (C) and self-renewal-related genes (D). (E) Examples of mitosis-related protein complexes. Blue indicates genes found in cluster 4.

