

Abstract
The sympathetic nervous system innervates peripheral organs to regulate their function and maintain homeostasis, whereas target cells also produce neurotrophic factors to promote sympathetic innervation1,2. The molecular basis of this bi-directional communication remains to be fully elucidated. Here we use thermogenic adipose tissue as a model system to show that T cells, specifically γδT cells, play a critical role in promoting sympathetic innervation, at least in part through driving TGFβ1 expression in parenchymal cells via IL-17 Receptor C. Adipose-specific ablation of IL-17 Receptor C reduces TGFβ1 expression in adipocytes, impairs local sympathetic innervation and causes obesity and other metabolic phenotypes consistent with defective thermogenesis; innervation can be fully rescued by restoring TGFβ1 expression. Ablating γδT cells and the IL-17 Receptor C signaling pathway also impairs sympathetic innervation in salivary glands and the lung. These findings demonstrate T cell/parenchymal cell coordination to regulate sympathetic innervation.
The sympathetic nervous system controls various physiological processes, such as vascular tone, cardiac output, glandular secretion and thermogenesis, to maintain homeostasis in response to environmental cues1. Whereas sympathetic nerves modulate the activity of end-organs via the release of various neurotransmitters, target cells of innervation also produce factors to influence the development, maturation or activity of sympathetic nerves2. The staggering complexity of target cells of innervation, coupled with the emerging picture of distinct populations of sympathetic neurons3, suggests that a multitude of such factors or pathways may be employed in a context-dependent manner. Given the limited known cases of target-derived factors that contribute to neuronal development, maturation and activity, the molecular basis of the bi-directional communication between sympathetic nerves and target cells remains to be fully elucidated.
Thermogenic adipose tissue is richly innervated by sympathetic nerves4–7. Local sympathetic axon terminals release the neurotransmitter norepinephrine (NE) to stimulate lipolysis in brown and beige adipocytes via the canonical β-adrenergic receptor/cAMP/PKA pathway. The released free acid is then oxidized in mitochondria and the harnessed chemical energy is dissipated in the form of heat via both uncoupled and coupled respiration, a process known as adaptive thermogenesis5,8–11. Importantly, previous studies have shown that sympathetic innervation of thermogenic adipose tissue is regulated by adipocyte-expressed genes, including the transcription regulator PRDM16, the ER membrane protein CLSTN3β and a neurotrophic factor S100B; thus, suggesting that thermogenic adipose tissue is an appropriate system to study how peripheral targets communicate with the sympathetic nervous system12–14.
Adipose tissue is infiltrated by various types of innate and adaptive immune cells. Previous studies have uncovered the contribution of innate immune cells, particularly anti-inflammatory macrophages, eosinophils, and type 2 innate lymphoid cells (ILC2s), to adipose thermogenesis15. Here we show that T cells, specifically γδT cells, play a key role in sympathetic innervation of thermogenic adipose tissue, thereby maintaining whole-body energy homeostasis. Mechanistically, γδT cells and IL-17F drives TGFβ1 expression in adipocytes via IL-17 Receptor C signaling. Adipocyte-derived TGFβ1 in turn promotes sympathetic innervation. Importantly, this pathway is found to be functionally important in multiple types of target tissue of sympathetic innervation other than BAT, and thus likely represents a neurotrophic mechanism of general implication.
Results
γδ T cells promote adaptive thermogenesis
To evaluate the role of lymphocytes in adaptive thermogenesis, wild-type (WT) and Rag2−/− mice, which lack both B cells and T cells, were subjected to a cold tolerance test. Rag2−/− mice exhibited significantly impaired cold tolerance compared with WT littermates (Fig. 1a). To further delineate the contribution of different lymphocyte compartments to this phenotype, we then examined the cold tolerance of Tcrα−/−, muMT−/− and TCRδ−/− mice, which lack αβ T cells, B cells and γδ T cells respectively. muMT−/− and Tcrα−/− mice have either a normal or only a mildly compromised cold tolerance; in contrast, Tcrδ−/− mice showed markedly compromised cold tolerance, similar to the Rag2−/− mice (Fig. 1b, c and d). Importantly, Tcrδ−/− mice displayed reduced oxygen consumption upon acute cold challenge and increased lipid content in brown adipose tissue (BAT) compared with WT littermates, both of which suggest BAT dysfunction (Extended Data Fig. 1a and b). There was no significant difference in food intake, motor activity or cold-induced shivering between Tcrδ−/− and WT mice (Extended Data Fig. 1c and d).
Figure 1. γδ T cells and adipocyte Il17rc control adaptive thermogenesis.

a, b, c, d, Rag2−/−, Tcrδ−/−, Tcrα−/− but not muMT−/− mice are sensitive to acute cold exposure (WT littermate n=13, Rag2−/− n=10; WT littermate n=15, muMT−/− n=10; WT littermate n=13, Tcrα−/− n=9; WT littermate n=10, Tcrδ−/− n=9 mice). Data are mean ± SEM and analyzed by Two-way ANOVA. e, Vγ6Vδ1 transgenic mice are protected from cold exposure (Vγ6Vδ1- n=8, Vγ6Vδ1+ n=7 mice); Il17f−/− mice (f) but not Il17a−/− mice (g) are sensitive to acute cold exposure (WT littermate n=10, Il17f−/− n=10, WT littermate n=11, Il17a−/− n=13 mice). Data represent at least 2-3 independent experiments. Data are mean ± SEM and analyzed by Two-way ANOVA. h, Il17rc−/− mice are sensitive to cold exposure (n=9 mice); i, AdIl17RCKO mice are sensitive to cold exposure (WT littermate n=11, AdIl17RCKO n=9 mice). j, AdIl17RCKO mice are more obese on HFD; k, AdIl17RCKO mice have impaired glucose tolerance on HFD; l, m, AdIl17RCKO mic have increased lipid droplet deposition in BAT and liver on HFD (n=8 mice). Data represent at least 2-3 independent experiments with similar results. Data are mean ± SEM and analyzed by Two-way ANOVA.
Flow cytometry analysis revealed a significant population of γδT cells in BAT are Vγ6+ γδT cells (Extended Data Fig. 1e and f). Contrary to Tcrδ−/− mice, the Vγ6Vδ1 transgenic mice, in which Vγ6+Vδ1+ γδT cells are overrepresented16, displayed enhanced cold tolerance compared with WT littermates, providing further evidence that γδT cells promote BAT thermogenesis (Fig. 1e).
IL-17A and IL-17F are the key effector cytokines produced by Vγ6+ γδT cells17–20. Interestingly, we found cold exposure significantly induced the expression of IL-17F in BAT, whereas IL-17A expression was below detection in the same context (Extended Data Fig.1g). To further identify the functional importance of these two cytokines in BAT thermogenesis, we subjected Il17a−/− and Il17f−/− mice to acute cold challenge and found Il17f−/− but not Il17a−/− mice exhibited markedly impaired cold tolerance (Fig. 1f and g). Taken together, these data-suggest that IL-17F but not IL-17A plays a critical role in adaptive thermogenesis.
Adipocyte IL-17RC promotes thermogenesis
Two IL-17 receptors, IL-17 RA and IL-17RC, exist in mice, while IL-17RC binds only IL-17F21–24. IL-17RC is more abundantly expressed in thermogenic adipocytes at the mRNA level than IL-17RA (Extended Data Fig. 2a and b). Whole-body deficiency in IL-17RC but not IL-17RA phenocopied Il17f−/− mice in cold tolerance test (Fig. 1h and Extended Data Fig. 2c), suggesting IL-17RC is the cognate receptor for IL-17F in the context of adaptive thermogenesis.
To further dissect whether IL-17RC signaling in adipocytes contributes to thermogenesis, we generated adipocyte-specific IL-17RC knockout mice (adiponectin-cre; il17rcfl/fl, hereby named AdIl17RC KO). Upon acute cold exposure, the AdIl17RC KO mice exhibited impaired cold tolerance compared with control mice, phenocopying Rag2−/−, Tcrδ−/− and Il17f−/− mice (Fig. 1i). AdIl17RC KO also displayed higher lipid content in their BAT in comparison with control (Extended Data Fig. 2d). Importantly, restricting IL-17RC deletion to thermogenic adipocytes by using ucp1-cre;Il17rcfl/fl mice caused a similar cold-intolerant phenotype (Extended Data Fig. 2e), which further confirms that IL-17RC signaling in the UCP1-positive thermogenic adipocytes is important for adaptive thermogenesis. Furthermore, AdIl17RCKO;Vγ6Vδ1 transgenic mice phenocopied AdIl17RC KO upon cold challenge, providing further evidence that IL-17RC signaling in adipocyte is required for the thermogenesis-enhancing activity of Vγ6+Vδ1+ γδT cells (Extended Data Fig. 2f).
Defective adipose thermogenesis is often associated with susceptibility to diet-induced obesity and glucose tolerance. Indeed, when we challenged AdIl17RC KO mice with a high fat diet, they gained weights more rapidly than their WT littermates (Fig. 1j). AdIl17RC KO mice exhibited reduced oxygen consumption in comparison to their littermate controls, before the divergence in their body weights (Extended Data Fig. 2g); no significant differences in food intake or physical movements were observed (Extended Data Fig. 2h and i), suggesting the increased weight gain is caused by reduced energy expenditure. AdIl17RC KO also displayed impaired glucose tolerance, increased lipid accumulation in BAT, aggravated liver steatosis, and enlarged inguinal and epididymal WAT depots on high fat diet (Fig. 1k, l and m and Extended Data Fig. 2j and k). These metabolic phenotypes support an important role of adipocyte IL-17RC in promoting thermogenesis.
IL-17RC promotes adipose innervation
We then examined the underlying causes of the impaired adaptive thermogenesis in AdIl17RC KO mice. The decreased cold tolerance of AdIl17RC KO mice was associated with lower oxygen consumption rates compared with WT littermates (Fig. 2a). Surprisingly, we did not observe altered oxygen consumption rate in AdIl17RC KO receiving stimulation via a β3-adrenergic agonist (CL316, 243) injection (Fig. 2b); this suggests that the impaired thermogenesis of the AdIl17RC KO mice might result from deficiencies upstream of the β3-adrenergic receptor.
Figure 2. IL-17RC signaling deficiency impairs innervation in brown fat.

a, AdIl17RCKO mice have reduced oxygen consumption (VO2) after acute cold exposure by indirect calorimetry (n=8 mice). b, No significant change of oxygen consumption (VO2) after CL 316,243 injection indirect calorimetry (n=6 mice). Data are mean ± SEM and analyzed by Two-way ANOVA. c, d, Reduced sympathetic innervation of BAT in AdIl17RCKO mice by TH (c) and TUBB3 immunostaining; (d) of WT and AdIl17RCKO BAT (n=6 mice). Data represent at least 3 independent experiments with similar results e, f, Reduced sympathetic innervation of BAT in Tcrδ KO mice by TH (e) and TUBB3 (f) staining. Data represent at least 3 independent experiments with similar results g, h Increased sympathetic innervation of BAT in Vγ6Vδ1 Tg mice by TH (g) and TUBB3 (h) staining (n=6 mice). Data represent at least 3 independent experiments with similar results. i, j, Thermogenic response to CNO administration in wild-type and Il17rc-knockout mice (WT littermate n= 5, Il17rc KO n= 8 mice) (i), and wild-type and Vγ6Vδ1 Tg mice (WT littermate n=7, Vγ6Vδ1 Tg n=6 mice). (j). Scale bar=50um. Data represent at least 2-3 independent experiments with similar results. Data are mean ± SEM and analyzed by unpaired Student’s two-sided t-test and Two-way ANOVA.
Because sympathetic nerves are the major source of NE in BAT, we performed tyrosine hydroxylase (TH) and tubulin β3 (TUBB3) staining to assess sympathetic nerves in WT and AdIl17RC KO BAT. The volume and intensity of both TH and TUBB3 staining were significantly reduced in the BAT of AdIl17RC KO compared with the WT (Fig. 2c and d). These observations indicate there is both reduced growth of sympathetic axons and protein levels of TH and TUBB3 in those axons, possibly suggesting a deficiency in neurotrophic factors promoting both growth and maturation of sympathetic axons. Importantly, Tcrδ−/−, Rag2−/− and Il17f−/− but not Il17a−/− mice exhibited similarly reduced TH and TUBB3 staining in BAT (Fig. 2e, f and Extended Data Fig. 3a and b); Vγ6Vδ1 transgenic mice displayed the opposite phenotype (Fig. 2g and h). Decreased TH staining was also observed in subcutaneous fat of AdIl17RC KO mice (Extended Data Fig. 3c). These results indicate that the γδ T cell/adipocyte IL-17RC signaling pathway promotes sympathetic innervation of thermogenic adipose tissue.
To investigate whether Il17rc governs functional sympathetic innervation of BAT, we chemogenetically activated sympathetic premotor neurons and assessed the downstream BAT response using a previously established VGLUT3(Slc17a8)-ires-cre mouse model12. We crossed the VGLUT3(Slc17a8)-ires-cre mouse line25 to Il17rc KO and Vγ6Vδ1 transgenic lines and then stereotaxically injected Cre-dependent AAV-hM3Dq-mCherry into the medullary raphe region of the brain stem to drive stable expression of the transgene specifically in the VGLUT3-expressing neurons. Injection of clozapine-N-oxide (CNO), a ligand of hM3Dq but not the control vehicle to mice receiving AAV-hM3Dq-mCherry, induced c-fos expression in the medullary raphe region, thus confirming that CNO specifically activates sympathetic premotor neurons in the medullary raphe region (Extended Data Fig. 3d). We next examined BAT thermal response of Il17rc KO and transgenic mice to CNO. The response was dampened from 1.0°C in WT mice to 0.4°C in KO mice but enhanced from 0.9°C in control mice to 1.6°C in transgenic mice (Fig. 2i and j). Taken together, these findings strongly suggest that ablation of Il17rc impairs functional sympathetic innervation of thermogenic adipose tissue, whereas over-representation of Vγ6+Vδ1+ γδT cells has the opposite effect.
In support of the notion that the thermogenic defect in the AdIl17RC KO mice is caused by impaired adipose innervation, we found that the cold intolerance of the AdIl17RC KO mice could be rescued by enhancing the fat-specific neurotrophic pathway of CLSTN3β/S100B12. Specifically, forced expression of S100b or Clstn3β in BAT of AdIl17RC KO mice led to reduced lipid accumulation in BAT, enhanced cold tolerance, and increased BAT innervation compared with controls (Extended Data Fig. 3e–g for S100b-AAV and h–j for Clstn3β-AAV).
IL-17RC in innervation of other tissues
IL-17RC is widely expressed in multiple murine tissues. This prompted us to ask whether the IL-17F/IL-17C pathway represents a neurotrophic mechanism generally implicated in additional tissues. Indeed, we observed decreased TH and TUBB3 volume and intensity in the salivary gland of Il17rc−/−, Tcrδ−/−, Rag2−/−, Il17f−/− mice but not Il17a−/− mice, and in lung bronchi of Il17rc−/−, Tcrδ−/− and Rag2−/− mice (Extended Data Fig.3 k–m and o). In contrast, no reduction in TH and TUBB3 staining was observed in the salivary gland of the AdIl17RC KO mice (Extended Data Fig. 3n). Taken together, these data strongly suggest that the γδT cell/IL-17RC pathway contributes to sympathetic innervation in multiple tissues.
IL-17RC promotes TGFβ1 expression
To understand mechanistically how the IL-17F/IL-17RC pathway promotes sympathetic innervation, we analyzed the proteomic and transcriptomic profiles of WT and AdIl17RC KO BAT by protein mass-spectrometry and RNA-seq respectively (Fig. 3a and b). Pathway enrichment analysis of genes downregulated both at the RNA and the protein level in the KO compared with controls revealed the Epithelial Mesenchymal Transition and the TGFβ signaling pathways (Extended Data Fig. 4a). We confirmed the downregulation of a set of collagen genes (Col1a1, Col3a1, and Col5a1), (known targets of TGFβ), and TGFβ1 itself in the AdIl17RC KO BAT by qPCR (Fig. 3a, b and Extended Data Fig. 4b). IL-17F has been shown to drive TGFβ1 expression in endothelial cells26. Here we observed reduced TGFβ1 expression in the adipocytes from AdIl17RC KO BAT (Fig. 3c), suggesting IL-17F is also important to drive TGFβ1 expression in adipocytes. Furthermore, reduced Tgfb1 expression was observed in the salivary gland and lung of Il17rc−/− mice, as well as in the BAT, salivary gland and lung of Rag2−/−, Tcrδ−/− and Il17f−/− mice (Extended Data Figure 4c–e). Taken together, these results showed that ablation of the IL-17F/IL-17RC pathway leads to downregulated expression of TGFβ1 in multiple tissues.
Figure 3. IL-17RC promotes sympathetic innervation in BAT through TGFβ1 signaling.

a, b, Reduced TGFβ1 and Col1a1, Col1a2, Col3a1, Col5a1, Col5a3 and Ncor2 protein expression (a) (n=5 mice) and RNA (b) (n=3 mice) in AdIl17RCKO BAT. Data are analyzed by unpaired Student’s two-sided t-test and as described in the method section c, Reduced TGFβ1 mRNA in isolated mature adipocytes from AdIl17RCKO BAT (n=3 mice). Data are mean ± SEM and analyzed by One-way ANOVA and Bonferroni’s multiple comparisons test. d, Forced expression of TGFβ1 by TGFβ1-DIO-AAV rescues the cold sensitivity in AdIl17RCKO mice (n=6 mice). e, f, Forced expression of TGFβ1 by TGFβ1-DIO-AAV increases adipose innervation in AdIl17RCKO mice by TH(e) and TUBB3 (f) staining (n=6 mice). scale bar=50um. Data represent 2-3 independent experiments. Data are mean ± SEM and analyzed by unpaired Student’s two-sided t-test and Two-way ANOVA.
TGFβ1 promotes sympathetic innervation
Previous studies have shown TGFβ possesses neurotrophic activity in certain contexts27,28. We therefore hypothesized that downregulation of TGFβ1 signaling might explain, at least in part, the defective sympathetic innervation in multiple tissues as a result of IL-17RC ablation. To test this idea, we examined whether forced expression of TGFβ1 is sufficient to alleviate the defect in BAT sympathetic innervation and thermogenesis of AdIl17RC KO mice. Indeed, restoration of TGFβ1 expression specifically in brown adipocytes of AdIl17RC KO mice lead to strongly reduced lipid accumulation, increased TH/TUBB3 staining in BAT, and enhanced cold tolerance compared with controls (Fig. 3d–f and Extended Data Fig. 5a). Consistent with this, blocking TGFβ signaling with a neutralizing antibody or a small-molecule inhibitor sensitized WT mice to cold exposure (Extended Data Fig. 5b and c). Furthermore, AAV-driven expression of TGFβ1 also increased TH/TUBB3 staining in salivary gland of Il17rc KO and Rag2 KO mice. (Extended Data Fig. 5d–g). Taken together, these results support the idea that the IL-17F/IL-17RC pathway plays a critical role in promoting sympathetic innervation. At least a substantial part of this appears to be through the TGFβ1 signaling pathway.
Discussion
Sympathetic innervation of peripheral organs regulates their function and maintains homeostasis. These nerves are, in turn, also under influence of factors produced by the target cells of innervation. The molecular basis of this important bi-directional communication remains to be fully elucidated. By using thermogenic adipose tissue as a model system, we show that T cells, through an axis defined by γδ T cells and IL-17RC, plays a critical role in promoting sympathetic innervation, at least in part through driving TGFβ1 expression in parenchymal cells. Our conclusion is supported by highly consistent phenotypes across a comprehensive set of mouse genetics models, including Rag2−/−, Tcrδ−/−, IL-17F−/−, global and tissue-specific IL-17RC KO. γδ T cells have been previously linked to body temperature control through IL-17A29; however, our data clearly showed that IL-17F deficiency, but not IL-17A deficiency, caused a profound defect in BAT thermogenesis. Consistent with this finding are the phenotypes displayed by adipose-specific KO of IL-17RC, which binds and is activated by only IL-17F but not IL-17A in mice. More importantly, our findings demonstrate the γδ T cells /IL-17RC/TGFβ1 axis as a critical mechanism involved in the sympathetic innervation of multiple tissues. Moving forward, it will be interesting to see whether the human γδT cell compartment and IL-17RC signaling plays an important role in the sympathetic innervation.
TGFβ1 plays an important role in multiple aspects of central nervous system development and function28. Although TGFβ1 is reported to be involved in peripheral nerve repair, its role in the peripheral nervous system development and function has not been extensively explored30. Our data support a critical role of IL-17F-driven TGFβ1 signaling in controlling sympathetic innervation in multiple peripheral tissues. Our observations that viral or pharmacological intervention in the TGFβ1 pathway could modulate sympathetic innervation in adult mice suggest that TGFβ1 could dynamically regulate the growth and maturation level of sympathetic nerves in a post-developmental manner. This mode of action is rather distinct from known target-derived neurotrophic factors, such as NGF, and may therefore reveal a new mechanism of crosstalk between sympathetic nerves and end-organs. The direct target and molecular mechanism of TGFβ1’s effect on sympathetic nerves are unclear at this stage; TGFβ1 may act directly on neuronal receptors, or indirectly via remodeling the extracellular matrix or modulating the abundance/activity of additional neurotrophic factors. Further investigation is required to distinguish between these possibilities.
In summary, our data uncovered an unexpected immuno-regulatory mechanism of sympathetic innervation in multiple tissues, including thermogenic adipose tissue, and might provide a therapeutic opportunity of promoting thermogenic fat activity for treating obesity and associated metabolic disorders.
Methods
Mouse
Rag2−/− mice (008449), Tcrδ−/− mice (002120), muMT−/− mice (002288), Tcrα−/− mice (002116), Il17a−/− mice (016879) were from Jackson Lab. Il17f−/− mice were from Dr. Sarah L. Gaffen and Dr.Yoichiro Iwakura’s lab, Il17rc−/− and Il17ra−/− were from Amgen, Il17RCflox/flox mice were from Dr. Jay K. Kolls’ lab31. Vγ6Vδ1 Tg mice were from Dr. Diane Mathis’ lab. Adiponectin Cre mice (028020) and UCP1 Cre mice (024670) were from Jackson lab32. VGLUT3-ires-Cre mice were from Dr. Bradford Lowell’s lab33. TGFβ antibody (Bioxcell # BE0057 Clone 1D11.16.8) and Isotype control antibody (Bioxcell # BE0083) were i.p. injected to WT B6 mice for 3 weeks at 10mg/kg 3 times a week. sb431542 was i.p. injected to WT B6 mice at 4.2mg/kg/day for 3 weeks. All animal studies were approved by the Institutional Animal Care and Use Committee of Beth Israel Deaconess Medical Center.
Cold tolerance assay
Mice were pre-acclimated at thermoneutrality (28-30°C) for 1wk and then shifted to 4°C. Body temperature was measured with a rectal probe (Physitemp, RET3) and a reader (Physitemp, BAT-12) and implanted temperature probes (Bio Medic Data Systems, IPTT-300) with a transponder (Bio Medic Data Systems, DAS-7007R)34,35.
Whole-mount immunofluorescence
Th whole-mount immunostaining of subcutaneous inguinal WAT was performed as described in Chi et al14.
Cryo-section immunostaining
Tissue was harvested immediately after euthanizing mice and fixed with 4% paraformaldehyde overnight. Tissue was then washed with PBS for 5 times, 10 min each and incubated in PBS/30% sucrose for 8 h and then frozen in Tissue-Tek O.C.T. Compound (Sakura Finetek, 4583). Frozen tissue was cut into 30 μm sections on a Leica CM3050 S cryostat. Sections were briefly rinsed with PBS and blocked with PBS/0.3% Triton X-100/5% FBS overnight. Sections were then stained with Th antibody (AB1542, EMD Millipore, 1:200) and Tubb3 antibody (ab52623, Abcam, 1:200) for 2 days. Sections were washed with PBS/0.03% Triton X-100/5% FBS for 5 times, 1 h each and then stained with anti-sheep Alexa Fluor 488, anti-sheep Alexa Fluor 568, anti-sheep Alexa Fluor 647 (Thermo Fisher, A-11015, A-21099 and A-21448,1:500) and anti-rabbit Alexa Fluor 647 (Thermo Fisher, A-21245, 1:500) for 2 days. Sections were washed with PBS/0.3% Triton X-100/5% FBS for 5 times, 1 h each and then mounted in ProLong Diamond Antifade Mountant (Thermo Fisher, P36965). Images were taken on a Nikon A1R point scanning confocal microscope.
Image analysis
For each animal, at least six sections of adipose tissues were imaged and analyzed. Images were imported to Imaris (Bitplane) and surface renderings of Th or Tubb3 fluorescence were generated using the “surface” function. Signals on and around blood vessels were manually selected and removed from the final quantifications. Volume measurements of Th/Tubb3 signals were normalized to the volume of the imaging field. In each experiment, the function parameters were kept the same between genotypes.
Flow cytometry
BAT were collected, cut into small pieces, and digested with collagenase II (Sigma) and DNase I for 30 minutes at 37°C. Dissociated tissues was then filtered with a 100 μm cell strainer. Spleen and lymph node samples were grinded up and passed through a 70 μm cell strainer. After blocking FcgRIII/II with an anti-CD16/CD32 mAb (eBioscience), single cell suspensions were stained with the following antibodies: CD45.2 (104), TCRβ (H57-597), TCRγδ (GL3), CD3(17A2), IL-17F (9D3.1C8), CD27 (LG.3A10), purchased from eBioscience, BD or Biolegend. Biotinylated antiamphiregulin antibody was purchased from R&D Systems. For staining of the Vγ6Vδ1+ TCR, cells were labeled first with the anti-TCRγδ mAb (GL3), and then incubated with the supernatant from the 17D1 hybridoma followed by staining with the goat-anti-rat IgM (Jackson Immunoresearch Laboratories) secondary antibody as previously described36. Flow cytometry was performed on the LSR II or LSRFortessa (BD), and data were analyzed by the FlowJo software (Treestar).
Mass spectrometry analysis
Quantitative whole tissue proteomics analysis was performed as below.
Protein Digestion and Isobaric Labeling
Protein elutions were precipitated in 20 % trichloroacetic acid on ice overnight, spun for 30 minutes at 15,000 RPM and washed three times with 500 μL of HPLC grade acetone. Protein pellets were further dried under vacuum centrifugation until they were completely dried. Pellets were resuspended in 8 M urea containing 50 mM HEPES, pH 8.5(75 μL), diluted to 4 M urea and digested with 1 μg of LysC (Wako) overnight at room temperature. Digests were diluted further to a 1.5 M urea concentration and 0.5 μg of trypsin (Promega) for 6 hours at 37 °C. Digests were acidified with 5 μL of 20% formic acid (FA) to a pH ~2 and were subsequently desalted by C18 StageTips (3M Empore).
Digested elutions were resuspended in 25 μL of 200 mM HEPES, pH 8.5. The TMT6 reagents (Thermo Fisher) (0.8 mgs) were dissolved in 40 μL of dry acetonitrile (ACN), and 2 μL of the solution was added to each tube. After incubating for 1 h at room temperature (23 °C), the reaction was quenched by adding 2 μL of 5% w/v hydroxylamine. Labeled peptides, were combined and subsequently desalted by C18 StageTips prior to injection onto the mass spectrometer.
BAT tissue was extracted and snap frozen in liquid N2 until further use. BAT tissues were lysed with 3 mL SDS lysis buffer (2.0 % SDS w/v, 200 mM NaCl, 5 mM DTT, EDTA free protease inhibitor cocktail (Promega) and 50 mM HEPES, pH 8.5) using an Omni tissue homogenizer. Extracts were reduced with at 57 °C for 30 minutes and cysteine residues alkylated with iodoacetamide (14 mM) in the dark (45 min). Extracts were purified by methanol/chloroform precipitation and pellets were washed with ice cold acetone. Pellets were resuspended in 8 M urea containing 50 mM HEPES, pH 8.5, and protein concentrations were measured by BCA assay (Thermo Scientific) prior to protease digestion. 200 μg of protein was diluted to 4 M urea and digested overnight with 5 μg LysC (Wako). Digests were diluted further to a 1.5 M urea concentration and 5 μg of trypsin (Promega) was added for 6 hours at 37 °C. Digests were acidified with 50 μL of 20% formic acid (FA) and subsequently desalted by C18 solid-phase extraction (SPE) (50 mg, Sep-Pak, Waters). Digested BAT peptides were resuspended in 100 μL of 200 mM HEPES, pH 8.5. Ten μL of TMT6 reagents was added to each solution for 1 h at room temperature (23 °C). After incubating, the reaction was quenched by adding 4 μL of 5% w/v hydroxylamine. Labeled peptides, were combined and subsequently desalted by C18 solid-phase extraction (SPE) (50 mg, Sep-Pak, Waters) prior to basic pH reversed-phase separation (bpHrp).
Basic pH reversed-phase separation (bpHrp)
TMT labeled peptides were solubilized in 500 μL solution containing 5% ACN/10 mM ammonium bicarbonate, pH 8.0 and separated by an Agilent 300 Extend C18 column (5 mm particles, 4.6 mm ID and 220 mm in length). An Agilent 1100 binary pump coupled with a photodiode array (PDA) detector (Thermo Scientific) was used to separate the peptides. A 40 minute linear gradient from 20% to 40% acetonitrile in 10 mM ammonium bicarbonate pH 8 (flow rate of 0.8 mL/min) separated the peptide mixtures into a total of 96 fractions (33 seconds). A total of 96 Fractions were consolidated into 12 samples in a checkerboard fashion, acidified with 20 μL of 20% formic acid and vacuum dried to completion. Each sample was re-dissolved in 5% FA/5% ACN, desalted via StageTips prior to LC-MS/MS analysis.
Liquid chromatography and tandem mass spectrometry (LC-MS/MS)
All LC-MS/MS experiments were performed on an LTQ Orbitrap Fusion (Thermo Fisher) coupled with Agilent 1200 binary HPLC pump (Agilent Technologies) and a Famos auto sampler (LC Packings). Peptides were separated onto an 75 μm I.D. microcapillary column packed first with ~1 cm of Magic C4 resin (5 μm, 100 Å, Michrom Bioresources) followed by ~20 cm of Maccel C18AQ resin (3 μm , 200 Å, Nest Group). Peptides were separated by applying a gradient from 10 to 25% ACN in 0.125% FA over 180 min at ~250 nL/min. Electrospray ionization was enabled through applying a voltage of 1.8 kV using an inert gold electrode.
The instrument was operated in data-dependent mode with a 60 s (+/− 10 ppm window) expiration time, FTMS1 spectra collection at 120,000 resolution, an AGC target of 500,000 and a max injection time of 200 ms. The ten most intense ions were selected for MS2 fragmentation and precursors were filtered according to charge state (required >1 z). Isolation width was set at 0.7 m/z. ITMS2 spectra were collected at an AGC of 18,000, max injection time of 120 ms and CID collision energy of 35%. For the FTMS3 acquisition, the Orbitrap was operated at 30,000 resolution with an AGC target of 50,000. The max injection time was set to 250 ms incorporating an HCD collision energy of 55%. Synchronous-precursor-selection (SPS) was enabled to include up to 10 MS2 fragment ions in the FTMS3 spectra.
MS data processing and spectra assignment
A compendium of in-house developed software was used to convert acquired mass spectrometric data from the .RAW file to the mzxml format. Erroneous assignments of peptide ion charge state and monoisotopic m/z were also corrected by the software. The Sequest algorithm was used to assign MS2 spectra by searching the data against a protein sequence database including Mouse Uniprot Database (download date June, 2013) and known contaminants such as porcine trypsin and human keratins. A forward (target) database component was followed by a decoy component including all listed protein sequences. Searches were performed using a 30 ppm precursor ion tolerance and requiring both peptide termini to be consistent with trypsin specificity. Six-plex TMT labels on lysine residues and peptide N termini (+ 229.16293 Da) were set as static modifications and oxidation of methionine residues (+ 15.99492 Da) as a variable modification. An MS2 spectra assignment false discovery rate (FDR) of less than 1% was achieved by applying the target-decoy database search strategy37. Filtering was performed using a linear discrimination analysis method to create one combined filter parameter from the following peptide ion and MS2 spectra properties: XCorr and ΔCn, peptide ion mass accuracy, and peptide length. Linear discrimination scores were used to assign probabilities to each MS2 spectrum for being assigned correctly and these probabilities were further used to filter the dataset with an MS2 spectra assignment FDR to obtain a protein identification FDR of less than 1 %38.
Determination of TMT reporter ion intensities
For reporter ion quantification, a 0.03 m/z window centered on the theoretical m/z value of each reporter ion was monitored for ions, and the maximum intensity of the signal to the theoretical m/z value was recorded. Reporter ion intensities were de-normalized by multiplication with the ion accumulation time for each MS2 or MS3 spectrum and adjusted based on the overlap of isotopic envelopes of all reporter ions. Following reporter ion signal extraction, the isotopic impurities of the TMT reagent were corrected using the values specified by the manufacturer. Total signal to noise values for all peptides were summed for each TMT channel and all values were adjusted to account for variance. For each identified peptide, a total minimum signal to noise value of 100 was implemented.
RNAseq library preparation and sequencing
Libraries were prepared using Illumina TruSeq stranded mRNAseq kit from 500ng of purified total RNA according to the manufacturer’s protocol. The finished dsDNA libraries were quantified by Qubit fluorometer, Agilent TapeStation 2200, and RT-qPCR using the Kapa Biosystems library quantification kit according to manufacturer’s protocols. Uniquely indexed libraries were pooled in equimolar ratios and sequenced on an Illumina NextSeq500 with single-end 75bp reads by the Dana-Farber Cancer Institute Molecular Biology Core Facilities.
RNAseq Analysis
Sequenced reads were aligned to the UCSC mm9 reference genome assembly and gene counts were quantified using STAR (v2.5.1b)39. Differential gene expression testing was performed by DESeq2 (v1.10.1)40 and normalized read counts (FPKM) were calculated using cufflinks (v2.2.1)41. RNAseq analysis was performed using the VIPER snakemake pipeline42.
Indirect Calorimetry
Animals were housed individually in metabolic chambers under a 12 hr light/dark cycle with free access to food and water. Whole body metabolic rate was measured using the Oxymax open-circuit indirect calorimeter, Comprehensive Lab Animal Monitoring System (CLAMS, Columbus Instruments). Cold exposure or CL 316,243 (Sigma-Aldrich; 1 mgkg−1) i.p. injection into mice started at the indicated time.
Electromyography (EMG)
Mice were individually restrained to limit non-shivering muscle activity and two EMG needle electrodes were inserted subcutaneously above the nuchal muscles in the back of the neck. EMG leads were connected to a computerized data acquisition system via a communicator. EMG data were collected and burst activity was determined as described previously43. Briefly, EMG data were collected from the implanted electrodes at a sampling rate of 2 kHz using LabChart 8 Pro Software (ADInstruments). The raw signal was converted to root mean square activity. Root mean square activity was analysed for shivering bursts in 10 s windows.
AAV injection
Six-week old male mice were anesthetized with isoflurane and an incision was made above the interscapular area to expose the underlying adipose tissue. About 3*10^11 AAV particles were injected into each BAT lobe and the incision was closed with suture. Mice received one injection of meloxicam (2 mg/kg) 24 h before surgery and another injection immediately after surgery. Mice were allowed to recover for 3 weeks before analysis. AAV8-Tgfb1, AAV8-DIO-TGFβ1, AAV8-S100b and AAV8-DIO-Clstn3β were packaged at the Boston Children’s Hospital ViralCore.
Stereotaxic surgery and viral injections
For viral injections into the medullary raphe, six- to eight-week-old male VGLUT3-ires-Cre+ mice were anesthetized with a ketamine (100 mg kg-1) and xylazine (10 mg kg−1) cocktail diluted in 0.9% saline and placed into a stereotaxic apparatus (David Kopf model 940). An incision was made to expose the skull and a small hole was drilled 5.9 mm posterior and 0 mm medial/lateral from bregma. A pulled glass micropipette (20-40 μm diameter tip) was used for stereotaxic injections of adeno-associated virus (AAV). Three injections, 6.0 mm ventral to bregma, at medial/lateral −0.15 mm, 0 mm, and +0.15 mm were used to target the medullary raphe. Virus was injected (15 nl per injection) by an air pressure system using picoliter air puffs through a solenoid valve (Clippard EV 24VDC) pulsed by a Grass S48 stimulator to control injection speed (20 nl min−1). The pipette was removed 1 minute after each injection and, upon completion of the final injection, the incision was closed using Vetbond tissue adhesive (3M). Subcutaneous injection of sustained release Meloxicam (4 mg kg−1) was provided as postoperative care. Chemogenetic experiments utilized AAV8-hSyn-DIO-hM3Dq-mCherry packaged at the Boston Children’s Hospital Viral Core (Addgene plasmid 44361; donating investigator, Dr. Bryan Roth). Animals were allowed to recover from stereotaxic surgery a minimum of 21 days prior to initiation of any experiments. Following each experimental procedure, accuracy of AAV injections was confirmed via post-hoc histological analysis of mCherry fluorescent protein reporters. All subjects determined to be surgical “misses” based on little or absent reporter expression were removed from analyses.
Histology
Mice were terminally anesthetized with 7% choral hydrate (500 mg kg−1; Sigma Aldrich) diluted in saline and transcardially perfused first with 0.1 M phosphate-buffered saline (PBS) then 10% neutral-buffered formalin solution (NBF; Thermo Fisher Scientific). Brains were extracted and post-fixed overnight at 4° C in NBF. The next day brains were switched to PBS containing 20% sucrose for cryoprotection. Finally, brains were sectioned coronally at 30 μm on a freezing microtome (Leica Biosystems), and stored in cryoprotectant solution at −20° C until used for immunofluorescence. For immunofluorescence, Brain tissue sections were washed 3X in PBS prior to a blocking step containing 3% normal donkey serum and 0.4% Triton X-100 in PBS for one hour at room temperature. Primary antibody was prepared in the same blocking solution and incubated overnight at the following concentrations: Rat anti-mCherry (Life Technologies - M11217) 1:3,000, Rabbit anti- c-Fos (EMD Millipore - ABE457) 1:3,000. The next day sections were washed 5X in PBS, then incubated for 2 hours at room temperature in Alexa Fluor fluorescent secondary antibody (Life Technologies; 1:1,000) prepared in blocking solution. Finally, sections were washed 3X in PBS, mounted on gelatin-coated slides, and coverslipped with Vectashield mounting media containing DAPI (Vector Labs). Fluorescent images were captured using an Olympus VS120 slide-scanning microscope.
Chemogenetic activation of BAT assay
To monitor BAT response in real time, temperature probes (Bio Medic Data Systems, IPTT-300) were implanted into the interscapular region of mice and temperature was read with a transponder (Bio Medic Data Systems, DAS-7007R). To activate sympathetic neurons, mice were i.p. injected with saline or Clozapine N-oxide (Sigma, C0832) at 1 mg/kg.
Quantitative PCR
The following primers were used for qPCR analysis of gene expression: TGFβ1-fwd,CCTGTCCAAACTAAGGC; rev,GGTTTTCTCATAGATGGCG; Ncor2 fwd ACTGCCGCCCCTAAACGCAC; rev GGACCTCGGGATGCCTTGCG; Col1a1 F TAG GCC ATT GTG TAT GCA GC; Col1a1 R: ACA TGT TCA GCT TTG TGG ACC; Col3a1 F: TAG GAC TGA CCA AGG TGG CT; Col3a1 R: GGA ACC TGG TTT CTT CTC ACC; Col5a1 F: AAG CGT GGG AAA CTG CTC TCC TAT; Col5a1 R: AGC AGT TGT AGG TGA CGT TCT GGT; IL17F-F: CTG GAG GAT AAC ACT GTG AGA GT; IL17F-R: TGC TGA ATG GCG ACG GAG TTC; Il17A F: CTC CAG AAG GCC CTC AGA CTA C; Il17A R: AGC TTT CCC TCC GCA TTG ACA CAG; Actb F: GGTCCACACCCGCCACCA; R: CACATGCCGGAGCCGTTGTC; Cyclophilin F: F:GGAGATGGCACAGGAGGAA; R:GCCCGTAGTGCTTCAGCTT; Primers for other genes were described previously44.
Data reporting
No statistical methods were used to predetermine sample size. The experiments were not randomized and the investigators were not blinded to allocation during experiments and outcome assessment.
Extended Data
Extended Data Fig. 1.

γδT cells promote adaptive thermogenesis.
a, Reduced oxygen consumption (VO2) of Tcrδ−/− mice during cold exposure measured by indirect calorimetry (n=9 mice). Data are mean ± SEM and analyzed by Two-way ANOVA. b, Increased lipid accumulation in the BAT of Tcrδ−/− mice (H&E histology), scale bar=100um. Data represent at least 2-3 independent experiments with similar results. c, No significant difference of food intake and physical movement in WT and Tcrδ KO mice by indirect calorimetry (n=9 mice). d, No significant change of EMG RMS muscle activity in WT and Tcrδ KO mice during cold exposure (n=4 mice). e, A significant population of γδT cells in BAT are Vγ6Vδ1+ (n=6 mice). f, Flow cytometry analysis of γδ Τ cells in BAT. g, cold exposure (6hr) upregulate IL-17F mRNA in BAT (n=5 mice). Data represent at least 2-3 independent experiments with similar results. Data are mean ± SEM and analyzed by unpaired Student’s two-sided t-test and Two-way ANOVA
Extended Data Fig. 2.

IL-17RC deficiency predispose mice to cold sensitivity and obesity.
a, b, Il17rc mRNA expression level shown by translating ribosomal affinity purification (TRAP) from (a) ADIPONECTIN positive cells (ADIPONECTIN-TRAP) (n=3 mice)and (b) UCP1-positive cells (UCP1-TRAP, BAT) (BAT, iWAT n=3 mice; eWAT n=2 mice); c, Il17ra−/− mice are not sensitive to cold exposure (WT n=13, Il17ra−/−n=10 mice). d, Increased lipid accumulation in the BAT of AdIl17RCKO mice (H&E histology), scale bar =100um. Data represent at least 2-3 independent experiments with similar results. e, UCP1-Cre;Il17rcfl/fl KO mice are sensitive to acute cold exposure (WT n=7, UCP1-Cre;Il17rcfl/fl KO n=6 mice). f, AdIl17RCKO;Vγ6Vδ1 transgenic mice are sensitive to acute cold exposure (WT n=8; AdIl17RCKO;Vγ6Vδ1, AdIl17RCKO n=5 mice). g, Decreased high fat diet-induced oxygen consumption (VO2) by indirect calorimetry (2wks after the start of high fat diet feeding) (n=8 mice). h, i, Physical movement (X-total counts) and food intake are not different in WT and AdIl17RCKO mice (n=8). j, k, iWAT (j) and eWAT (k)H&E histology of HFD treated WT and AdIl17RCKO mice (n=8 mice). Scale bar =50um. Data represent at least 2-3 independent experiments with similar results. Data are mean ± SEM and analyzed by unpaired Student’s two-sided t-test and Two-way ANOVA.
Extended Data Fig. 3.
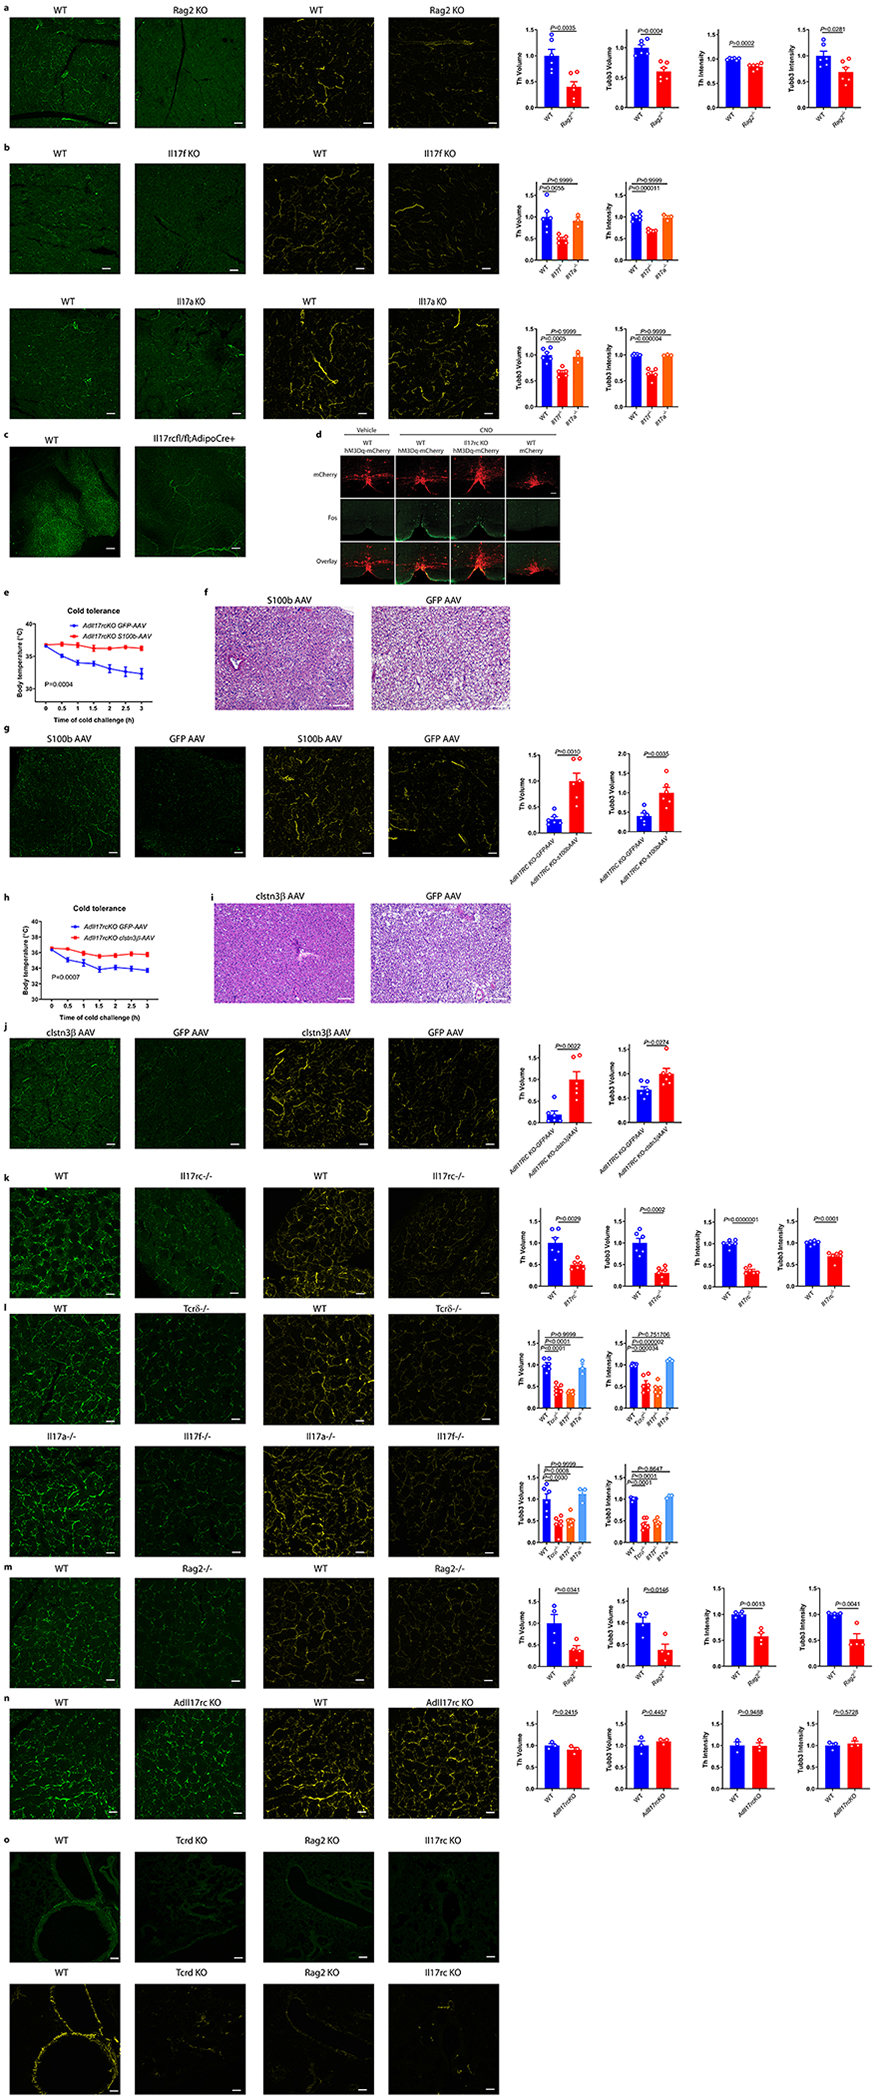
IL-17RC signaling deficiency impairs sympathetic innervation in adipose and multiple tissue
a, Reduced sympathetic innervation of BAT in Rag2 KO mice by TH (green) and tubb3 (yellow) staining (n=6 mice). b, Reduced sympathetic innervation of BAT in Il17f−/− but not Il17a−/− mice by TH (green) and tubb3 (yellow) staining (WT n=6, Il17f−/− n=5, Il17a−/− n=3 mice). Data are mean ± SEM and analyzed by One-way ANOVA and Bonferroni’s multiple comparisons test. Scale bar=50um. c, Reduced sympathetic innervation of iWAT in AdIl17RCKO mice by TH staining (n=6 mice). Scale bar=100um. d, FOS immunoreactivity and thermogenic response to CNO administration. Scale bars, 100 μm. Data represent 2-3 independent experiments with similar results. e, Forced expression of S100b by s100b-AAV rescues the cold sensitivity in AdIl17RCKO mice (n=5 mice). f, Decreased lipid accumulation in the s100b-AAV treated BAT (H&E histology). Data represent 2 independent experiments with similar results. g, Forced expression of S100b by s100b-AAV increases adipose innervation in AdIl17RCKO mice by TH (green) and TUBB3 (yellow) staining (n=6 mice). h, Forced expression of Clstn3β by clstn3β-DIO-AAV rescues the cold sensitivity in AdIl17RCKO mice (n=5 mice). i, Decreased lipid accumulation in the clstn3β-AAV treated BAT (H&E histology), scale bar =100um. j, Forced expression of clstn3β by clstn3β-DIO-AAV increases adipose innervation in AdIl17RCKO mice by TH (green) and TUBB3 (yellow) staining (n=6 mice). scale bar=50um. Data represent 2 independent experiments with similar results. k, Reduced sympathetic innervation of salivary glands (SG) in Il17rc KO mice by TH staining (green) and TUBB3 immunostaining (yellow) of WT and Il17rc KO SG (n=6 mice). l, Reduced sympathetic innervation of SG in Tcrδ KO, Il17f KO but not Il17a KO mice by TH (green) and TUBB3 (yellow) staining (WT n=6, Tcrδ KO n=6, Il17f KO n=6, Il17a KO n=3 mice). Data are mean ± SEM and analyzed by One-way ANOVA and Bonferroni’s multiple comparisons test. m, Reduced neuronal innervation of SG in Rag2 KO mice by TH (green) and TUBB3 (yellow) staining. (n=4 mice). n, No significant difference of sympathetic innervation of SG in AdIl17rcKO mice by TH (green) and TUBB3 (yellow) staining (n=3 mice). Scale bar=50um. Data represent at least 2-3 independent experiments. Data are mean ± SEM and analyzed by unpaired Student’s two-sided t-test and Two-way ANOVA. o, Reduced sympathetic innervation of bronchi in Rag2−/− and Tcrδ−/− mice by TH and TUBB3 staining (WT n=8, Rag2 KO n=3, Tcrδ KO n=4, Il17rc KO n=3 mice). Data represent at least 2 independent experiments with similar results. Scale bar=50um. Data are mean ± SEM and analyzed by unpaired Student’s two-sided t-test and Two-way ANOVA.
Extended Data Fig. 4.

Reduced Tgfb1 and collagen genes in AdIl17rcKO mice
a, Pathway enrichment analysis of genes downregulated both at the RNA and the protein level in the AdIl17RCKO BAT compared with littermate controls. b, Reduced TGFβ1, Col1a1, Col3a1, Col5a1 and Ncor2 mRNA expression in BAT of AdIl17rcKO mice (n=3 mice). Data represent at least 2-3 independent experiments. c, d, e, Reduced TGFβ1 mRNA expression in BAT, SG and Lung of Il17rc KO, Tcrδ KO, Il17f KO and Rag2 KO mice (BAT (WT n=7, Il17rc KO n=6; WT n=5, Tcrδ KO n=6, Il17f KO n=6; WT, Rag2 KO n=4 mice); SG (WT n=4, Il17rc KO n=4; WT, Tcrδ KO, Il17f KO n=3; WT, Rag2 KO n=3 mice); Lung (WT n=5, Il17rc KO n=4; WT n=6, Tcrδ KO n=4, Il17f KO n=6; WT, Rag2 KO n=6 mice)). Data are mean ± SEM and analyzed by unpaired Student’s two-sided t-test, One-way ANOVA and Bonferroni’s multiple comparisons test.
Extended Data Fig. 5.

TGFβ blocking sensitize mice to acute cold exposure
a, Decreased lipid accumulation in the TGFβ1-AAV treated BAT (H&E histology). Data represent 2 independent experiments with similar results. b, WT mice treated with TGFβ neutralizing antibody for 3 weeks are sensitive to cold exposure(n=6 mice). c, WT mice treated with TGFβ inhibitor for 3 weeks are sensitive to cold exposure(n=8). d, e, Forced expression of TGFβ1-AAV increases the SG TH (d) and TUBB3 (e) immuno-staining in Il17rc KO mice (n=6 mice). f, g, Forced expression of TGFβ1-AAV increases SG TH and TUBB3 immuno-staining in Rag2 KO mice by TH(f) and TUBB3 (g) staining (n=6 mice). scale bar=50um. Data represent 2-3 independent experiments. Data are mean ± SEM and analyzed by unpaired Student’s two-sided t-test and Two-way ANOVA.
Acknowledgements
We thank Marie L. Mather from Dr. Eleftheria Maratos-Flier’s lab, Dr. Eleftheria Maratos-Flier, Ryan Garrity, and Zhaoming Deng, Amir Mina and Dimitrije Cabarkapa from Alex Banks’ lab for help with CLAMS studies. We thank Dr. Sarah L. Gaffen and Dr.Yoichiro Iwakura for sharing the IL-17F−/− mice, Dr. Jay K. Kolls for the IL-17RCflox/flox mice, Amgen for the IL-17RC−/− and IL-17RA−/− mice. We thank Alexander Mann, Natasha Asinovski and Kimie Hattori for the Vγ6Vδ1 Tg mice and 17D1 antibody. We thank Chen Zhao for help with the immunofluorescence staining and confocal imaging analysis. We thank Lawrence Kazak and Edward T Chounchani for help with EMG study. We thank Dr. Rosemary J. Akhurst and Sugandha Basu for sharing mice. We thank Nikon Imaging Center at Harvard Medical School for all imaging studies; the Rodent Histology Core at Harvard Medical School for histology studies; the viral core at Children’s Hospital Boston for AAV production; we thank the Neurobiology Department and the Neurobiology Imaging Facility for consultation and instrument availability that supported this work. This facility is supported in part by the Neural Imaging Center as part of an NINDS P30 Core Center grant #NS072030. We thank Zach Herbert, Andrew Caruso and members from the Molecular Biology Core Facilities at the Dana-Farber Cancer Institute for RNAseq analysis. We thank Yi, Dina and all members of the Spiegelman lab, and people form Dr. Mathis’ lab for help and input in this project. Bo Hu is a Cancer Research Institute/Leonard Kahn Foundation Fellow. C.J. is supported by a K99 Award (CA226400) from the National Cancer Institute (NCI). This work was supported by grants to B.M.S. from the NIH DK 31405 and from the JPB Foundation
Footnotes
Competing interests
The authors declare no competing interests.
Statistics and reproducibility
All experiments have been successfully repeated with similar results for at least two to three times.
Data Availability Statements
Any relevant data are available from the corresponding author upon reasonable request.
Reference
- 1.McCorry LK Physiology of the autonomic nervous system. Am J Pharm Educ 71, 78, doi: 10.5688/aj710478 (2007). [DOI] [PMC free article] [PubMed] [Google Scholar]
- 2.Mattson MP & Wan R Neurotrophic factors in autonomic nervous system plasticity and dysfunction. Neuromolecular Med 10, 157–168, doi: 10.1007/s12017-007-8021-y (2008). [DOI] [PubMed] [Google Scholar]
- 3.Furlan A et al. Visceral motor neuron diversity delineates a cellular basis for nipple- and pilo-erection muscle control. Nat Neurosci 19, 1331–1340, doi: 10.1038/nn.4376 (2016). [DOI] [PubMed] [Google Scholar]
- 4.Morrison SF Central neural control of thermoregulation and brown adipose tissue. Auton Neurosci 196, 14–24, doi: 10.1016/j.autneu.2016.02.010 (2016). [DOI] [PMC free article] [PubMed] [Google Scholar]
- 5.Lowell BB & Spiegelman BM Towards a molecular understanding of adaptive thermogenesis. Nature 404, 652–660, doi: 10.1038/35007527 (2000). [DOI] [PubMed] [Google Scholar]
- 6.Bachman ES et al. betaAR signaling required for diet-induced thermogenesis and obesity resistance. Science 297, 843–845, doi: 10.1126/science.1073160 (2002). [DOI] [PubMed] [Google Scholar]
- 7.Daniel H & Derry DM Criteria for differentiation of brown and white fat in the rat. Can J Physiol Pharmacol 47, 941–945 (1969). [DOI] [PubMed] [Google Scholar]
- 8.Zeng W et al. Sympathetic neuro-adipose connections mediate leptin-driven lipolysis. Cell 163, 84–94, doi: 10.1016/j.cell.2015.08.055 (2015). [DOI] [PMC free article] [PubMed] [Google Scholar]
- 9.Cannon B & Nedergaard J Brown adipose tissue: function and physiological significance. Physiol Rev 84, 277–359, doi: 10.1152/physrev.00015.2003 (2004). [DOI] [PubMed] [Google Scholar]
- 10.Fedorenko A, Lishko PV & Kirichok Y Mechanism of fatty-acid-dependent UCP1 uncoupling in brown fat mitochondria. Cell 151, 400–413, doi: 10.1016/j.cell.2012.09.010 (2012). [DOI] [PMC free article] [PubMed] [Google Scholar]
- 11.Kazak L et al. A creatine-driven substrate cycle enhances energy expenditure and thermogenesis in beige fat. Cell 163, 643–655, doi: 10.1016/j.cell.2015.09.035 (2015). [DOI] [PMC free article] [PubMed] [Google Scholar]
- 12.Zeng X et al. Innervation of thermogenic adipose tissue via a calsyntenin 3beta-S100b axis. Nature 569, 229–235, doi: 10.1038/s41586-019-1156-9 (2019). [DOI] [PMC free article] [PubMed] [Google Scholar]
- 13.Seale P et al. Prdm16 determines the thermogenic program of subcutaneous white adipose tissue in mice. J Clin Invest 121, 96–105, doi: 10.1172/JCI44271 (2011). [DOI] [PMC free article] [PubMed] [Google Scholar]
- 14.Chi J et al. Three-Dimensional Adipose Tissue Imaging Reveals Regional Variation in Beige Fat Biogenesis and PRDM16-Dependent Sympathetic Neurite Density. Cell Metab 27, 226–236 e223, doi: 10.1016/j.cmet.2017.12.011 (2018). [DOI] [PubMed] [Google Scholar]
- 15.Villarroya F, Cereijo R, Villarroya J, Gavalda-Navarro A & Giralt M Toward an Understanding of How Immune Cells Control Brown and Beige Adipobiology. Cell Metab 27, 954–961, doi: 10.1016/j.cmet.2018.04.006 (2018). [DOI] [PubMed] [Google Scholar]
- 16.Sim GK, Olsson C & Augustin A Commitment and maintenance of the alpha beta and gamma delta T cell lineages. J Immunol 154, 5821–5831 (1995). [PubMed] [Google Scholar]
- 17.Papotto PH, Ribot JC & Silva-Santos B IL-17(+) gammadelta T cells as kick-starters of inflammation. Nat Immunol 18, 604–611, doi: 10.1038/ni.3726 (2017). [DOI] [PubMed] [Google Scholar]
- 18.Vantourout P & Hayday A Six-of-the-best: unique contributions of gammadelta T cells to immunology. Nat Rev Immunol 13, 88–100, doi: 10.1038/nri3384 (2013). [DOI] [PMC free article] [PubMed] [Google Scholar]
- 19.Cua DJ & Tato CM Innate IL-17-producing cells: the sentinels of the immune system. Nat Rev Immunol 10, 479–489, doi: 10.1038/nri2800 (2010). [DOI] [PubMed] [Google Scholar]
- 20.Jin C et al. Commensal Microbiota Promote Lung Cancer Development via gammadelta T Cells. Cell 176, 998–1013 e1016, doi: 10.1016/j.cell.2018.12.040 (2019). [DOI] [PMC free article] [PubMed] [Google Scholar]
- 21.Ho AW & Gaffen SL IL-17RC: a partner in IL-17 signaling and beyond. Semin Immunopathol 32, 33–42, doi: 10.1007/s00281-009-0185-0 (2010). [DOI] [PMC free article] [PubMed] [Google Scholar]
- 22.Jin W & Dong C IL-17 cytokines in immunity and inflammation. Emerg Microbes Infect 2, e60, doi: 10.1038/emi.2013.58 (2013). [DOI] [PMC free article] [PubMed] [Google Scholar]
- 23.Ouyang W, Kolls JK & Zheng Y The biological functions of T helper 17 cell effector cytokines in inflammation. Immunity 28, 454–467, doi: 10.1016/j.immuni.2008.03.004 (2008). [DOI] [PMC free article] [PubMed] [Google Scholar]
- 24.Iwakura Y, Ishigame H, Saijo S & Nakae S Functional specialization of interleukin-17 family members. Immunity 34, 149–162, doi: 10.1016/j.immuni.2011.02.012 (2011). [DOI] [PubMed] [Google Scholar]
- 25.Cheng L et al. Identification of spinal circuits involved in touch-evoked dynamic mechanical pain. Nature Neuroscience 20, 804–814, doi: 10.1038/nn.4549 (2017). [DOI] [PMC free article] [PubMed] [Google Scholar]
- 26.Starnes T et al. Cutting edge: IL-17F, a novel cytokine selectively expressed in activated T cells and monocytes, regulates angiogenesis and endothelial cell cytokine production. J Immunol 167, 4137–4140, doi: 10.4049/jimmunol.167.8.4137 (2001). [DOI] [PubMed] [Google Scholar]
- 27.Brionne TC, Tesseur I, Masliah E & Wyss-Coray T Loss of TGF-beta 1 leads to increased neuronal cell death and microgliosis in mouse brain. Neuron 40, 1133–1145, doi: 10.1016/s0896-6273(03)00766-9 (2003). [DOI] [PubMed] [Google Scholar]
- 28.Krieglstein K, Strelau J, Schober A, Sullivan A & Unsicker K TGF-beta and the regulation of neuron survival and death. J Physiol Paris 96, 25–30 (2002). [DOI] [PubMed] [Google Scholar]
- 29.Kohlgruber AC et al. gammadelta T cells producing interleukin-17A regulate adipose regulatory T cell homeostasis and thermogenesis. Nat Immunol 19, 464–474, doi: 10.1038/s41590-018-0094-2 (2018). [DOI] [PMC free article] [PubMed] [Google Scholar]
- 30.Sulaiman W & Nguyen DH Transforming growth factor beta 1, a cytokine with regenerative functions. Neural Regen Res 11, 1549–1552, doi: 10.4103/1673-5374.193223 (2016). [DOI] [PMC free article] [PubMed] [Google Scholar]
Methods Reference
- 31.Kumar P et al. Intestinal Interleukin-17 Receptor Signaling Mediates Reciprocal Control of the Gut Microbiota and Autoimmune Inflammation. Immunity 44, 659–671, doi: 10.1016/j.immuni.2016.02.007 (2016). [DOI] [PMC free article] [PubMed] [Google Scholar]
- 32.Eguchi J et al. Transcriptional control of adipose lipid handling by IRF4. Cell Metab 13, 249–259, doi: 10.1016/j.cmet.2011.02.005 (2011). [DOI] [PMC free article] [PubMed] [Google Scholar]
- 33.Cheng L et al. Identification of spinal circuits involved in touch-evoked dynamic mechanical pain. Nat Neurosci 20, 804–814, doi: 10.1038/nn.4549 (2017). [DOI] [PMC free article] [PubMed] [Google Scholar]
- 34.Gerhart-Hines Z et al. The nuclear receptor Rev-erbalpha controls circadian thermogenic plasticity. Nature 503, 410–413, doi: 10.1038/nature12642 (2013). [DOI] [PMC free article] [PubMed] [Google Scholar]
- 35.Emmett MJ et al. Histone deacetylase 3 prepares brown adipose tissue for acute thermogenic challenge. Nature 546, 544–548, doi: 10.1038/nature22819 (2017). [DOI] [PMC free article] [PubMed] [Google Scholar]
- 36.Roark CL et al. Subset-specific, uniform activation among V gamma 6/V delta 1+ gamma delta T cells elicited by inflammation. J Leukoc Biol 75, 68–75, doi: 10.1189/jlb.0703326 (2004). [DOI] [PubMed] [Google Scholar]
- 37.Elias JE & Gygi SP Target-decoy search strategy for increased confidence in large-scale protein identifications by mass spectrometry. Nat Methods 4, 207–214, doi: 10.1038/nmeth1019 (2007). [DOI] [PubMed] [Google Scholar]
- 38.Huttlin EL et al. A tissue-specific atlas of mouse protein phosphorylation and expression. Cell 143, 1174–1189, doi: 10.1016/j.cell.2010.12.001 (2010). [DOI] [PMC free article] [PubMed] [Google Scholar]
- 39.Dobin A et al. STAR: ultrafast universal RNA-seq aligner. Bioinformatics 29, 15–21, doi: 10.1093/bioinformatics/bts635 (2013). [DOI] [PMC free article] [PubMed] [Google Scholar]
- 40.Love MI, Huber W & Anders S Moderated estimation of fold change and dispersion for RNA-seq data with DESeq2. Genome Biol 15, 550, doi: 10.1186/s13059-014-0550-8 (2014). [DOI] [PMC free article] [PubMed] [Google Scholar]
- 41.Trapnell C et al. Transcript assembly and quantification by RNA-Seq reveals unannotated transcripts and isoform switching during cell differentiation. Nat Biotechnol 28, 511–515, doi: 10.1038/nbt.1621 (2010). [DOI] [PMC free article] [PubMed] [Google Scholar]
- 42.Cornwell M et al. VIPER: Visualization Pipeline for RNA-seq, a Snakemake workflow for efficient and complete RNA-seq analysis. BMC Bioinformatics 19, 135, doi: 10.1186/s12859-018-2139-9 (2018). [DOI] [PMC free article] [PubMed] [Google Scholar]
- 43.Hodges MR et al. Defects in breathing and thermoregulation in mice with near-complete absence of central serotonin neurons. J Neurosci 28, 2495–2505, doi: 10.1523/JNEUROSCI.4729-07.2008 (2008). [DOI] [PMC free article] [PubMed] [Google Scholar]
- 44.Zeng X et al. Lysine-specific demethylase 1 promotes brown adipose tissue thermogenesis via repressing glucocorticoid activation. Genes Dev 30, 1822–1836, doi: 10.1101/gad.285312.116 (2016). [DOI] [PMC free article] [PubMed] [Google Scholar]