Abstract
Illumination of the retina is a major determinant of energy expenditure by its neurons. However, it remains unclear whether light exposure significantly contributes to the pathophysiology of retinal disease. Driven by the premise that light exposure reduces the metabolic demand of the retina, recent clinical trials failed to demonstrate a benefit for constant illumination in the treatment of diabetic retinopathy. Here, we instead ask whether light deprivation or blockade of visual transduction could modulate the severity of this common cause of blindness. We randomized adult mice with two different models of diabetic retinopathy to 1-3 months of complete dark housing. Unexpectedly, we find that diabetic mice exposed to short or prolonged light deprivation have reduced diabetes-induced retinal pathology, using measures of visual function, compared to control animals in standard lighting conditions. To corroborate these results, we performed assays of retinal vascular health in diabetic Gnat1−/− and Rpe65−/− mice, which lack phototransduction. Both mutants displayed less diabetes-associated retinal vascular disease compared to respective wild-type controls. Collectively, these results suggest that light-induced visual transduction promotes the development of diabetic retinopathy and implicate photoreceptors as an early source of visual pathology in diabetes.
Keywords: Diabetic retinopathy, light deprivation, electroretinography, transducin1, Gnat1, Rpe65, db/db, streptozotocin
1. Introduction
Once dogmatically considered a microvascular disease, diabetic retinopathy (DR) is in fact a disease touching on multiple aspects of retinal physiology, including function of neurons and glia (Honasoge et al., 2019). In line with this view are observations that patients with concurrent retinitis pigmentosa and diabetes rarely develop DR (Arden, 2001; Sternberg et al., 1984). The mechanisms accounting for this finding are debatable, but a prevailing notion holds that the minimal oxygen demand of a degenerated retina reduces stress on a microvascular network compromised by diabetes (Arden et al., 2005). In support of this notion, rod photoreceptors – the predominant neuron of most mammalian retinas and the target of retinitis pigmentosa – are estimated to have one of the highest demands for adenosine triphosphate (ATP) utilization among bodily cell types (Ames et al., 1992). Such ATP demands are also notoriously elevated in the dark because, unlike many other neurons, photoreceptors are depolarized at baseline and become hyperpolarized in response to stimulation (Baylor, 1987).
These combined observations led to a hypothesis that light stimulation could improve metabolic diseases of the retina, such as DR, by reducing photoreceptor energy demands and, by extension, vascular demands (Arden et al., 1998). However, clinical trials employing constant light exposure onto diabetic retinas by use of low-luminance light masks worn at night failed to show benefits for DR outcomes (Sivaprasad et al., 2018). Considering these negative findings, we scrutinized the preclinical literature forming the premise for light-based DR clinical trials. Curiously absent from this literature were experiments testing the converse hypothesis that restricting exposure to light will worsen DR due to the increased ATP demand in the retina.
In this study, we tested this hypothesis by shielding diabetic mice from light exposure and measuring retinopathy outcomes. To reduce confounding effects specific to any one version of mouse diabetes, and because all forms of diabetes converge on the same retinopathy phenotypes (Honasoge et al., 2019), we performed experiments in two models: db/db mice, which resemble type 2 diabetes, and streptozotocin (STZ)-treated mice, which resemble type 1 diabetes. We found, unexpectedly, that light deprivation prevents vision loss from experimental diabetes in both models. Independently, we tested for DR in two different mouse mutants that are incapable of generating rod photoreceptor responses to photostimulation: one that ablates rod signaling due to the lack of the rod G protein transducin (Calvert et al., 2000), and another that leads to constitutive, light-independent low-level signaling by apo-opsin due to the lack of chromophore production in the retinal pigment epithelium (RPE) by Rpe65 (Fan et al., 2005). We found that either genetic perturbation blunts the development of diabetes-induced retinal vascular damage, similar to recent findings by independent investigators (Liu et al., 2019). These combined results provide evidence that the pathogenesis of DR may not be solely due to compromised retinal vasculature, but could also be caused by compromised neuroretinal physiology, perhaps originating within the very first cell of the visual circuit.
2. Materials and Methods
The experiments conducted in this study were conducted in compliance with the ARRIVE guidelines and with the National Institutes of Health guide for the care and use of laboratory animals.
2.1. Experimental Animals
C57BL/6J mice were obtained from Jackson Laboratories (Stock# 000664). Leptin receptor mutation-carrying BKS.Cg-Dock7m +/+ Leprdb/J breeding pairs (db/m heterozygotes) were also obtained from Jackson Laboratories (Stock# 000642). F1 progeny were generated with the following expected ratios: 25% homozygous db/db animals, which are spontaneously diabetic (Bogdanov et al., 2014); 50% db/m heterozygous littermates, which are metabolically healthy; and 25% homozygous m/m mice, which were routinely discarded. Rod transducin (Gnat1) null animals (Gnat1−/−) (Calvert et al., 2000), Rpe65 nulls (Rpe65−/−) (Redmond et al., 1998) and wild type controls were kept on a matched, mixed genetic background that was tested to be free of the Rd8 mutation (Mattapallil et al., 2012).
2.2. Housing
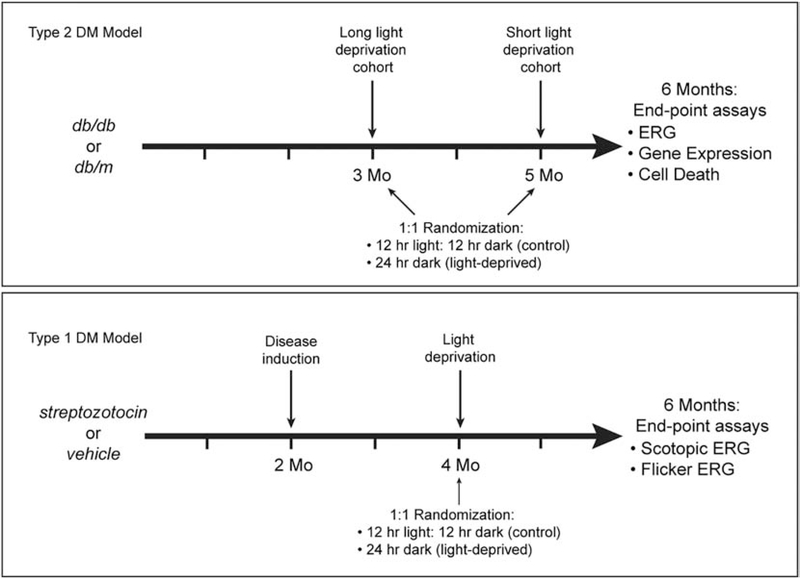
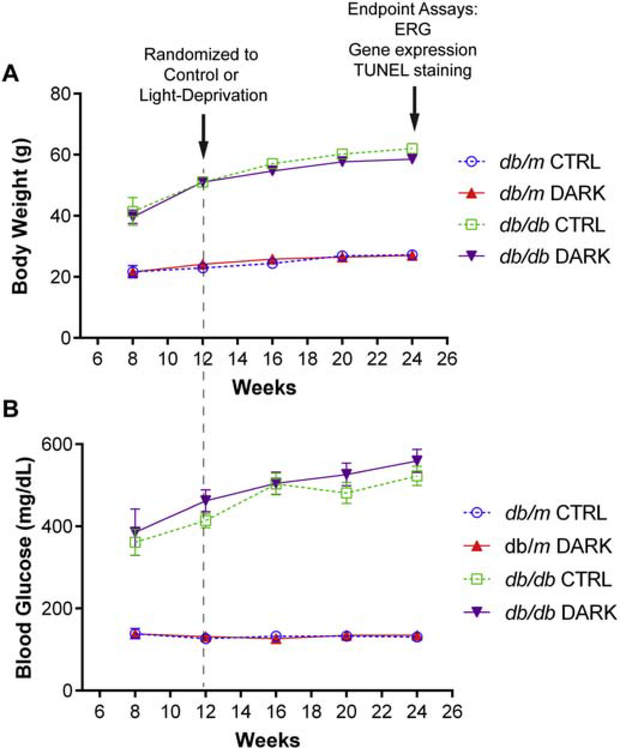
Animals were housed in pathogen-free facility with standard 12 hour ON and 12 hours OFF lighting cycles. For light-deprivation experiments, animals within each experimental group were randomly allocated (1:1) to a room with a 24 hour lights-OFF cycle (0 lux) or to standard housing. Mice in the type 2 diabetes model (db/db) were randomized at either 3 months or 5 months of age, whereas mice in the type 1 model (described below) were randomized at 4 months of age (Figure 1). All animals were then analyzed at 6 months of age. Mice were given ad libitum access to food and water and non-diabetic mice had weekly cage changes whereas cages of diabetic animals were changed every two days.
Figure 1:
Experimental design for light deprivation experiments.
2.3. Induction of Diabetes
In some experiments, STZ was used to induce diabetes in male mice only, given the known resistance of female C57BL/6J mice to this drug. To do so, 2 month-old mice were fasted for 4 hours and then given intraperitoneal doses of STZ, 60 mg/kg dissolved in freshly-prepared sodium citrate buffer (pH 4.5), or citrate buffer alone for controls. The procedure was repeated every 24 hours for a total of 5 doses. Random blood glucose was assessed weekly by a portable Glucocard test-strip device (Arkray USA Inc., Edina, MN) using a drop of blood from tail-vein puncture, beginning one week after STZ dosing. Animals with glucose values consistently above 300 mg/dL were considered “diabetic.” Weekly body weight was also monitored and animals with >10% reduction in body weight compared to pre-STZ baseline measurements received regular insulin therapy (2.5 IU/kg in 0.9% NaCl by IP administration B.I.D) to prevent excess catabolism.
2.4. Measurement of Metabolic Parameters
In addition to weekly glucose and body weight measurements, additional assays of metabolic health were performed. For db/db mice, glucose tolerance testing (GTT), fasting glucose, and fasting insulin measurements were performed after randomization to dark housing or standard housing, but prior to DR assays. For GTT, dextrose dissolved in phosphate buffered saline was delivered by intraperitoneal injection to animals which were fasted for 6 hours. Preinjection glucose values were measured by tail blood by Glucocard test-strip reader (Arkray USA Inc., Edina, MN). Glucose was also measured 10, 30, 60 and 120 minutes post-injection. The area under the curve (AUC) of the GTT for each animal was calculated using Prism 6 (GraphPad Software, San Diego, CA). Fasting glucose and insulin were measured from tail blood taken from animals fasted for 6 hours.
2.5. Electroretinography
Full-field flash electroretinography (ERG) was performed in all animals at 6 months of age. All animals were dark-adapted overnight prior to assessments. A UTAS BigShot System (LKC Technologies, Gaithersburg, MD) was used. Under dim red light illumination, animals were anesthetized with ketamine (80 mg/kg total body mass) and xylazine (15 mg/mg lean body mass) by IP injection. Pupils were dilated with 1% atropine sulfate. Body temperature was maintained at 37°C with a feedback-controlled heating pad. Contact lens electrodes were placed on both eyes along with ground and reference subcutaneous electrodes. Mice were positioned in the Ganzfeld dome using a custom-made mounting apparatus. For scotopic measurements, the stimulus consisted of a 10 microsecond full-field flash of white light against a dark background. After 10 minutes of light adaptation, photopic ERG was performed. For photopic measures, the stimulus was presented against a 30 candela (cd)/m2 background light. Baseline recordings were obtained 25 ms prior to the stimulus and responses were measured over 231 ms. Between 5 (for the brightest) and 10 (for the dimmest) repeated trials were performed for each flash luminance and the trials were averaged. Only data from the eye with the largest amplitude responses were used per mouse. Data were processed using a custom MATLAB script (MathWorks, Natick, MA). Oscillatory potentials (OPs) were isolated using a digital Butterworth 25 Hz high-pass filter and time-to-peak for each OP (OP1-OP4) was determined.
Flicker recordings were obtained in certain experiments using an adaptation of an established protocol (Allen et al., 2018). Briefly, after 10 minutes of light adaptation on a 30 cd/m2 background, a 2.0 log cd·s/m2 flicker stimulus at 6 Hz was presented. Responses were collected over a 500 ms interval and averaged over 15 consecutive trials. Only data from the eye with the largest amplitude responses were used per mouse. The time to each of two peaks in each sequence was calculated and averaged for each animal.
2.6. Capillary Assessments
For STZ-treated animals, trypsin digests and capillary measurements were performed as described previously (Rajagopal et al., 2016; Robison et al., 1991; Veenstra et al., 2015). These measurements were made at 8 months of age (~6 months exposure to diabetes). Briefly, animals were deeply anesthetized, sacrificed, and their eyes were enucleated. After 24 hours fixation at 4°C in 4% PFA, retinas were removed from the eyes and subjected to 3 hour incubation in 3% porcine trypsin at 37°C. The retinas were then gently washed dropwise with tap water until only vascular skeletons remained. The tissue was then flat mounted and stained with 1% periodic acid and Schiff base, with a hematoxylin counterstain. Atrophic capillaries were assessed by a masked observer. Taking precedence from another study utilizing photoreceptor mutations with the potential to affect capillary health independently of diabetes (Liu et al., 2016), we normalized capillary defects to the non-diabetic control for each genetic background.
2.7. Quantitative PCR
At 6 months of age in the db/db model and 8 months of age in STZ-treated mice, total RNA was extracted from isolated retinas. After reverse transcription from 0.5 micrograms of input, quantitative PCR was performed on the resulting cDNA using the following primer pairs.
Vegf-a: sense 5’-AATGCTTTCTCCGCTCTGAA-3’; antisense 5’GCTTCCTACAGCACAGCAGA-3’
Icam1: sense 5’-AACAGTTCACCTGCACGGAC-3’; antisense 5’-GTCACCGTTGTGATCCCTG-3’
Inos: sense 5’-TGAAGAAAACCCCTTGTGCT-3’; antisense 5’-TTCTGTGCTGTCCCAGTGAG-3’
Gfap: sense 5’- TTTCTCGGATCTGGAGGTTG-3’; antisense 5’-AGATCGCCACCTACAGGAAA-3’
Gapdh: sense 5’-TGCACCACCAACTGCTTAGC-3’; antisense 5’-GGCATGGACTGTGGTCATGAG-3’
Rpl32: sense 5’-GGCTTTTCGGTTCTTAGAGGA-3’; antisense 5’-TTCCTGGTCCACAATGTCAA-3’
2.8. Cell Death Assay
Cell death was detected using TUNEL staining of fresh-frozen retinal cryosections (10 microns), similar to methods previously described (Kur et al., 2016). Fixed sections permeabilized with 0.3% triton-X 100 in PBS were then labeled with an in situ rhodamine-coupled anti-digoxigenin antibody kit (ApopTag Red, catalog S7165, MilliporeSigma). Labeled sections were mounted onto treated glass slides and mounted with Vectashield medium containing DAPI (Vector Labs, Burlingame, CA). The number of apoptotic nuclei (signals that were double-positive for TUNEL and DAPI) per high-power field (0.25 mm2) was quantitated using ImageJ software (NIH).
2.9. Statistical Analyses
Values in text and figures are group means with standard error of the mean (SEM). Sample size was at least n=3 per experimental group and was often larger, as indicated in the legends of specific results figures. Statistical analyses were performed using GraphPad 6 Prism software. As indicated in specific figure legends, ordinary 2-way ANOVA, repeated measures (RM) 2-way ANOVA, or ordinary 1-way ANOVA was used to compare groups within experiments. Analyses in Figures 3B, 4 and 5A were performed on data recorded from a 0.983 cd·s/m2 flash. In all experiments, post hoc multiple comparisons tests were performed using Bonferroni’s correction. All analyses were performed with significance at P < 0.05.
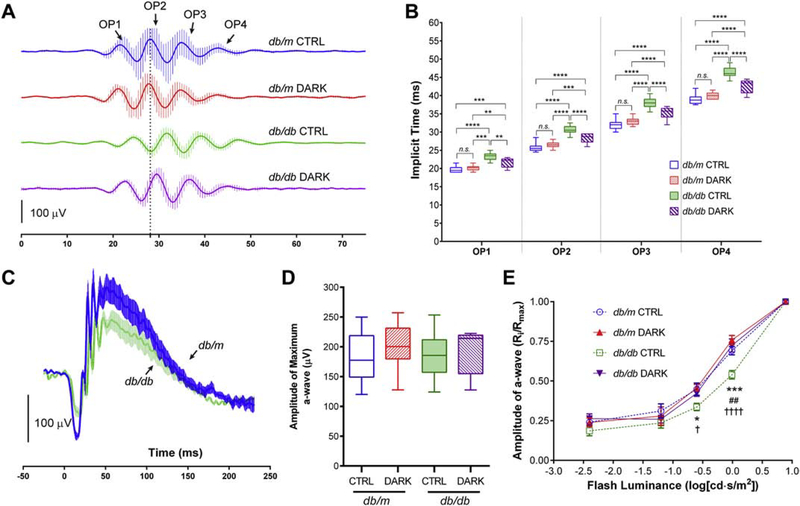
Figure 3:
Electroretinographic responses of mice with type 2 diabetes deprived of light for 3 months. Data in box plots are represented as median (line), IQR (box), and range (whiskers); n=>10 mice/group; db/db = type 2 diabetes group, db/m = age-matched healthy control group. A, Traces showing mean responses with SEM from representative mice that were light-deprived beginning at age 3 months until age 6 months (DARK) or kept in standard lighting (CTRL), showing isolated scotopic oscillatory potentials (OPs) recorded from a 0.983 cd·s/m2 flash. B, Implicit times of the scotopic OPs. ** = P<0.01, *** = P<0.001, **** = P<0.0001, by 2-way RM ANOVA with Bonferroni post-hoc correction. C, Scotopic ERG traces recorded from a 0.983 cd·s/m2 flash showing mean responses with SEM from a representative sample of diabetic mice (green) and littermate non-diabetic controls (blue). D, Amplitudes of scotopic a-wave responses from a maximal 7.846 cd·s/m2 flash. P>0.05 for all comparisons using 1-way ANOVA and Bonferroni post-hoc correction. E, Luminance-response curve showing a-wave amplitudes in mice with or without diabetes, deprived of light or kept in standard lighting conditions. Data represent mean with SEM (error bars) and were analyzed by 2-way RM ANOVA with Bonferroni post-hoc correction. *=P<0.05, ***=P<0.001, comparing db/db CTRL and db/db DARK; ##=P<0.01, comparing db/db CTRL and db/m CTRL; †=P<0.05, ††††=P<0.0001, comparing db/db CTRL and db/m DARK; all other comparisons have P>0.05.
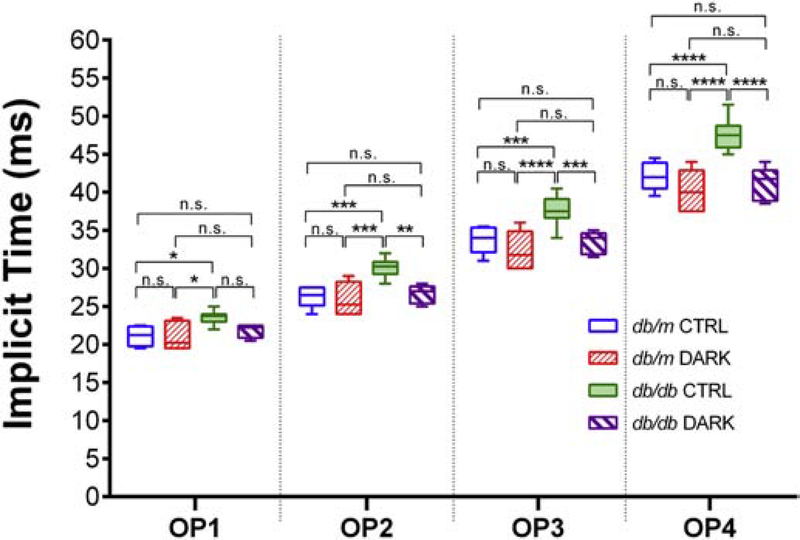
Figure 4:
Implicit times of the scotopic OPs in mice with type 2 diabetes deprived of light for 1 month. Mice were light-deprived beginning at age 5 months until age 6 months (DARK) or kept in standard lighting (CTRL), and scotopic OP implicit times recorded from a 0.983 cd·s/m2 flash were quantified. Data are represented as median (line), IQR (box), and range (whiskers); n=>8 mice/group; db/db = type 2 diabetes group, db/m = age-matched healthy control group. * = P<0.05, ** = P<0.01, *** = P<0.001, **** = P<0.0001, by 2-way RM ANOVA with Bonferroni post-hoc correction.
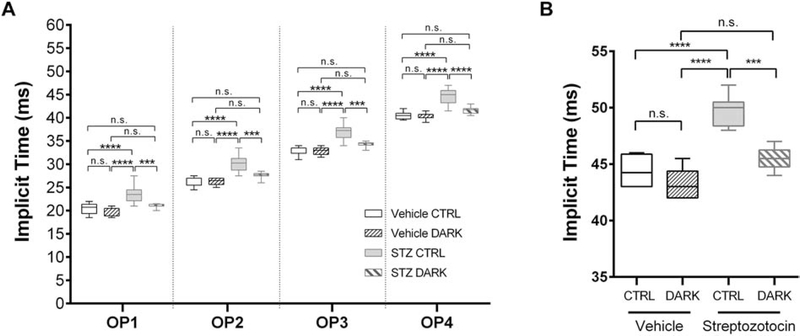
Figure 5:
Electroretinographic responses of light-deprived mice with type 1 diabetes. Data are represented as median (line), IQR (box), and range (whiskers); n=>8 mice/group. A, Implicit times of the scotopic OPs recorded from a 0.983 cd·s/m2 flash in 6-month-old mice with type 1 diabetes (treated with STZ at 2 months) or healthy controls (vehicle-injected), and either deprived of light for 2 months starting at age 4 months (DARK) or kept in standard lighting conditions (CTRL). *** = P<0.001, **** = P<0.0001, by 2-way RM ANOVA with Bonferroni post-hoc correction. B. Implicit time of the b-wave responses to 6 Hz flicker stimulation. *** = P<0.001, **** = P<0.0001, by 1-way ANOVA with Bonferroni post-hoc correction.
3. Results
3.1. Light deprivation in adult animals does not alter the course of diabetes in a type 2 model
At 3 months of age, db/db mice and db/m controls were randomized to housing with 24 hr lights off or to housing with a standard 12 hr light on to 12 hr light off cycle. Both at randomization and after 3 months of exposure to standard or light-deprived conditions, animals in each metabolic group had comparable body weights, blood glucose, glucose tolerance parameters and fasting insulin (Table 1). Furthermore, rates of body weight change and plasma glucose levels remained unaffected by light-deprivation compared to controls (Figure 2A and 2B).
Table 1:
Metabolic data of light-deprived mice in a type 2 model of diabetes.
| 12 hr ON: 12 hr OFF (Control) | 24 hr OFF (Light-Deprived) | |||
|---|---|---|---|---|
| Non-diabetic db/m | Diabetic db/db | Non-diabetic db/m | Diabetic db/db | |
| n | 21 | 19 | 22 | 20 |
| Body Weight, g, 3 months (at randomization) | 22.9 (0.9) | 51.1 (1.3)**** | 24.1 (0.6) | 51.1 (0.6)**** |
| Body Weight, g, 6 months (at assay) | 27.2 (1.0) | 62.0 (1.6)**** | 27.0 (0.7) | 58.5 (1.6)**** |
| Random Plasma Glucose, mg/dL, 3 months (at randomization) | 126.7 (7.3) | 414.3 (17.4)**** | 131.6 (4.1) | 462.1 (26.7)**** |
| Random Glucose (mg/dL) 6 months (at assay) | 130.8 (5.9) | 522.7 (23.5)**** | 134.8 (5.2) | 559.4 (28.0)**** |
| Fasting Plasma Glucose (mg/dL) 6 months | 135.5 (4.8) | 645.2 (5.9)**** | 142.5 (7.3) | 621.2 (10.3)**** |
| Glucose Tolerance Testing (AUC) at 6 months | 16506.5 (1330.4) | 89026.3 (3897.3)**** | 17060.3 (1611.8) | 81051.7 (6989.4)**** |
| Fasting Insulin at 6 months | 0.47 (0.02) | 2.37 (0.23)** | 0.9 (0.05) | 2.78 (0.21)** |
Measures were taken at the time of randomization to control lighting or light-deprivation, and again at the time of the assay. Data are represented as mean (SEM) and groups were compared by 1-way (for GTT AUC and Fasting Insulin) or 2-way (for body weight and glucose) ANOVA with Bonferroni post-hoc correction.
= P<0.01
= P<0.0001 compared to healthy littermates within same lighting group; P>0.05 for all other comparisons.
Figure 2:
Body weight and glucose responses in light-deprived mice with type 2 diabetes. A, Body weight (g) and B, random plasma glucose (mg/dL) measured over time in mice with diabetes (db/db) or healthy controls (db/m). At age 3 months, mice were randomized to light-deprivation (DARK) or standard lighting (CTRL).
3.2. Dark housing ameliorates the loss of visual function responses in type 2 diabetes
Multiple ERG abnormalities occur in animals with diabetes, including measures of inner and outer retinal function. Mice were randomized to control or experimental (light-deprivation) housing at 3 months of age (Figure 1). We then performed ERG at 6 months of age, after 3 months in respective experimental lighting conditions, and measured latencies of the oscillatory potentials – a visual function measure known to be affected very early in the course of human and experimental diabetes. As previously reported, after housing in normal lighting conditions, scotopic OPs were delayed in db/db animals compared to littermate db/m controls (Figure 3A) (Bogdanov et al., 2015). However, compared to diabetic animals housed in standard lighting, OPs were less delayed in db/db mice subjected to light-deprivation (F3,59 = 87.2, P < 0.0001, 2-way RM ANOVA; Figure 3B). Since prior observations of light response amplitude reduction in db/db mice suggested the presence of diabetes-induced photoreceptor dysfunction, we also assessed the ERG a-wave in our experimental model (Sapieha et al., 2012). Although diabetes reduced a-wave response amplitudes after sub-maximal flashes (Figure 3C), responses to the brightest flash in our protocol were unaltered comparing any group (Figure 3D). After 3 months of light-deprivation, db/db mice displayed improved a-wave responses across all stimulus luminances we tested compared to those of their counterparts in normal lighting conditions, and no differences were observed between light-deprived db/db compared to any of the db/m controls (F3,50 = 4.636, P = 0.0062, 2-way RM ANOVA; Figure 3E).
Since 3 months of light-deprivation could have caused remodeling of retinal circuitry (even though no obvious changes were detected in control non-diabetic animals), we repeated the experiment with shorter exposures to light-deprivation (Figure 1). At 5 months of age, db/db mice or db/m controls were randomized to 24 hrs lights-off housing or to standard lighting conditions. After 1 month in these conditions, ERGs were performed as before. Despite a longer exposure to diabetes and a shorter light-deprivation period, db/db mice with one month of light deprivation had quicker OP responses than db/db controls in standard housing (F3,24 = 12.44, P < 0.0001, 2-way RM ANOVA; Figure 4). Notably, these mice displayed no delays in their OPs compared to db/m counterparts. Collectively, these results indicate that light deprivation for 1 or 3 months in adult mice with type 2 diabetes reduces the severity of their retinal disease.
3.3. Mice with induced type 1 diabetes do not develop ERG abnormalities when deprived of light exposure
In an independent set of experiments, mice with STZ-induced diabetes were randomized to housing in dark conditions or standard lighting conditions at 4 months of age (2 months following STZ treatment). 2 months later, ERG was performed to measure scotopic OPs and flicker responses, as both are known to be affected in this experimental model (Aung et al., 2013). Table 2 shows metabolic responses of STZ treated animals compared to controls, with no significant differences in body weight or plasma glucose between mice kept in the dark and those in the light. STZ mice kept in the light had significantly abnormal responses compared to their respective controls, in terms of OP timing (F3,28 = 22.64, P < 0.0001, 2-way RM ANOVA; Figure 5A) and cone flicker responses (F3,18 = 26.54, P < 0.0001, 1-way ANOVA; Figure 5B). In contrast, both of these responses were normal in STZ mice kept in the dark. Thus, restricting light exposure in STZ-induced diabetic mice prevented the progression of DR.
Table 2:
Metabolic data of light-deprived mice in a type 1 diabetes model.
| 12 hr ON: 12 hr OFF (Control) | 24 hr OFF (Light-Deprived) | |||
|---|---|---|---|---|
| Non-diabetic Vehicle | Diabetic Streptozotocin | Non-diabetic Vehicle | Diabetic Streptozotocin | |
| n | 11 | 8 | 12 | 9 |
| Body Weight, g, 2 months (Pre-Injection) | 22.4 (1.3) | 19.9 (0.7) | 21.2 (0.8) | 20.7 (0.7) |
| Body Weight, g, 4 months (at randomization) | 24.9 (1.4) | 21.4 (0.2)* | 24.1 (0.6) | 21.6 (0.5) |
| Body Weight, g, 6 months (at assay) | 25.3 (1.3) | 22.3 (0.3) | 24.8 (0.5) | 22.7 (0.6) |
| Random Plasma Glucose, mg/dL, 2 months (Pre-Injection) | 127.0 (3.5) | 149.3 (33.1) | 139.4 (25.9) | 118.5 (10.5) |
| Random Glucose (mg/dL), 4 months (at randomization) | 152.2 (10.3) | 550.5 (29.0)**** | 159.0 (6.1) | 521.3 (18.9)**** |
| Random Glucose (mg/dL), 6 months (at assay) | 156.9 (15.9) | 525.0 (15.6)**** | 146.4 (13.0) | 545.1 (12.3)**** |
Measures were taken at the time of diabetes induction, at time of randomization to control lighting or light-deprivation, and at the time of assay. Data are represented as mean (SEM) and groups were compared by 1-way (for GTT AUC and Fasting Insulin) or 2-way (for body weight and glucose) ANOVA with Bonferroni post-hoc correction.
= P<0.05
= P<0.0001 compared to healthy controls within same lighting group; P>0.05 for all other comparisons.
3.4. Light-deprivation prevents diabetes-associated upregulation of pro-inflammatory retinal gene expression and apoptosis
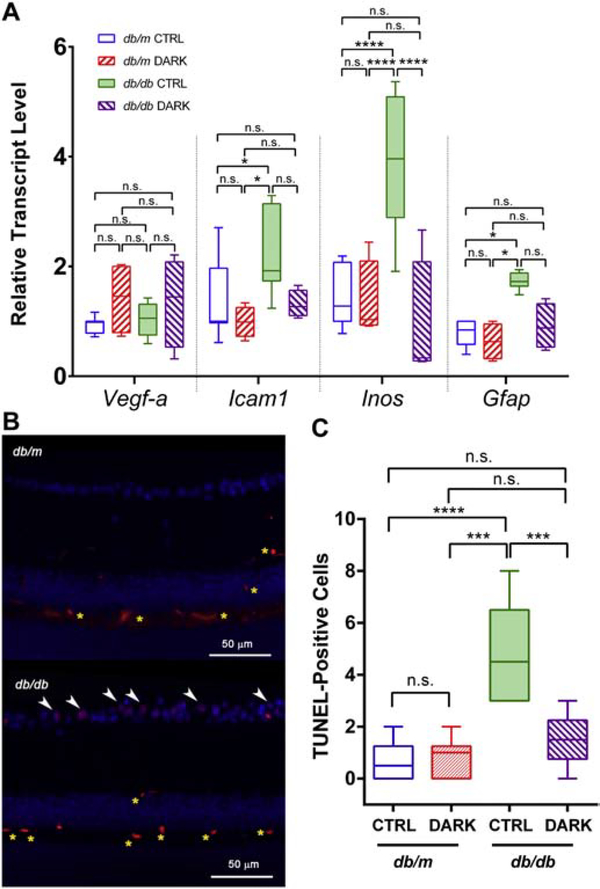
As reported previously by our group and others, experimental diabetes is associated with upregulated gene expression of factors associated with vasoactive and inflammatory retinal signaling (Rajagopal et al., 2016). To determine whether light-deprivation changes this reactive gene expression profile in db/db mice, we assayed relevant mRNAs by performed qPCR. Whereas db/db mice in standard lighting showed robust upregulation of transcripts for icam-1, inos, and gfap compared to controls, db/db mice in dark housing did not (F3,80 = 21.06, P < 0.0001, 2-way ANOVA; Figure 6A). As expected in mouse models that rarely develop advanced features of DR, as seen in humans, expression of vegf-a was unchanged across conditions after ~6 months of exposure to diabetes (Figure 6A).
Figure 6:
Reactive gene expression profile and cell death in mice with type 2 diabetes deprived of light. Box plots show median (line), IQR (box), and range (whiskers); n=>5 mice/group; db/db = type 2 diabetes group, db/m = age-matched healthy control group; DARK = mice deprived of light beginning at age 3 months until age 6 months, CTRL = mice kept in standard lighting conditions. A, Transcripts for the targets indicated on the x-axis were amplified by quantitative PCR. Threshold counts were transformed into copy number, normalized to the mean of control sequences for rpl32 and gapdh and then represented as fraction of the value of the “db/m CTRL” group. ** = P<0.01, **** = P<0.0001 by 2-way ANOVA with Bonferroni post-hoc correction. B, Representative fluorescence micrographs showing TUNEL-staining (red) and DAPI (blue), with apoptotic (double-stained) nuclei in the ganglion cell layer indicated by white arrowheads. Non-specific staining is detected in the intermediate and deep capillary plexuses (yellow asterisks). C, Quantification of apoptotic nuclei (TUNEL and DAPI double-positive signals) per length of cross-sectional retina.
Inner retinal neurodegeneration is a feature of early diabetes in humans and in mice (Barber et al., 1998; Bogdanov et al., 2014; Sohn et al., 2016). Reproducing previous reports, we observed increased TUNEL staining within the ganglion cell layers of 6 month old db/db mice as compared to their metabolically-healthy littermate controls, indicating apoptotic cell death in the inner retina (F3,20 = 14.96, P < 0.0001, 1-way ANOVA; Figure 6B). Housing db/db mice in dark conditions for 3 months prevented such increases in TUNEL staining compared to controls (Figure 6C). Therefore, light-deprivation prevented biochemical features of diabetic retinal disease in a type 2 diabetes model.
3.5. Use of mice with disrupted phototransduction in a type 1 diabetes model
Since even 4 weeks of light deprivation could have had unintended consequences on the metabolic physiology of diabetic mice, we used an alternative model in which animals with deficient phototransduction machinery, but kept in standard lighting conditions, were subjected to STZ-induced diabetes. Mice deficient for rod transducin (Gnat1−/−) lack functional phototransduction and display absent rod-driven responses and recapitulate features of congenital stationary night blindness (Calvert et al., 2000). Mice with a targeted deletion of retinoid isomerase Rpe65 lack visual chromophore and have negligible light responses by ERG, similar to patients with Leber congenital amaurosis (Redmond et al., 1998). In both these mouse models, minimal retinal degeneration occurs, in contrast to many cases of human Rpe65 dysfunction and other mouse models of tapetoretinal disease resulting in marked retinal degeneration. In prior reports, mice with rhodopsin mutations do not develop retinal capillary damage, blood-retina-barrier loss, and increases in retinal oxidative stress markers after induction of diabetes with STZ (de Gooyer et al., 2006; Du et al., 2013). However, animals with such mutations also undergo significant retinal loss, which in and of itself could influence the health of retinal vasculature (Liu et al., 2016). The non-degenerative nature of Gnat1 and Rpe65 deficiency in mice made these mutants attractive for the present study of DR since they allow for dissociation of the effects of loss of rod function versus loss of rods themselves. As expected, both Gnat1 and Rpe65 null mice displayed robust hyperglycemic responses after STZ treatment, similar to background-matched wild-type controls (Table 3).
Table 3:
Metabolic data of mice with disrupted rod phototransduction in a type 1 diabetes model.
| Non-Diabetic (Vehicle) | Diabetic (Streptozotocin) | |||||
|---|---|---|---|---|---|---|
| Wild Type | gnat1−/− | rpe65−/− | Wild Type | gnat1−/− | rpe65−/− | |
| n | 10 | 9 | 9 | 8 | 8 | 7 |
| Fasting Plasma Glucose, mg/dL, 2 months (Pre-Injection) | 112.2 (5.7) | 112.7 (10.7) | 106.2 (9.9) | 100.0 (7.3) | 104.3 (2.9) | 93.3 (9.7) |
| Fasting Plasma Glucose (mg/dL), 3 month (Post-Injection) | 115.2 (8.3) | 127.8 (13.5) | 112.8 (7.8) | 500.2 (38.4)**** | 520.9 (15.4)**** | 539.5 (44.9)**** |
| Fasting Plasma Glucose (mg/dL), 6 months (at assay) | 129.8 (7.7) | 135.2 (7.8) | 120.0 (11.8) | 565.4 (16.4)**** | 547.1 (29.2)**** | 580.7 (15.9)**** |
Data are represented as mean (SEM) and groups were compared by 2-way ANOVA with Bonferroni post-hoc correction.
= P<0.0001 compared to healthy controls with same genotype; P>0.05 for all other comparisons.
3.6. Rod transducin-deficient mice do not develop abnormally slow flicker ERG responses during STZ-induced diabetes
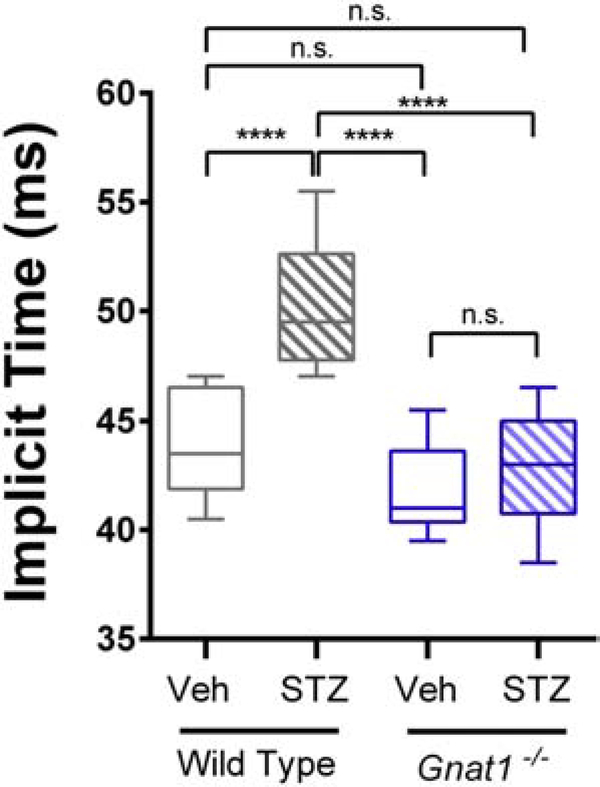
Unlike chromophore-deficient Rpe65 nulls, which have nearly extinguished responses to all light, Gnat1−/− mice lack rod-driven photoresponses but retain intact photopic ERG. Therefore, we measured the timing of cone responses to 6 Hz flicker stimulation in diabetic mice lacking rod transducin. STZ treatment causes delays in flicker implicit times early in the course of metabolic disease (Aung et al., 2013). In 6-month-old wild type animals injected with STZ at 2 months of age, we observed such delays in cone flicker implicit time, as compared to vehicle-treated controls (F3,32 = 20.98, P < 0.0001, 1-way ANOVA; Figure 7). In contrast, STZ-treated Gnat1−/− mice had no difference in flicker ERG implicit time compared to either vehicle-treated Gnat1−/− or wild type mice (Figure 7) despite having equally severe hyperglycemia (Table 3). Thus, blocking rod signaling in diabetic mice prevented the development of abnormal photopic flicker ERG response.
Figure 7:
Flicker ERG responses of rod transducin null mice (Gnat1−/−) in the type 1 diabetes model. Responses to 6 Hz flicker white light were recorded from 6-month-old mice with diabetes (STZ; 4 months after diabetes-induction) or healthy, age-matched controls (Veh). Data are represented as median (line), IQR (box), and range (whiskers); n=>8 mice/group. **** = P<0.0001 by 2-way ANOVA with Bonferroni post-hoc correction.
3.7. Rod transducin- or Rpe65-deficient mice do not develop capillary atrophy during STZ-induced diabetes
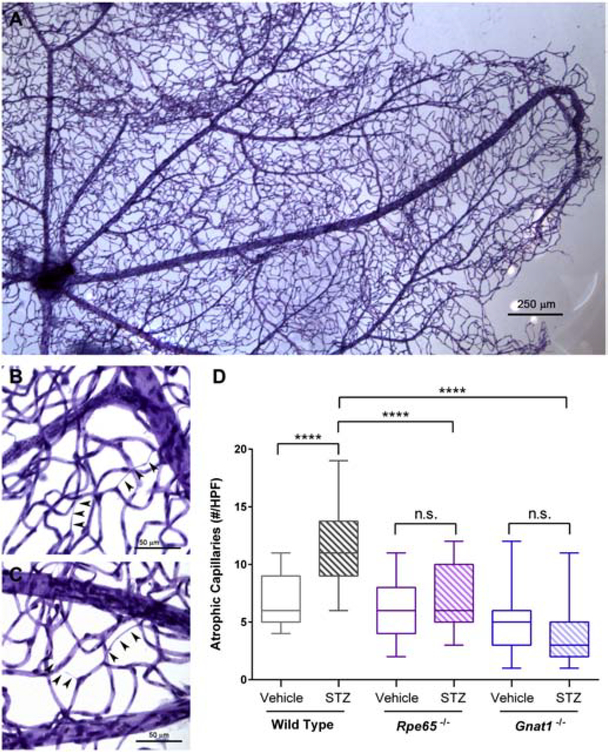
To determine whether mice lacking rod signaling are protected from retinal vascular damage caused by diabetes, we performed capillary morphometry. At 8 months of age (~ 6 months exposure to diabetes), trypsin digestion was used to isolate microvascular trees from isolated retina (Figure 8A). Atrophic retinal capillaries, using the established definition as vessels lacking hematoxylin-positive nuclei anywhere along their length and being at least 1/5 the diameter of normal capillaries (Veenstra et al., 2015), were quantitated by a masked observer in several high-power fields (Figure 8B, C). In the presence of either Rpe65 or Gnat1 deficiency, STZ-treatment failed to induce increases in the number of atrophic capillaries over controls as it did in wild-type counterparts (F5,195 = 60.51, P < 0.0001, 2-way ANOVA; Figure 8D). Thus, blocking photoreceptor signaling in diabetic mice prevented the development of retinal vascular pathology.
Figure 8:
Diabetes-associated retinal vascular changes in mice with disrupted rod phototransduction. A, Representative photomicrograph of retinal vascular tree isolated from STZ-treated wild type mice by trypsin digest of neuroglial elements followed by PAS and hematoxylin staining. B and C, Representative high-power micrographs showing atrophic capillaries in STZ-treated wild type mice, denoted by arrowheads. Each series of three arrowheads was scored as one individual atrophic capillary. D, Quantification of capillary lesions in STZ-treated mice. Data are represented as median (line), IQR (box), and range (whiskers); n=>3 mice/group. **** = P<0.0001 by 2-way ANOVA with Bonferroni post-hoc correction.
3.8. Mice lacking rod transducin or Rpe65 mice are protected from diabetes-induced expression of inflammatory genes
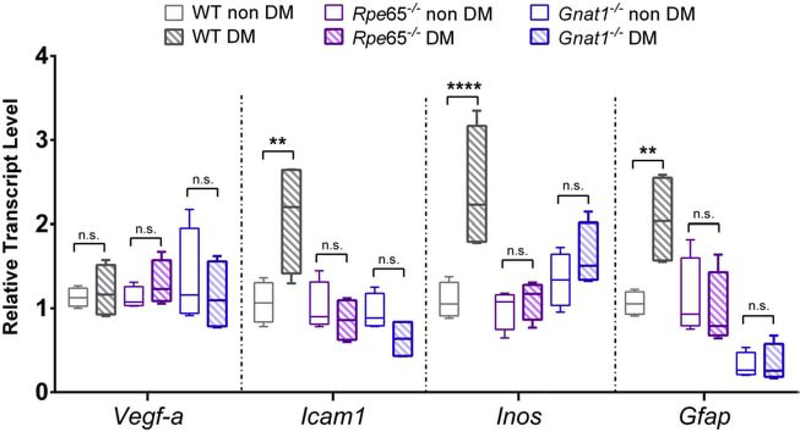
We performed gene expression analysis for Vegf-a, Icam-1, Inos, and Gfap in STZ-treated mice after 6 months of exposure to diabetes. Whereas STZ treatment caused marked upregulation of these transcripts in wild-type mice (with the exception of Vegf-a), it failed to upregulate any of these markers in either Gnat1−/− or Rpe65−/− backgrounds (F5,72 = 16.77, P < 0.0001, 2-way ANOVA; Figure 9).
Figure 9:
Diabetes-induced reactive gene expression profile in mice with disrupted rod phototransduction. Total RNA was isolated from retinas of 6-month-old mice of the indicated genotypes, after STZ-induced diabetes (DM) or vehicle-injection (non DM). Transcripts for the targets indicated on the x-axis were amplified by quantitative PCR. Threshold counts were transformed into copy number, normalized to the mean of control sequences for rpl32 and gapdh and then represented as a fraction of the value of the “WT non DM” group. Box plots show median (line), IQR (box), and range (whiskers); n=>5 mice/group. ** = P<0.01, **** = P<0.0001 by 2-way ANOVA with Bonferroni post-hoc correction.
4. Discussion
In this report, we asked whether absence of light-evoked rod phototransduction influenced the development of retinopathy in mice with diabetes. In one approach to address this question, we deprived diabetic mice of light for several weeks and then used measures of visual function to estimate vision loss from diabetes. In a second approach, we took two independent and non-degenerative genetic models of phototransduction blockade to assess DR severity, using functional and morphologic measurements. In both approaches, we found that mice with absent or greatly-diminished rod photosignaling are relatively spared from DR compared to controls.
Compared to controls in standard housing with normal light:dark cycles, animals with both type 1 and type 2 models of diabetes placed into 0 lux housing for 3 months after the initiation of metabolic disease were relatively spared from developing diabetes-induced delays in visual responses, as assessed by full-field ERG. Furthermore, we evaluated whether retinal remodeling in complete darkness could have played a role by depriving animals of light for shorter durations of time. Unexpectedly, 4 weeks in the dark was sufficient to protect db/db mice from developing scotopic OP delays, even though light deprivation was initiated at 5 months of age after the animals were exposed to hyperglycemia and insulin resistance for over 3 months. The protection was even more robust than that seen after longer light deprivation, with near complete normalization of responses after 1 month of darkness (Figure 4). Though even 4 weeks of light deprivation could have had effects on systemic metabolism, we evaluated indicators of diabetes severity between light-deprived mice and their respective controls in 2 different disease models with divergent etiologic mechanisms. As shown in Tables 1 and 2, light-deprivation had no discernible effects on level of hyperglycemia or glucose excursions after bolus challenge. Taken together, these findings suggest that the protective effects of sustained light deprivation on DR are potent and are not likely due to effects on systemic metabolism or to non-specific effects on any one model of mouse diabetes.
Similar to the results in animals deprived of light, mice without functional rod transducin or Rpe65 developed less DR after STZ-induced diabetes compared to wild-type controls. These findings are consistent with a recent study using STZ-induced diabetes in Gnat1−/− mice on a C57BL/6J background (Gnat1−/− and Rpe65−/− mice used in this paper were on a mixed but identical genetic background). In that report, the investigators did not assess OP kinetics or apoptosis, but extensively evaluated capillary health, using morphometry and leukostasis assays, as well as barrier dysfunction, using an albumin-FITC tracer (Liu et al., 2019). Interestingly, those investigators found that Gnat1−/− mice showed no increase in capillary atrophy, leukostasis, or inner retinal barrier loss in diabetes, compared to background-matched non-diabetic controls, but that albumin leakage into the outer retina was present even in diabetic Gnat1−/− mice. In the present study, we found that the Rpe65−/− genetic background had a similar effect as Gnat1−/− on DR, which provides additional insight into potential mechanisms of action. Unlike Gnat1−/− mice that lack all signaling from rhodopsin, Rpe65−/− mice have low-level, light-independent signaling driven by chromophore-free opsin (Fan et al., 2005). Therefore, the collective effects of light deprivation, Gnat1 loss, and Rpe65 loss that we observed suggest that light-induced signaling from rods is an important requisite for the development of DR.
The results of our study run starkly in contrast to a prediction made by the late electrophysiologist Dr. Geoffrey Arden, who argued that because photoreceptors have higher energy demands in the dark compared to the light that a metabolic disease such as DR would be exacerbated in the dark and ameliorated in the light (Arden et al., 1998). Only sparse clinical data supported this view, including a small clinical series of patients with diabetes but no retinopathy, which found that short term dark adaptation (20 min) caused reduction in OP amplitudes compared to nondiabetic controls – an effect reversible using acute hyperbaric oxygen inhalation (Drasdo et al., 2002). More recently, prospective clinical trials were conducted to evaluate the effects of keeping patients with DR exposed to light throughout a 24-hours cycle – by use of light masks worn during sleep. Though phase 2 studies using these masks showed some promise, no benefits were observed in the phase 3 trial, using reduction in pre-existing diabetic macular edema as the primary endpoint (Sivaprasad et al., 2018). Similarly, a preclinical study in STZ-treated rats exposed to constant light failed to show any beneficial effects on DR – using measures of visual function and inner retinal cell loss (Kur et al., 2016).
Our results and these prior findings argue that the initial pathophysiology of DR could be more complex than an issue of insufficient energy supply to the neural retina. Dr. Arden’s hypothesis is based on the supposition that DR is primarily a vasculopathy of the retina – a common view of this widespread disease. Yet, instead of a primary vasculopathy, if one views DR as a primary neuropathy of the retina with subsequent effects on the retinal vasculature, the results of this study offer several lines of tempting speculation. First, forcing increased energy demand upon diabetic photoreceptors could cause mitochondrial expansion and increased oxidative capacity, similar to the effects seen after exercise on skeletal muscle (Meinild Lundby et al., 2018). Second, prolonged dark exposure could be improving insulin sensitivity in photoreceptors – a feature known to be reduced by experimental diabetes (Reiter et al., 2006). Third, reducing light exposure could result in the production of beneficial instead of damaging reactive oxygen species (Berkowitz et al., 2015). Fourth, increased energetic demands in the dark might also reduce infiltration of inflammatory macrophages into the diabetic retina or allow for favorable extracellular matrix remodeling (Hammer et al., 2017; Ogura et al., 2017; Roy et al., 2016). Fifth, ATP demands in light deprivation could cause shifting of retinal energy utilization from different fuels – an understudied concept, but one gaining acceptance in the light of recent findings that under certain circumstances the retina is capable of oxidizing fatty acids for energy conversion (Joyal et al., 2016). Finally, loss of light-induced rod signaling could reduce stress on neurovascular coupling mechanisms, which could become compromised due to photoreceptor disease (Ivanova et al., 2019; Mishra and Newman, 2010; Mishra and Newman, 2011). Such a mechanism could account for the effects of outer retinal perturbations on some of the inner retinal outcomes described in this paper, such as OP timing or retinal capillary loss.
Since shielding patients from light exposure is not a viable therapy for DR, understanding the mechanisms accounting for our observations could provide a rich source of potential interventions for DR – ones that do not involve light deprivation. However, one potential immediate intervention would be to limit light exposure during waking hours through the use of dim ambient lighting or sun glasses. Furthermore, the finding that retinylamine – a potent visual cycle inhibitor – ameliorates capillary loss, blood-retina-barrier dysfunction and retinal oxidative stress in the STZ model (Liu et al., 2015) requires some consideration in light of our findings. The drug could be acting in a similar fashion as prolonged light-deprivation, or could be influencing other aspects of photoreceptor metabolism to correct their function in diabetes. The significance of our findings is that despite the likely complexity of DR pathogenesis, simple interventions – namely exposing eyes to less light or shielding them from it – might provide benefit.
5. Conclusions
Blockade of photoreceptor signaling, either by light deprivation or by use of non-degenerative genetic deficiency in visual transduction machinery, prevents the development of DR in two different experimental models of diabetes. These results are unexpected because photoreceptor energy demands are increased in the absence of phototransduction. Our observations warrant additional investigation into what underlying mechanisms are responsible and suggest that photoreceptors are involved in the early pathogenesis of a common vascular disease of the retina.
Highlights.
Photoreceptors are metabolically-demanding neurons, more so in dark than in light.
Unexpectedly, light deprivation prevents retinal dysfunction due to diabetes.
Animals lacking visual transduction are also protected from diabetic retinopathy.
These results implicate photoreceptors as a source of pathophysiology in diabetes.
6. Acknowledgements
Funding: This work was supported by the National Institutes of Health [EY025269, 2016 to RR and P30 EY002687, 2015 to Washington University School of Medicine Department of Ophthalmology and Visual Sciences]; Research to Prevent Blindness, New York, NY [Career Development Award to RR and an Unrestricted Award, 2015 to Washington University School of Medicine Department of Ophthalmology and Visual Sciences]; the Horncrest Foundation, Saint Louis, MO [Unrestricted Award] and the Washington University DRC DK020579.
Footnotes
Conflict of Interest: The authors have declared that no conflict of interest exists.
Publisher's Disclaimer: This is a PDF file of an unedited manuscript that has been accepted for publication. As a service to our customers we are providing this early version of the manuscript. The manuscript will undergo copyediting, typesetting, and review of the resulting proof before it is published in its final form. Please note that during the production process errors may be discovered which could affect the content, and all legal disclaimers that apply to the journal pertain.
9. References
- Allen RS, et al. , 2018. TrkB signalling pathway mediates the protective effects of exercise in the diabetic rat retina. Eur J Neurosci. 47, 1254–1265. [DOI] [PMC free article] [PubMed] [Google Scholar]
- Ames A 3rd, et al. , 1992. Energy metabolism of rabbit retina as related to function: high cost of Na+ transport. J Neurosci. 12, 840–53. [DOI] [PMC free article] [PubMed] [Google Scholar]
- Arden GB, 2001. The absence of diabetic retinopathy in patients with retinitis pigmentosa: implications for pathophysiology and possible treatment. Br J Ophthalmol. 85, 366–70. [DOI] [PMC free article] [PubMed] [Google Scholar]
- Arden GB, et al. , 2005. Spare the rod and spoil the eye. Br J Ophthalmol. 89, 764–9. [DOI] [PMC free article] [PubMed] [Google Scholar]
- Arden GB, et al. , 1998. Does dark adaptation exacerbate diabetic retinopathy? Evidence and a linking hypothesis. Vision Res. 38, 1723–9. [DOI] [PubMed] [Google Scholar]
- Aung MH, et al. , 2013. Early visual deficits in streptozotocin-induced diabetic long evans rats. Invest Ophthalmol Vis Sci. 54, 1370–7. [DOI] [PMC free article] [PubMed] [Google Scholar]
- Barber AJ, et al. , 1998. Neural apoptosis in the retina during experimental and human diabetes. Early onset and effect of insulin. J Clin Invest. 102, 783–91. [DOI] [PMC free article] [PubMed] [Google Scholar]
- Baylor DA, 1987. Photoreceptor signals and vision. Proctor lecture. Invest Ophthalmol Vis Sci. 28, 34–49. [PubMed] [Google Scholar]
- Berkowitz BA, et al. , 2015. Oxidative stress and light-evoked responses of the posterior segment in a mouse model of diabetic retinopathy. Invest Ophthalmol Vis Sci. 56, 606–15. [DOI] [PMC free article] [PubMed] [Google Scholar]
- Bogdanov P, et al. , 2014. The db/db mouse: a useful model for the study of diabetic retinal neurodegeneration. PLoS One. 9, e97302. [DOI] [PMC free article] [PubMed] [Google Scholar]
- Bogdanov P, et al. , 2015. Effect of fenofibrate on retinal neurodegeneration in an experimental model of type 2 diabetes. Acta Diabetol. 52, 113–22. [DOI] [PubMed] [Google Scholar]
- Calvert PD, et al. , 2000. Phototransduction in transgenic mice after targeted deletion of the rod transducin alpha -subunit. Proc Natl Acad Sci U S A. 97, 13913–8. [DOI] [PMC free article] [PubMed] [Google Scholar]
- de Gooyer TE, et al. , 2006. Retinopathy is reduced during experimental diabetes in a mouse model of outer retinal degeneration. Invest Ophthalmol Vis Sci. 47, 5561–8. [DOI] [PubMed] [Google Scholar]
- Drasdo N, et al. , 2002. Effect of darkness on inner retinal hypoxia in diabetes. Lancet. 359, 2251–3. [DOI] [PubMed] [Google Scholar]
- Du Y, et al. , 2013. Photoreceptor cells are major contributors to diabetes-induced oxidative stress and local inflammation in the retina. Proc Natl Acad Sci U S A. 110, 16586–91. [DOI] [PMC free article] [PubMed] [Google Scholar]
- Fan J, et al. , 2005. Opsin activation of transduction in the rods of dark-reared Rpe65 knockout mice. J Physiol. 568, 83–95. [DOI] [PMC free article] [PubMed] [Google Scholar]
- Hammer SS, et al. , 2017. The Mechanism of Diabetic Retinopathy Pathogenesis Unifying Key Lipid Regulators, Sirtuin 1 and Liver X Receptor. EBioMedicine. 22, 181–190. [DOI] [PMC free article] [PubMed] [Google Scholar]
- Honasoge A, et al. , 2019. Emerging Insights and Interventions for Diabetic Retinopathy. Curr Diab Rep. 19, 100. [DOI] [PMC free article] [PubMed] [Google Scholar]
- Ivanova E, et al. , 2019. Blood-retina barrier failure and vision loss in neuron-specific degeneration. JCI Insight. 5. [DOI] [PMC free article] [PubMed] [Google Scholar]
- Joyal JS, et al. , 2016. Retinal lipid and glucose metabolism dictates angiogenesis through the lipid sensor Ffar1. Nat Med. 22, 439–45. [DOI] [PMC free article] [PubMed] [Google Scholar]
- Kur J, et al. , 2016. Light adaptation does not prevent early retinal abnormalities in diabetic rats. Sci Rep. 6, 21075. [DOI] [PMC free article] [PubMed] [Google Scholar]
- Liu H, et al. , 2015. Retinylamine Benefits Early Diabetic Retinopathy in Mice. J Biol Chem. 290, 21568–79. [DOI] [PMC free article] [PubMed] [Google Scholar]
- Liu H, et al. , 2019. Transducin1, Phototransduction and the Development of Early Diabetic Retinopathy. Invest Ophthalmol Vis Sci. 60, 1538–1546. [DOI] [PMC free article] [PubMed] [Google Scholar]
- Liu H, et al. , 2016. Photoreceptor Cells Influence Retinal Vascular Degeneration in Mouse Models of Retinal Degeneration and Diabetes. Invest Ophthalmol Vis Sci. 57, 4272–81. [DOI] [PMC free article] [PubMed] [Google Scholar]
- Mattapallil MJ, et al. , 2012. The Rd8 mutation of the Crb1 gene is present in vendor lines of C57BL/6N mice and embryonic stem cells, and confounds ocular induced mutant phenotypes. Invest Ophthalmol Vis Sci. 53, 2921–7. [DOI] [PMC free article] [PubMed] [Google Scholar]
- Meinild Lundby AK, et al. , 2018. Exercise training increases skeletal muscle mitochondrial volume density by enlargement of existing mitochondria and not de novo biogenesis. Acta Physiol (Oxf). 222. [DOI] [PubMed] [Google Scholar]
- Mishra A, Newman EA, 2010. Inhibition of inducible nitric oxide synthase reverses the loss of functional hyperemia in diabetic retinopathy. Glia. 58, 1996–2004. [DOI] [PMC free article] [PubMed] [Google Scholar]
- Mishra A, Newman EA, 2011. Aminoguanidine reverses the loss of functional hyperemia in a rat model of diabetic retinopathy. Front Neuroenergetics. 3, 10. [DOI] [PMC free article] [PubMed] [Google Scholar]
- Ogura S, et al. , 2017. Sustained inflammation after pericyte depletion induces irreversible blood-retina barrier breakdown. JCI Insight. 2, e90905. [DOI] [PMC free article] [PubMed] [Google Scholar]
- Rajagopal R, et al. , 2016. Functional Deficits Precede Structural Lesions in Mice With High-Fat Diet-Induced Diabetic Retinopathy. Diabetes. 65, 1072–84. [DOI] [PMC free article] [PubMed] [Google Scholar]
- Redmond TM, et al. , 1998. Rpe65 is necessary for production of 11-cis-vitamin A in the retinal visual cycle. Nat Genet. 20, 344–51. [DOI] [PubMed] [Google Scholar]
- Reiter CE, et al. , 2006. Diabetes reduces basal retinal insulin receptor signaling: reversal with systemic and local insulin. Diabetes. 55, 1148–56. [DOI] [PubMed] [Google Scholar]
- Robison WG Jr., et al. , 1991. Degenerated intramural pericytes (‘ghost cells’) in the retinal capillaries of diabetic rats. Curr Eye Res. 10, 339–50. [DOI] [PubMed] [Google Scholar]
- Roy S, et al. , 2016. Retinal fibrosis in diabetic retinopathy. Exp Eye Res. 142, 71–5. [DOI] [PMC free article] [PubMed] [Google Scholar]
- Sapieha P, et al. , 2012. Omega-3 polyunsaturated fatty acids preserve retinal function in type 2 diabetic mice. Nutr Diabetes. 2, e36. [DOI] [PMC free article] [PubMed] [Google Scholar]
- Sivaprasad S, et al. , 2018. Clinical efficacy and safety of a light mask for prevention of dark adaptation in treating and preventing progression of early diabetic macular oedema at 24 months (CLEOPATRA): a multicentre, phase 3, randomised controlled trial. Lancet Diabetes Endocrinol. 6, 382–391. [DOI] [PMC free article] [PubMed] [Google Scholar]
- Sohn EH, et al. , 2016. Retinal neurodegeneration may precede microvascular changes characteristic of diabetic retinopathy in diabetes mellitus. Proc Natl Acad Sci U S A. 113, E2655–64. [DOI] [PMC free article] [PubMed] [Google Scholar]
- Sternberg P Jr., et al. , 1984. The negative coincidence of retinitis pigmentosa and proliferative diabetic retinopathy. Am J Ophthalmol. 97, 788–9. [DOI] [PubMed] [Google Scholar]
- Veenstra A, et al. , 2015. Diabetic Retinopathy: Retina-Specific Methods for Maintenance of Diabetic Rodents and Evaluation of Vascular Histopathology and Molecular Abnormalities. Curr Protoc Mouse Biol. 5, 247–270. [DOI] [PMC free article] [PubMed] [Google Scholar]


