Abstract
Osteosclerosis and myefibrosis are complications of myeloproliferative neoplasms. These disorders result in excess growth of trabecular bone and collagen fibers that replace hematopoietic cells, resulting in abnormal bone marrow function. Treatments using imatinib and JAK2 pathway inhibitors can be effective on osteosclerosis and fibrosis; therefore, accurate grading is critical for tracking treatment effectiveness. Current grading standards use a four-class system based on analysis of biopsies stained with three histological stains: hematoxylin and eosin (H&E), Masson’s trichrome, and reticulin. However, conventional grading can be subjective and imprecise, impacting the effectiveness of treatment. In this Article, we demonstrate that mid-infrared spectroscopic imaging may serve as a quantitative diagnostic tool for quantitatively tracking disease progression and response to treatment. The proposed approach is label-free and provides automated quantitative analysis of osteosclerosis and collagen fibrosis.
Graphical Abstract
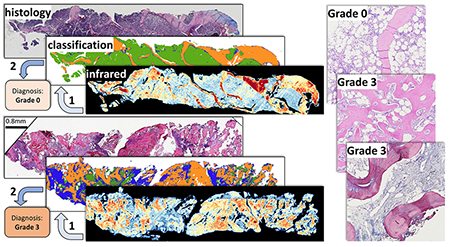
Myeloproliferative neoplasms (MPNs) are a group of heterogeneous hematologic malignancies affecting the proliferation and expansion of one or more hematopoietic lineages. This dysregulation is thought to be a consequence of genetic abnormalities at the level of stem/progenitor cells. Myelofibrosis is an increase in the amount and density of extracellular matrix proteins that provide the structural network upon which hematopoiesis occurs. This increase can vary from a focal, loose network of reticulin fibers to diffuse, dense, and markedly thickened fibers associated with collagen fibrosis and osteosclerosis. Accurate grading of myelofibrosis (MF) and osteosclerosis is an important component of assessing disease staging and prognosis. Grading is traditionally performed by pathologists based on a four-grade European Myelofibrosis Network (EUMNET) scoring system.1 EUMNET scoring uses bone marrow (BM) biopsies stained with H&E, reticulin, and trichrome. In the last World Health Organization (WHO) classification, EUMNET classification was described with collagen and osteosclerosis in a separate scale for grading.2 However, traditional diagnosis is expensive, difficult to quantify, and imprecise due to interobserver variations and lack of standard assessment methods, making it challenging to track successful treatment.3 Recent advances in virtual microscopy enable pathologists to digitize high-resolution histological images, which has encouraged the development of computer-assisted tools for pathological analysis.4 Digital analysis increases repeatability and throughput by reducing human errors and providing deterministic results.5–7 Digital quantification of trabecular bone area has been proposed8 to evaluate the effects of cancer treatments such as imatinib mesylate.9 Digital analysis of stained tissues may provide more quantitative results but is still dependent on tissue staining and prone to variations in protocols and image quality. We propose using vibrational spectroscopic imaging of unstained tissue sections, leveraging a quantitative measure of tissue molecular composition as a contrast mechanism. Infrared spectroscopic imaging, such as Fourier transform infrared (FT-IR) and discrete frequency infrared (DFIR) spectroscopy, is quantitative, label-free, and nondestructive. This enables both objective digital analysis and automated evaluation of histological structures for grading while preserving biopsies for downstream analysis.
Infrared (IR) spectroscopy is often used to identify molecular signatures in organic materials. Fourier transform infrared (FT-IR) has been applied for label-free characterization and classification in histopathological studies10–16 and has the potential to automate examinations to both save time and reduce diagnostic errors. This Article focuses on evaluating the potential for infrared spectroscopy to automate osteosclerosis and collagen grading, particularly trabecular bone area (TBA), by defining a clinically viable protocol for image acquisition and analysis. FT-IR spectroscopy has been successful at differentiating collagen subtypes (I, III, IV, V, and VI);17 however, it has not been validated on clinical samples. Comprehensive analysis of abnormal growth of type I, type IV, and type III collagen is critical for MPN prognosis; therefore, we explored pixel-level classification of collagen subtypes using clinical biopsies. However, because of limited spatial resolution resulting in difficulties in annotations using FT-IR spectroscopic imaging, we limited our study for collagen type I and type IV (trabecular bone). Finally, we developed a set of metrics that provide promising results for automated grading of both osteosclerosis and collagen MF gradings.
BACKGROUND
Bone marrow (BM) is a soft spongy tissue located within bone cavities and is primarily responsible for new blood cell formation (hematopoiesis). Classification of MPNs is based on clinical, laboratory, morphologic, and genetic findings at the time of initial presentation, prior to any definitive therapy for the myeloid neoplasm. Diagnosis ofhematologic disorders relies on characterization of hematopoietic cells and collagen content within the marrow—specifically the size and shape of bone trabeculae, as well as the fiber content of type I collagen (based on trichrome staining) and type III collagen (based on reticulin staining). We limit our focus to osteosclerosis and collagen type I grading because of the difficulty in annotation and hence classification of type III collagen (reticulin) fibers due to low spatial resolution images from FT-IR spectroscopy. To explore the possibility of reticulin fiber identification using mid-IR spectroscopy requires high-resolution instrumentation that has only recently been commercially available in the form of optical photothermal infrared (O-PTIR) imaging.18–20
Osteosclerosis Grading.
Osteosclerosis is a disorder characterized by abnormal trabecular bone growth often accompanied by fibrosis.21 The semiquantitative grading of osteosclerosis is shown in Figure 1. The scoring for osteosclerosis grading according to the WHO is as follows: grade 0, regular bone tuberculae (distinct paratrabecular borders); grade 1, focal budding, hooks, spikes, or paratrabecular apposition of new bone; grade 2, diffuse paratrabecular formation of new bone with thickening of trabeculae, occasionally with focal interconnections; and grade 3, extensive interconnecting meshwork of new bone with overall effacement of marrow spaces.1,2,22 Accurate grading of osteosclerosis and fibrosis is important for precise staging and prognosis of MPN.22,23 In patients with chronic myelogenous leukemia, precise evaluation of trabecular bone area is important for assessing treatment progress and resistance.8 Objective classification can aid characterization of MPNs3 because pathological analysis of TBAis prone to interobserver variability. Digital analysis using H&E-stained tissue sections has been proposed to address this problem3,8 by manually outlining trabecula to estimate TBA with respect to the total biopsy area. These studies show increased throughput and precision in TBA measurement. However, manual outlining is laborious and timeconsuming. Automating precise segmentation of trabecular bone from H&E-stained BM biopsies is complicated by low staining quality and variability in staining.24
Figure 1.

Osteosclerosis grading in bone marrow tissue. From left to right: bone marrow biopsy sections for each grade from grade 0 to grade 3, and each section is stained with H&E stain and imaged at 10× magnification. Grade 0 shows normal trabecular bone in BM. Grade 1 shows initial trabecular apposition though focal budding. Grade 2 shows abnormal growth with thickening and diffuse trabecular structure. Grade 3 shows extensive interconnected new bone growth with effacement of marrow space.
Collagen Grading.
The most recent WHO grading score for collagen deposition is based on a four-grade scheme using Masson’s trichrome to label type I collagen (Figure 2).22 Grade 0 corresponds to normal BM, with type I collagen limited to perivascular regions only. According to WHO, grade 0 has perivascular collagen only (normal); grade 1 shows focal paratrabecular or central collagen deposition with no connecting meshwork; grade 2 shows paratrabecular or central deposition of collagen with focally connecting meshwork or generalized paratrabecular apposition of collagen; and grade 3 shows diffuse (complete) connecting meshwork of collagen in >30% of marrow spaces.2,22 Automating conventional histology with Masson’s trichrome staining is also challenged by staining quality (i.e., weak staining or overstaining).
Figure 2.

Collagen-deposition grading in bone marrow tissue. From left to right: bone marrow biopsy sections for each grade from grade 0 to grade 3, and each section is stained with Masson’s trichrome stain and imaged at 10× magnification. Grade 0 is normal bone marrow with only perivascular type I collagen (blue). Grade 1 shows minimal presence of type I collagen in the central are of bone marrow. Grade 2 shows paratrabecular and prominent central deposition with interconnecting collagen fibers. Grade 3 shows extensive interconnected type I collagen fibers.
APPROACH
Cell and tissue classification using FT-IR imaging is a mature area of research;25–29 however, specific clinical applications are rarely seen. We propose a protocol for automated classification of trabecular bone and collagen and calculation of TBA. We then demonstrate promising and consistent results for automated osteosclerosis and collagen grading, achieving comparable accuracy to human expert evaluation based on quantitative molecular and spatial measurements.
Osteosclerosis scoring is based on evaluation of morphological variations (including size, shape, and spacing) of trabeculae across a biopsy. Accurate segmentation and quantification of trabeculae provide faster and more consistent diagnosis. We test two substrates for clinical practice: (1) standard glass slides, which are compatible with current histological practice but opaque to IR radiation <2500 cm−1,30 and (2) IR reflective slides that provide the entire spectrum between 900 and 3900 cm−1. Testing with both substrates is important for translational work, as the ability to grade samples using features within the glass transmission window eliminates the need for specialized substrates, such as calcium fluoride or low-emissivity glass coatings, which would require changes to existing sample preparation protocols.
Both osteosclerosis and collagen gradings use a two-step classification process. Pixel-level classification is used to identify histologically relevant tissue types31 using already established spectral classifier Random Forest (RF). 9 For each classified biopsy using RF, a set of spatial metrics briefly introduced in next paragraph for both osteosclerosis grading and collagen deposition is computed to mimic the evaluation process outlined in current pathological guidelines.22 A linear discriminant analysis (LDA) then maps these metrics to generate the final grading.
Three osteosclerosis metrics quantify the size and shape of trabecular cross sections relative to the biopsy area. The first metric is TBA, which calculates the total trabecular bone cross section relative to the biopsy area. A diffusion metric quantifies the scattered growth of trabeculae in higher-grade samples. An average spacing metric quantifies the regularity of interstitial spacing between trabeculae. Digital scoring of type I collagen is based on its overall biopsy coverage as well as the coverage of the largest interconnected collagen cluster. This enables us to automate osteosclerosis grading and provide quantitative analysis for collagen-deposition grading without any histochemical staining.
MATERIALS AND METHODS
Sample Preparation.
All tissue sections are decalcified using 5% formic acid, fixed in 10% neutral buffered formalin, and embedded in paraffin. Sections are cut at 5 μm thickness and placed on either reflective low-emmissivity glass (Kevley Technologies) or standard glass. Anonymized tissue microarrays (TMAs) with core biopsies from 24 different patients were purchased from a public repository (AMSBIO). Deidentified bone marrow biopsy samples, five for each osteosclerosis grade (total 20) and five for each collagen-deposition grade, were collected from patients with MPN under an Institutional Review Board (IRB) approved protocol.
Adjacent sections were placed on standard glass for validation using standard histological stains. TMAs were assessed by an expert pathologist to annotate collagen and estimate trabecular bone area. Clinical biopsies were annotated for collagen deposition and evaluated using standard grading protocols.22
Image Acquisition.
FT-IR images for BM TMAs were collected using a Cary 620 FT-IR microscope (Agilent Technologies) in standard magnification mode using a 15× 0.65 NA objective. Spectra were acquired in the range of 10003900 cm−1 at a spectral resolution of 8 cm−1 (total 475 bands) for tissues on IR reflective substrates (collected in transflectance mode) and in the range of 2800–3900 cm−1 for tissues on histology glass slides (collected in transmission mode) for osteosclerosis grading. As images are collected in standard magnification mode of FT-IR, the pixel size of hyperspectral images is 5.5 μm.
Spectral Classification.
All mid-IR images were processed using standard protocols,32 which include rubber band baseline correction and normalization to the amide I band (1650 cm−1) to compensate for scattering and variations in thickness and density. Pixel-level annotations were created for ground truth images based on adjacent histological sections for trabecular bone, collagen, and stroma using both H&E and Masson’s trichrome as references. Here, every pixel represents an absorbance spectrum. A supervised feature-selection algorithm was applied to identify prominent spectral differences between classes. Feature selection was performed with genetic algorithm leveraging linear discriminant analysis (GA-LDA). The GA-LDA algorithm is based on our previously published graphic processing unit (GPU)-based approach29 for fast feature selection on large data sets. Because our GPU-based approach can evaluate a larger population per generation, our parameters are different than those for normal central processing unit (CPU)-based approaches. In the GPU-based approach, each individual from a larger population per generation is evaluated in parallel, which results in faster convergence. Our GA-LDA configuration uses a population size of 1000, 10 generations, a crossover fraction of 0.8, and a mutation fraction of 0.1. We selected features based on the lowest optimal fitness value from at least five runs. A Random Forest (RF) classifier11 was trained on the selected features to differentiate between trabecular bone, collagen, stroma, and background pixels. The RF used 100 untruncated trees for classification.
Osteosclerosis Grading.
Trabecular bone area was calculated from classified IR images by integrating pixels identified as trabecular bone. Subcortical thickening of the trabecular bone was discarded by following guidelines for osteosclerosis grading.22 The area ofsegmented trabecular bone was calculated relative to the total tissue area to determine TBA %. Total biopsy area was estimated by integrating stromal pixels as well as adipose tissue. Because adipose tissue is removed during paraffin infiltration as part of the tissue-preparation process, the resulting holes were filled and reconnected with binary morphological operations in MATLAB (imfill and imclose).
A diffusion metric was calculated by counting the number of contiguous trabecular bone structures covering 80% of the total TBA. Remaining pixels were ignored to avoid considering tiny trabecular structures caused by tissue preparation and classification errors. An average spacing metric describing regularity in trabecular bone spacing was calculated using a distance transform on segmented trabecular bone.
Grading was validated by classifying all clinical osteosclerosis samples into one of the four grades. The three metrics were computed for all clinical samples, and classification for grades is performed on two principal components extracted by principal component analysis (PCA) from these three metrics. Grading classification is validated using LDA classifier using leave-one-out cross-validation.
Collagen Grading.
The percentage of type I collagen fiber (CD%) was computed by integrating the total number of collagen pixels, excluding the perivascular pixels, with respect to total tissue area. The area of the largest connected collagen cluster was calculated, providing a characterization of the extensive interconnected collagen meshwork used to differentiate grades 2 and 3 according to guidelines.
RESULTS AND DISCUSSION
FT-IR Imaging on Glass Slides.
FT-IR imaging generally provides a spectral range of 800–4000 cm−132, which consists of a chemically rich fingerprint region (800–1800 cm−1) separated from a functional group region (2550–3500 cm−1). The intermediate 1800–2550 cm−1 region is primarily composed of atmospheric absorbance. Conventional glass slides heavily absorb in the fingerprint region, making them generally unsuitable for FT-IR spectroscopy. However, some histological studies suggest that glass is viable for some applications,30,33 requiring only functional groups associated with stretching vibrations including CH, OH, and NH. This potentially contains absorbance peaks that are useful for trabecular bone and collagen characterization and may aid clinical adoption by maintaining current sample-preparation protocols.34
While the trabecular bone matrix contains both collagen fibers and minerals, almost 90% of the organic substance is collagen. Decalcification of BM tissue, which is a common step before paraffin embedding, removes minerals. Figure 3 shows mean spectra from both the trabecular bone and stroma classes. Collagen features are seen in trabecular bone in the fingerprint region (1200, 1240, 1282, and 1403 cm−1) and in the functional OH/NH range. The presence of collagen IV in trabecular bone introduces distinguishing features in the OH/NH range, including extra shoulders and a prominent shift to higher wavenumbers. Trabecular bone is also dense when compared to stroma, resulting in lower paraffin concentration, as is clearly seen in the spectrum at the CH stretching (2800–3000 cm−1) and CH bending (~1450 cm −1) bands. Features such as CH stretching (2800–3000−1) and collagen in the OH/NH provide a compelling case for studying classification on glass substrates for osteosclerosis grading.
Figure 3.
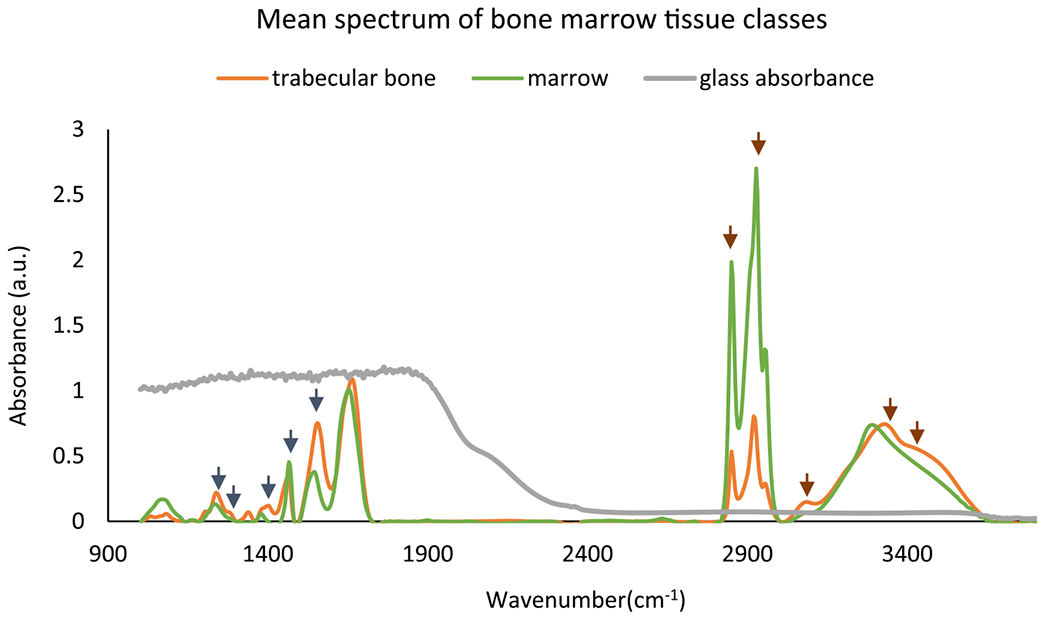
Mean spectra for two classes: trabecular bone and marrow (everything other than trabecular bone in BM) from paraffin-embedded bone marrow tissue microarrays. Optimal features selected by GA-LDA29 for classification of trabecular bone and stroma are shown with short arrows in both fingerprint region (dark blue arrows) and glass transmission window (brown color). The glass absorbance spectrum indicates that histology glass slides are not suitable for imaging in the fingerprint region but can be used for imaging in the higher wavenumber region.
Adjacent sections of normal TMAs were imaged on both low-emissivity glass and standard histological glass slides. RF classifiers were trained independently on both data sets, producing comparable results as shown in Figures 4b and 5b. Results show that classification on spectra within the glass transmission window does not affect classification results, suggesting that FT-IR-based osteosclerosis grading is compatible with standard histology slides.
Figure 4.
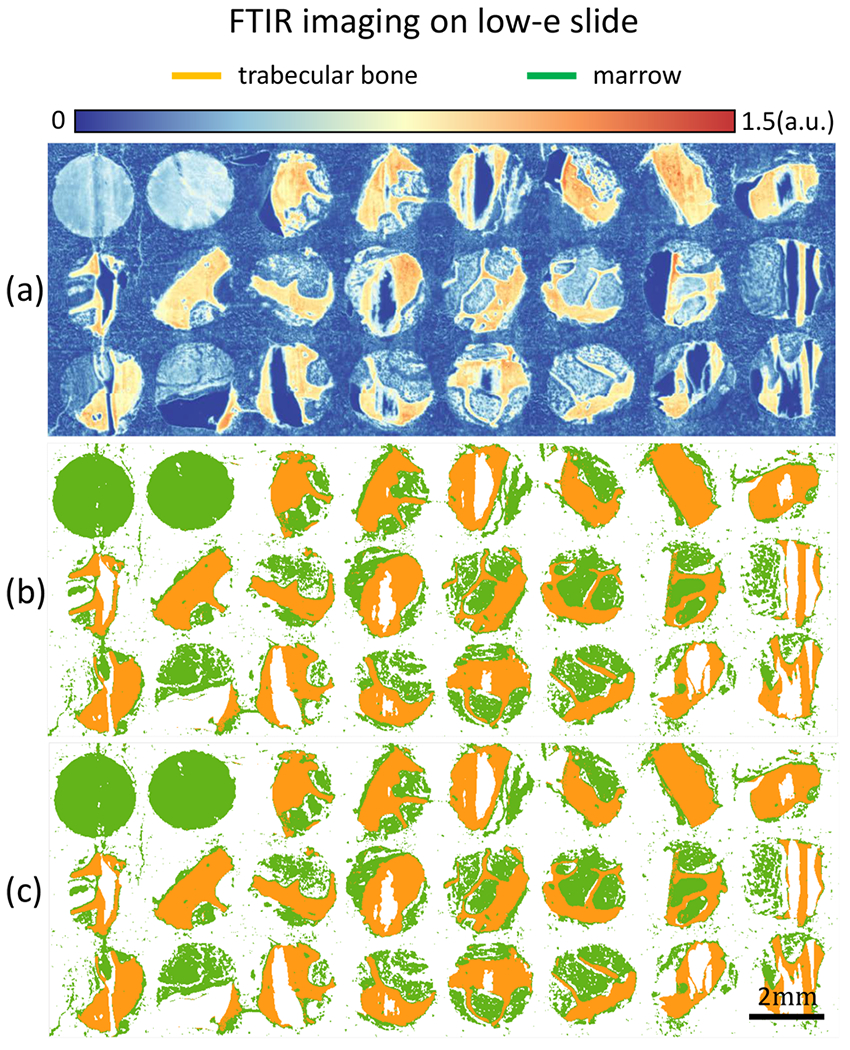
TMA of bone marrow tissue cores is imaged with FT-IR on low-emissivity coated glass slide. (a) Band image at 1650 cm−1. (b) Classification results for two classes of trabecular bone and marrow (everything in BM other than trabecular bone) of bone marrow tissue core using the entire 187 features. (c) Classification results using the 5 optimal features selected using the GA-LDA algorithm.29
Figure 5.
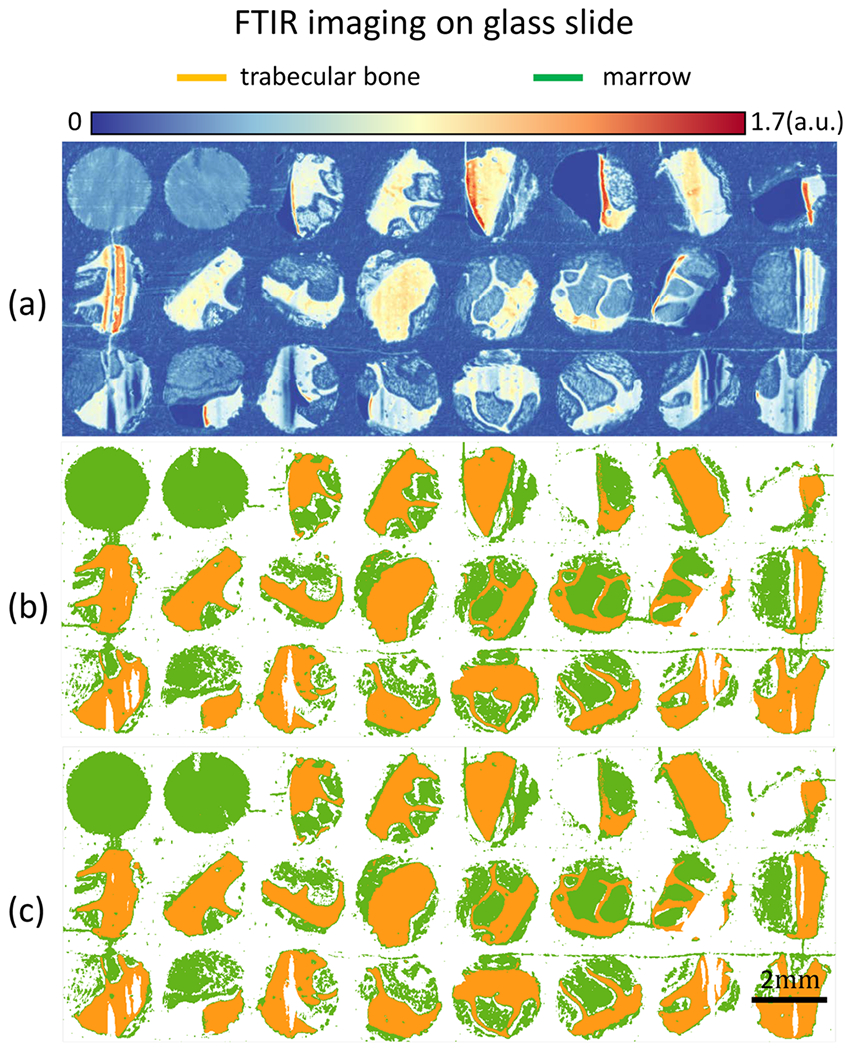
TMAs of bone marrow tissue cores are imaged with FT-IR glass slides. (a) FT-IR band image at 3300 cm−1. (b) Classification results for trabecular bone and marrow (everything in BM other than trabecular bone) using all 76 spectral features in glass transmission region. (c) Classification results using the 5 optimal features selected using the GA-LDA algorithm.29
Optimal Feature Selection for DFIR Imaging.
Our previous FT-IR studies show that a minimal number of optimal features are sufficient for classification of most of the histological classes.29 Optimal feature selection corresponding to histological classes provides the potential for future discrete-frequency imaging methods. With prior knowledge of these features, imaging time and file size can be dramatically reduced with new laser-based imaging systems.35 The GA-LDA algorithm29 was used to select five optimal bands (Figure 3) before classification (Figures 4c and 5c). In cases of imaging on both Low-E and glass slides, comparable results were achieved using only five features, likely because spectral features between histological classes were very distinct. This suggests that a minimal number of bands from either the fingerprint or functional group regions are sufficient. However, currently available commercial DFIR instruments only operate in the fingerprint region, removing the possibility for discrete frequency imaging but potentially increasing imaging speed by ~20×.
Optical photothermal infrared (O-PTIR) imaging provides another method for acquiring fingerprint spectra on standard glass substrates. While O-PTIR imaging systems are still relatively new, they provide significantly better resolution than FT-IR and DFIR systems at the cost of acquisition speed.
Osteosclerosis Grading on Clinical Samples.
Our study of clinical osteosclerosis grading is retrospective. BM tissue sections were acquired from 5 patients for each grading and imaged using FT-IR. Five features were selected using GA-LDA,29 and a Random Forest classifier was applied to identify trabecular bone (Figures 6 and 7). Adjacent sections of tissue were stained using H&E for pathological comparison. Osteosclerosis results are shown for 19 of 20 samples, as one of the samples of grade 2 exhibited fragmented trabecular bone and was removed from the study based on standard guidelines. A pixel-level Random Forest (RF) is used to differentiate relevant histological classes based on individual absorbance spectra acquired from infrared hyperspectral images of tissue biopsies (Figure 7). The RF classifier is trained using 16 000 spectra acquired from independent TMAs. The trained RF was then used to perform semantic segmentation of clinical biopsies into the corresponding histological classes. Spatially based morphological features are extracted from the segmented images. LDA is then used to grade both osteosclerosis (Figure 8) and collagen deposition (Figure 12) for each image based on these morphological features. RF classification accuracy is 99.6% with 99.4% sensitivity and 99.9% specificity.
Figure 6.
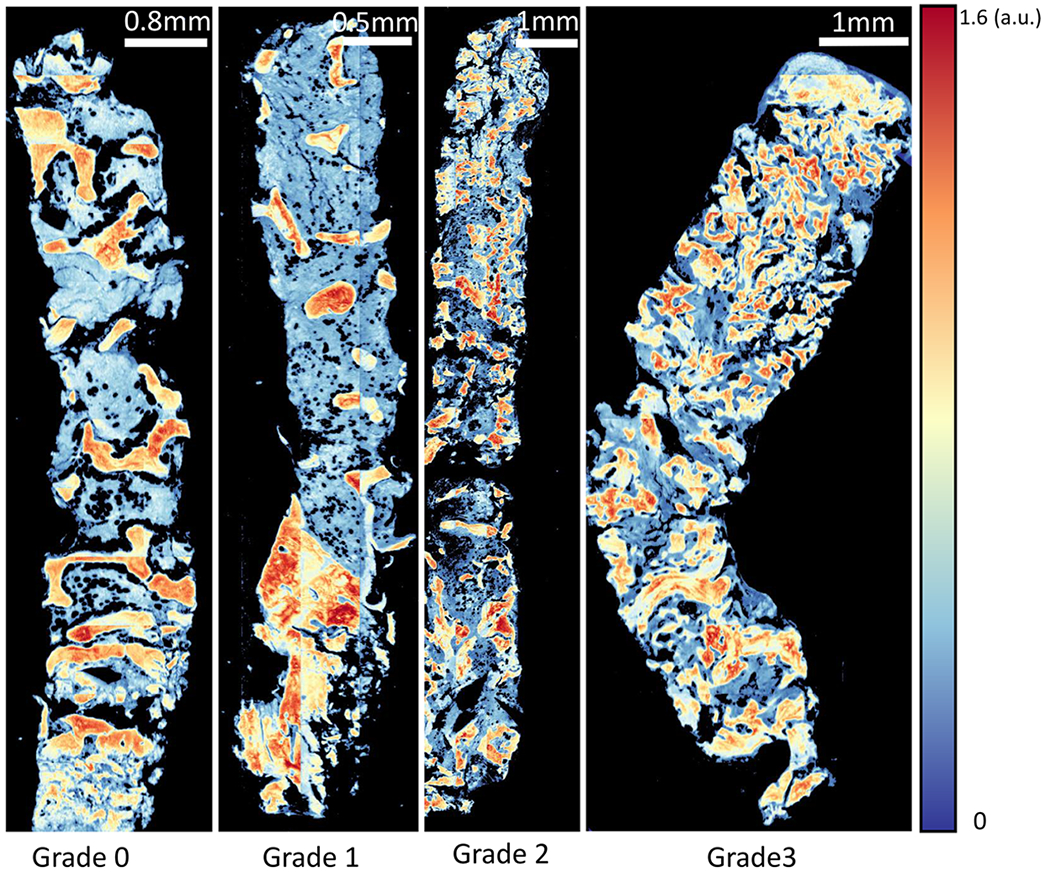
Proposed method of imaging. Trabecular bone area measurement is applied on clinical samples of bone marrow biopsy example from each osteosclerosis grade (0–3). FT-IR imaged tissue at 1650 cm−1 wavenumber is shown for each grade.
Figure 7.
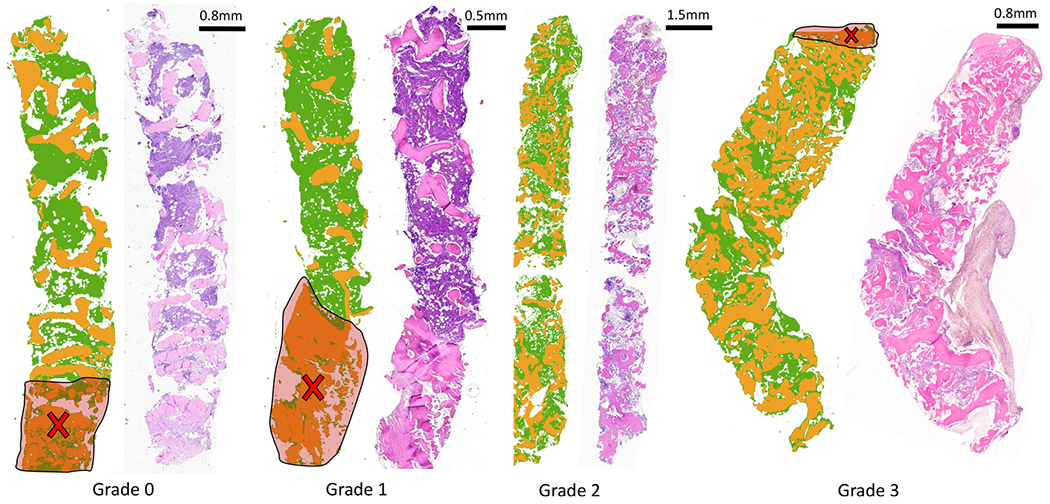
Classification result from the proposed imaging method, visually compared with traditional H&E stain. Trabecular bone area measurement is applied on clinical samples of bone marrow biopsy from each osteosclerosis grade (0–3). Results of classification (trabecular bone in orange and stroma in green) of FT-IR imaged data for each grade section and corresponding H&E stained adjacent tissue section from the same tissue block (right) are shown. Increase in trabecular bone area from grade 0 to grade 3 can be easily quantified using digitally classified images shown in the middle for each section. Cross-marks shown on the images indicate crushing artifacts on the tissue that are ignored while grading tissue sections.
Figure 8.
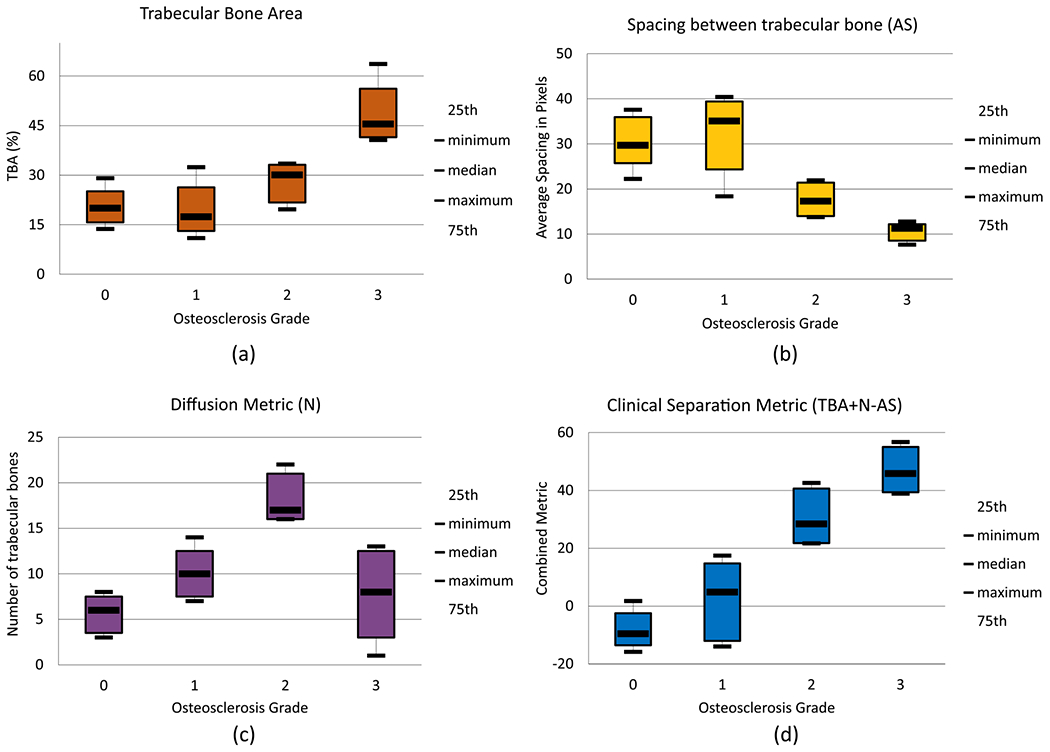
Box plots for the proposed metrics for automated osteosclerosis grading based on 19 tissue samples: (a) trabecular bone area (TBA), percentage of trabecular bone area with respect to total tissue area; (b) diffusion metric (N), count of nonfragmented trabecular bone structures contributing; (c) spacing between trabecular bone structures (AS), spacing defined in pixels where pixel size is 5.5 μm2; (d) clinical separation metric (CS), combination of three metrics mentioned earlier (TBA + N – AS), clearly separating samples into two groups, one with grades 0 and 1 samples and the other with grades 2 and 3 samples.
Figure 12.

Box plots for spatial features quantifying collagen deposition in bone marrow biopsies.
Box plots for our three proposed morphological/spatial features/metrics, along with combinations of these metrics, are shown (Figure 8). TBA% clearly separates grade 3 samples (Figure 8a) and is an important metric for assessing response to therapy for diseases such as leukemia.8 The diffusion metric (N) distinguishes grade 2 (Figure 8b) because the number of smaller and diffused trabecular bone structures increases from grade 0 to grade 2. In grade 3, irregularly grown trabeculae fuse together to form large structures. Regular spacing between trabeculae, which is an important characteristic of grades 0 and 1, is quantified using the average spacing (AS) metric (Figure 8c). Higher AS values are seen for grades 0 and 1, while lower AS is seen for grades 2 and 3. Two principal components were extracted from three metrics proposed for quantification of trabecular bone using principal component analysis (PCA). PCA loadings and variance explained for all principal components (PCs) are shown in Table 1; because the first two PCs explain 97.64% of variance, only two PCs are kept for biopsy grading. A scatter plot using two PCs (Figure 9) shows clusters of grades for biopsies. Clear decision boundaries can be seen for grades 2 and 3; however, separation between grades 0 and 1 is more challenging. Automated digital grading for 19 sections is achieved by classifying BM sections based on extracted features using LDA classifier. The grading accuracy using cross-validation on 19 μB samples is 84.4%. Given the variability of trabecular bone coverage in adjacent sections of grade 1 samples (i.e., Figure 7), it is possible that the discrepancies in grading are the result of sampling bias due to sectioning and therefore require further study.
Table 1.
PCA Loadings and Variance Explained (Last Row) for Spatial Features Extracted from Spectrally Classified Images of Bone Marrow for Osteosclerosis Grading
| PC1 | PC2 | PC3 |
|---|---|---|
| −0.629 | −0.106 | 0.769 |
| 0.112 | 0.967 | 0.226 |
| 0.769 | −0.229 | 0.597 |
| 63.20% | 34.44% | 2.34% |
Figure 9.
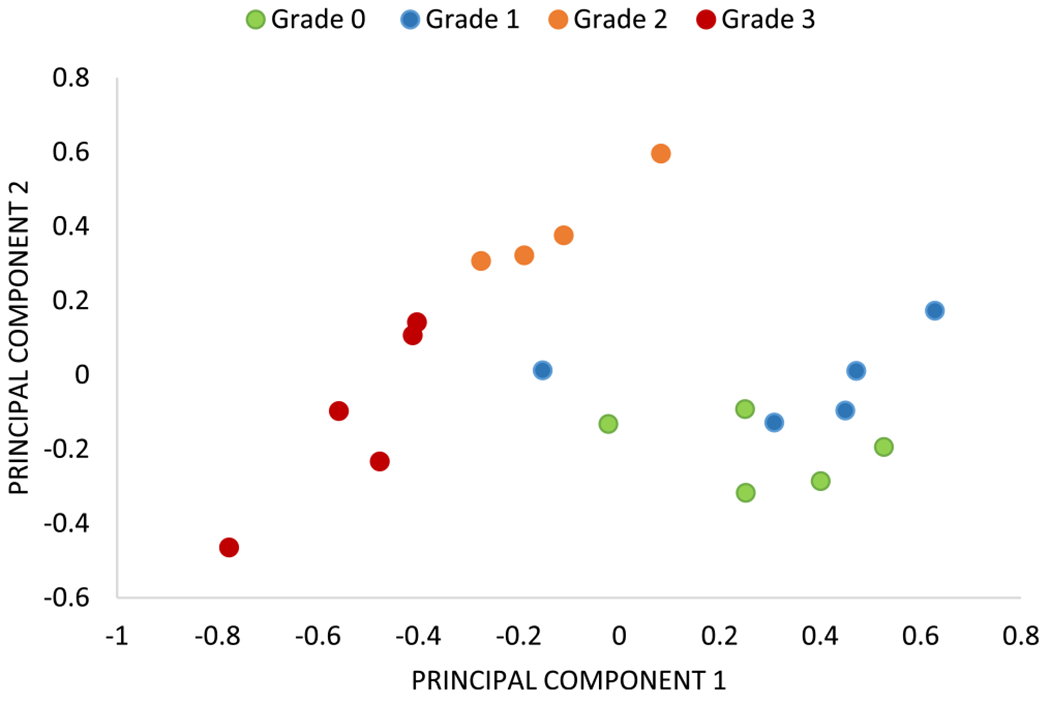
Scatter plot using the first two principal component scores (with variance explained 63.20% and 34.44%). Feature extraction from the proposed three metrics (TBA, AS, and N) gives clear separation among samples of each grade with the exception of a few samples from grades 0 and 1.
Collagen-Deposition Grading on Clinical Samples.
Differentiation of type I and type IV collagen (trabecular bone) requires spectral information from the fingerprint region.17 Conventional FT-IR imaging is therefore used for collagen-deposition grading. Because the spectral differences are subtle (Figure 10), BM images are collected at a spectral resolution of 4 cm−1 in reflection mode for collagen-deposition grading. Spectral classification for collagen-deposition grading is similar to one for osteosclerosis grading. Here, we classify hyperspectral images using RF classifier using only 16 optimal features out of total 674 features/bands selected by the GA-LDA feature-selection algorithm. We achieve an accuracy of 99.17% with 98.6% sensitivity and 99.2% specificity for spectral classification of three classes: type I collagen, trabecular bone, and hematopoietic cell. Spectral classification results are comparable to adjacent sections stained with Mason’s trichrome, as shown in Figure 11.
Figure 10.
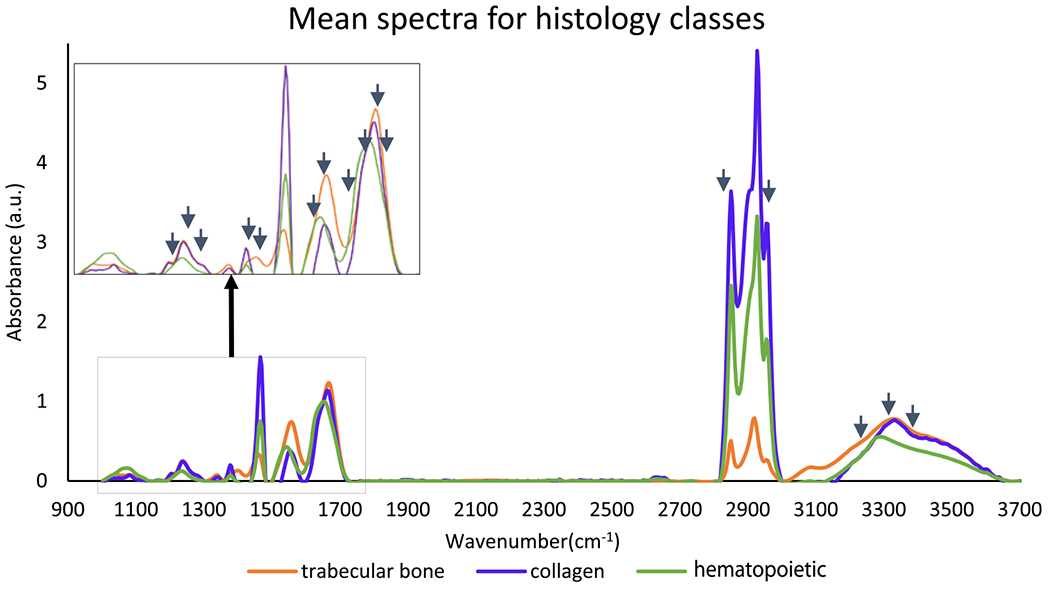
Mean absorbance IR spectra from preprocessed hyperspectral images of bone marrow biopsies for three histological classes: trabecular bone, collagen (type I), and hematopoietic cells. Arrows indicate optimal features selected using GA-LDA.
Figure 11.
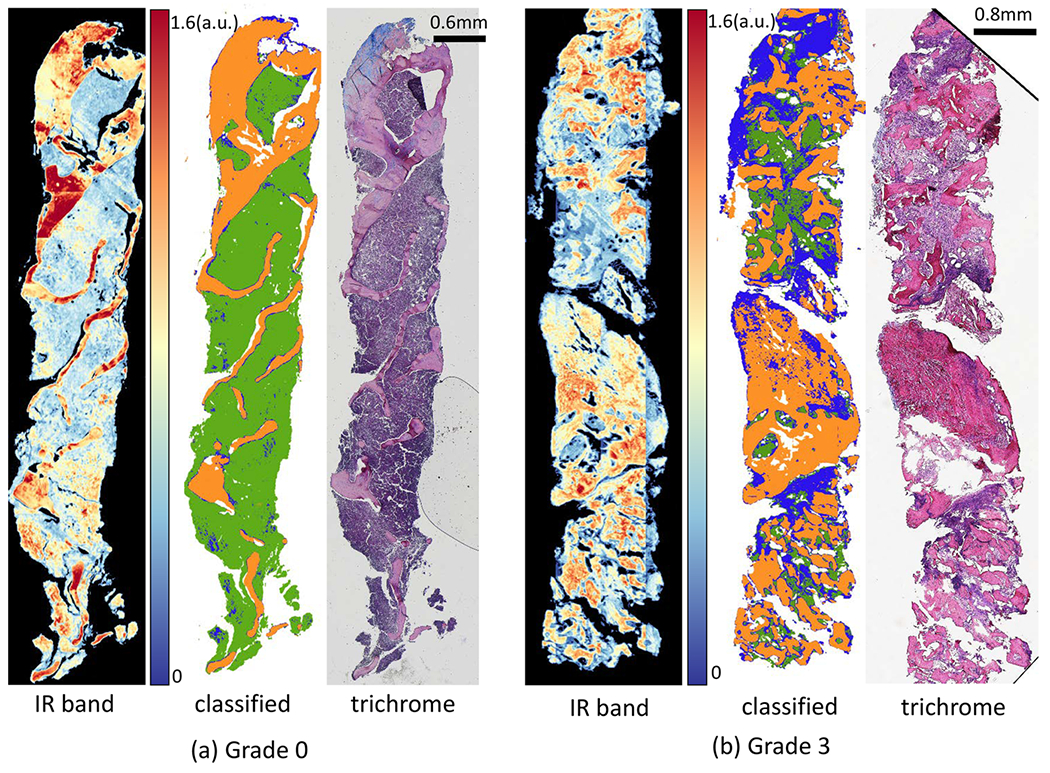
Classification results of FT-IR imaged data for two biopsies with two collagen-deposition grades: (a) grade 0 and (b) grade 3. For each biopsy, IR image at band 1650 cm−1, pixel-level classified image with 16 optimal features for type I collagen (blue), trabecular bone (orange), and hematopoietic (green), and corresponding Mason’s trichrome stained adjacent tissue section.
Results of spectral classification of biopsies (Figure 11) are then used for grading of collage deposition in the BM biopsies using morphological/spatial features extracted from these classified images. We score collagen deposition by calculating the percentage of collagen pixels and the size of the largest cluster. Box plots for both metrics (Figure 12) show the separability of grades 0 and 1 from grades 2 and 3. Integrating both metrics allows differentiation of grades 0 and 1 from grades 2 and 3 with 89.6% accuracy. However, the accuracy for classification for all four grades reduces to 50% because differentiating grade 0 from grade 1 and grade 2 from grade 3 requires greater spatial resolution than what is available with diffraction-limited FT-IR images.
CONCLUSION
This work shows the potential for quantitative bone biopsy grading using infrared spectroscopic imaging. Osteosclerosis grading can be performed on standard glass slides, providing the potential for integration into existing pathology pipelines. The most optimistic approach for clinical integration is likely IR-compatible substrates combined with DFIR imaging.35 Concurrence between pathologists is between 89.4% and 94.9% for osteosclerosis grading and between 84.6% and 91.3% for collagen-deposition grading.22 The proposed method achieves accuracies of 84.4% for osteosclerosis grading using 19 samples and 88.88% using 18 samples (by eliminating traditionally excluded artifacts). The accuracy for collagen-deposition grading is 50%, which increases to 89.6% when considering only grades 0/1 and 2/3. We believe that higher resolution would enable a better differentiation because pathologists rely on high-resolution collagen features to differentiate between these grades. This includes the shape and density of collagen fibers, which are insufficiently captured with 1.1–5.5 μm pixels
Spatial resolution introduces a critical limitation of infrared spectroscopic imaging for histological applications. While this is somewhat offset by molecular specificity, many applications critically rely on spatial features. In particular, automated reticulin grading will likely require spatial resolution comparable to standard optical microscopes, which can potentially be achieved using O-PTIR imaging systems.20,36
ACKNOWLEDGMENTS
This work was funded in part by the Cancer Prevention and Research Institute of Texas (CPRIT) no. RR140013, the National Heart, Lung, and Blood Institute no. R01HL146745, and the National Library of Medicine no. T15LM007093.
Footnotes
The authors declare no competing financial interest.
REFERENCES
- (1).Thiele J; Kvasnicka HM; Facchetti F; Franco V; van der Walt J; Orazi A Haematologica 2005, 90, 1128–1132. [PubMed] [Google Scholar]
- (2).Swerdlow S; Campo E; Harris N; Jaffe E; Pileri S; Stein H; Thiele J; Arber D; Hasserjian R; Le Beau M; Orazi A; Siebert R WHO Classification of Tumours of Haematopoietic and Lymphoid Tissues, 4th ed.; IARC: 2017; Vol. 2. [Google Scholar]
- (3).Teman CJ; Wilson AR; Perkins SL; Hickman K; Prchal JT; Salama ME Leuk. Res 2010, 34, 871–876. [DOI] [PMC free article] [PubMed] [Google Scholar]
- (4).Hipp J; Flotte T; Monaco J; Cheng J; Madabhushi A; Yagi Y; Rodriguez Canales J; Emmert-Buck M; Dugan MC; Hewitt S; Toner T; Tompkins R; Lucas D; Gilbertson J; Balis UJ J. Pathol. Inform 2011, 2, 25. [DOI] [PMC free article] [PubMed] [Google Scholar]
- (5).Veta M; Pluim JP; Van Diest PJ; Viergever MA IEEE Trans. Biomed. Eng 2014, 61, 1400–1411. [DOI] [PubMed] [Google Scholar]
- (6).Snead DRJ; Tsang Y-W; Meskiri A; Kimani PK; Crossman R; Rajpoot NM; Blessing E; Chen K; Gopalakrishnan K; Matthews P; Momtahan N; Read-Jones S; Sah S; Simmons E; Sinha B; Suortamo S; Yeo Y; El Daly H; Cree IA Histopathology 2016, 68, 1063–1072. [DOI] [PubMed] [Google Scholar]
- (7).Webster JD; Dunstan RW Vet. Pathol 2014, 51, 211–223. [DOI] [PubMed] [Google Scholar]
- (8).Hoehn D; Medeiros LJ; Kantarjian HM; Cortes JE; Wang X; Bueso-Ramos CE Hum. Pathol 2012, 43, 2354–2359. [DOI] [PMC free article] [PubMed] [Google Scholar]
- (9).Berman E; Nicolaides M; Maki RG; Fleisher M; Chanel S; Scheu K; Wilson B-A; Heller G; Sauter NP N. Engl. J. Med 2006, 354, 2006–2013. [DOI] [PubMed] [Google Scholar]
- (10).Old O; Lloyd G; Nallala J; Isabelle M; Almond L; Shepherd N; Kendall C; Shore A; Barr H; Stone N Analyst 2017, 142, 1227–1234. [DOI] [PubMed] [Google Scholar]
- (11).Mayerich DM; Walsh M; Kadjacsy-Balla A; Mittal S; Bhargava R Proc. SPIE 2014, 904107. [Google Scholar]
- (12).Benard A; Desmedt C; Smolina M; Szternfeld P; Verdonck M; Rouas G; Kheddoumi N; Rothé F; Larsimont D; Sotiriou C; Goormaghtigh E Analyst 2014, 139, 1044–1056. [DOI] [PubMed] [Google Scholar]
- (13).Baker MJ; Gazi E; Brown MD; Shanks JH; Gardner P; Clarke NW Br. J. Cancer 2008, 99, 1859–1866. [DOI] [PMC free article] [PubMed] [Google Scholar]
- (14).Bassan P; Sachdeva A; Shanks JH; Brown MD; Clarke NW; Gardner P Pros. SPIE 2014, 90410D–90416D. [Google Scholar]
- (15).GroBerueschkamp F; Kallenbach-Thieltges A; Behrens T; Bruning T; Altmayer M; Stamatis G; Theegarten D; Gerwert K Analyst 2015, 140, 2114–2120. [DOI] [PubMed] [Google Scholar]
- (16).Simsek Ozek N; Tuna S; Erson-Bensan AE; Severcan F Analyst 2010, 135, 3094–3102. [DOI] [PubMed] [Google Scholar]
- (17).Belbachir K; Noreen R; Gouspillou G; Petibois C Anal. Bioanal. Chem 2009, 395, 829–837. [DOI] [PubMed] [Google Scholar]
- (18).Hammiche A; Pollock H; Reading M; Claybourn M; Turner P; Jewkes K Appl. Spectrosc 1999, 53, 810–815. [Google Scholar]
- (19).Li Z; Aleshire K; Kuno M; Hartland GVJ J. Phys. Chem. B 2017, 121, 8838–8846. [DOI] [PubMed] [Google Scholar]
- (20).Reffner JA Spectroscopy 2018, 33, 12–17. [Google Scholar]
- (21).Wilkins BS; Erber WN; Bareford D; Buck G; Wheatley K; East CL; Paul B; Harrison CN; Green AR; Campbell PJ Blood 2008, 111, 60–70. [DOI] [PubMed] [Google Scholar]
- (22).Kvasnicka HM; Beham-Schmid C; Bob R; Dirnhofer S; Hussein K; Kreipe H; Kremer M; Schmitt-Graeff A; Schwarz S; Thiele J; Werner M; Stein H Histopathology 2016, 68, 905–915. [DOI] [PubMed] [Google Scholar]
- (23).Kuter DJ; Bain B; Mufti G; Bagg A; Hasserjian RP Br. J. Haematol 2007, 139, 351–362. [DOI] [PubMed] [Google Scholar]
- (24).Yagi Y Diagn. Pathol 2011, 6, S15. [DOI] [PMC free article] [PubMed] [Google Scholar]
- (25).Walsh MJ; Mayerich D; Kajdacsy-Balla A; Bhargava R Proc. SPIE 2012, 82190R. [Google Scholar]
- (26).Tiwari S; Bhargava R Yale J. Biol. Med 2015, 88, 131–143. [PMC free article] [PubMed] [Google Scholar]
- (27).Frost J; Ludeman L; Hillaby K; Gornall R; Lloyd G; Kendall C; Shore AC; Stone N Anal. Methods 2016, 8, 8452–8460. [DOI] [PubMed] [Google Scholar]
- (28).Wrobel TP; Bhargava R Anal. Chem 2018, 90, 1444–1463. [DOI] [PMC free article] [PubMed] [Google Scholar]
- (29).Mankar R; Walsh M; Bhargava R; Prasad S; Mayerich D Analyst 2018, 143, 1147–1156. [DOI] [PMC free article] [PubMed] [Google Scholar]
- (30).Bassan P; Mellor J; Shapiro J; Williams KJ; Lisanti MP; Gardner P Anal. Chem 2014, 86, 1648–1653. [DOI] [PubMed] [Google Scholar]
- (31).Fernandez DC; Bhargava R; Hewitt SM; Levin IW Nat. Biotechnol 2005, 23, 469–474. [DOI] [PubMed] [Google Scholar]
- (32).Baker MJ; Trevisan J; Bassan P; Bhargava R; Butler HJ; Dorling KM; Fielden PR; Fogarty SW; Fullwood NJ; Heys KA; Hughes C; Lasch P; Martin-Hirsch PL; Obinaju B; Sockalingum G; Sulé-Suso J; Strong RJ; Walsh MJ; Wood BR; Gardner P; Martin FL Nat. Protoc 2014, 9, 1771–1791. [DOI] [PMC free article] [PubMed] [Google Scholar]
- (33).Pilling MJ; Henderson A; Shanks JH; Brown MD; Clarke NW; Gardner P Analyst 2017, 142, 1258–1268. [DOI] [PubMed] [Google Scholar]
- (34).Baker MJ; Byrne HJ; Chalmers J; Gardner P; Goodacre R; Henderson A; Kazarian SG; Martin FL; Moger J; Stone N; Sule-Suso J Analyst 2018, 143, 1735–1757. [DOI] [PubMed] [Google Scholar]
- (35).Kuepper C; Kallenbach-Thieltges A; Juette H; Tannapfel A; Groβerueschkamp F; Gerwert K Sci. Rep 2018, 8, 7717. [DOI] [PMC free article] [PubMed] [Google Scholar]
- (36).Zhang D; Bai Y; Cheng J-X Photonics Media 2018. https://www.photonics.com/Articles/Photothermal_IR_Spectroscopy_Boosts_Chemical/a63804


