

Abstract
Difficulties with higher-order cognitive functions in youth are a potentially important vulnerability factor for the emergence of problematic behaviors and a range of psychopathologies. This study examined 2013 9–10 year olds in the first data release from the Adolescent Brain Cognitive Development 21-site consortium study in order to identify resting state functional connectivity patterns that predict individual-differences in three domains of higher-order cognitive functions: General Ability, Speed/Flexibility, and Learning/Memory. For General Ability scores in particular, we observed consistent cross-site generalizability, with statistically significant predictions in 14 out of 15 held-out sites. These results survived several tests for robustness including replication in split-half analysis and in a low head motion subsample. We additionally found that connectivity patterns involving task control networks and default mode network were prominently implicated in predicting differences in General Ability across participants. These findings demonstrate that resting state connectivity can be leveraged to produce generalizable markers of neurocognitive functioning. Additionally, they highlight the importance of task control-default mode network interconnections as a major locus of individual differences in cognitive functioning in early adolescence.
Introduction
Adolescence is a time of major physical, cognitive, and psychosocial change. It is also a time of great vulnerability for the emergence of maladaptive behavioral patterns and psychopathologies [1], which can cascade into poorer mental and physical health throughout adulthood. A major task for clinical neuroscience is to identify pre-morbid features that place the child at elevated risk for future adverse outcomes.
One major risk factor for adolescent psychopathology is difficulty with higher-order cognitive functions, which encompass a diverse set of abilities for reasoning and problem solving, cognitive control, mental flexibility, and learning/recalling information [2–5]. Difficulties with higher-order cognitive functions have been associated with a number of disorders, including both externalizing-spectrum disorders (e.g., substance use disorders and attention-deficit/hyperactivity disorder) [6–8] as well internalizing disorders (e.g., depression and anxiety) [9–11]. The generality of these associations has led to the interesting suggestion that deficits in some kinds of higher-order cognitive functions (e.g., cognitive control) represent transdiagnostic vulnerability factors for psychopathology [12–14].
Concurrently, there is great interest in the neural underpinnings of higher-order cognitive functions [15], and in developing predictive models of these functions based on resting state connectivity [16–18]. Emerging network models focus on interrelationships between brain networks involved in active control of task processing [19, 20] and default mode network (DMN). Task control networks include frontoparietal network (FPN), cingulo-opercular (CO) network, and dorsal attention network (DAN), involved in top-down control [21, 22], as well as salience network (SAL) and ventral attention network (VAN), important for detection of unexpected events and ongoing monitoring [23, 24]. DMN—active in task-free states and implicated in spontaneous thought, evaluation, and memory [25, 26]—works in both cooperative and antagonistic ways with task control networks [27–30]. Higher-order cognitive functions are thought to rely on a complex interplay between this set of networks, in which task control networks supply top-down regulatory signals that modulate spontaneous processing unfolding in association cortices within DMN [19, 31].
Importantly, from early childhood to young adulthood, there is extensive development of functional interconnections between task control networks and DMN [32–34], suggestive of growing informational exchange and maturing top-down regulatory relationships. These observations raise an intriguing question about whether differences in connectivity patterns among these networks during youth are predictive of differences in higher-order cognitive functioning.
The present study investigates this question leveraging the first data release from the Adolescent Brain Cognitive Development (ABCD) national consortium study, which will comprehensively characterize a cohort of over 11,000 adolescents using behavioral, psychosocial, and neuroimaging measures over the course of 10 years. To accomplish this goal, data are collected from 21 sites nationwide. The baseline assessment of the study cohort has recently been completed, and utilized a number of behavioral tasks that probe multiple aspects of higher-order cognitive functions [35]. Previous work by Thompson and colleagues on 4521 youth from the first release of baseline ABCD data distinguished three major higher-cognitive domains: General Ability, Speed/Flexibility, and Learning/Memory that explained a substantial portion of the variance in behavioral measures [36].
The present work examines links between neurocognitive scores for these domains and resting state brain connectivity patterns. We first produced resting state connectomes for each subject, using stringent methods to control for the effects of head motion, a potentially serious confound in resting state studies [37]. In a sample of 2013 subjects who met quality control and other inclusion criteria, we next applied a recently developed multivariate predictive modeling method, brain basis set (BBS) [38, 39]. This method takes advantage of the fact that though functional connectomes are large and complex, encompassing tens of thousands of connections, there is massive redundancy in the set of connections that differ across people. This allows a small set of components—we used 75 in the present study—to capture most meaningful inter-individual variation in connectomes [38, 39]. We coupled BBS with leave-one-site-out cross-validation to guard against identifying spurious relationships and to provide evidence of generalizability. We demonstrate that resting state connectivity patterns yield robust, generalizable predictions of scores in the General Ability neurocognitive domain, with variation in connections within and between task control networks and DMN playing an especially prominent role in individual-differences.
Results
In leave-one-site out cross-validation analysis, resting state functional connectivity patterns are associated with neurocognition
We applied BBS to separately train predictive models for each of the three neurocognitive component scores and tested these predictive models in a leave-one-site out cross-validation framework. We observed statistically significant correlations between actual versus predicted neurocognitive scores, averaging across folds of the cross-validation, for all three neurocognitive scores, with the strongest results observed for General Ability (Table 1, row 1).
Table 1.
Summary of analyses
| Analysis | General Ability | Speed/flexibility | Learning/memory |
|---|---|---|---|
| 1. Main (leave-one-site-out) | r = 0.31; p <0.0001* | r = 0.06; p = 0.02 | r = 0.15; p <0.0001* |
| 2. Demographic controls | r = 0.29; p <0.0001* | r = 0.05; p = 0.11 | r = 0.10; p = 0.01 |
| 3. Split-half - train 1, test 2 | r = 0.30; p < 1 × 10⁻⁶ | r= 0.05; p= 0.10 | r = 0.12; p <0.0001* |
| 4. Split-half - train 2, test 1 | r = 0.33; p < 1 × 10⁻⁶ | r = 0.09; p = 0.005 | r = 0.15; p <1× 10⁻⁶ |
| 5. Low motion, 75 subj. min | r = 0.30; p <0.0001* | r = 0.04; p = 0.27 | r = 0.01; p = 0.58 |
| 6. Low motion, 50 subj. min | r = 0.30; p <0.0001* | r = 0.02; p = 0.64 | r = 0.04; p = 0.22 |
Predictive models for General Ability produced highly statistically significant results in the main leave-one-site-out analysis (row 1), and these results were stable across a number of stringent robustness checks (rows 2–6). P values were calculated by permutation methods for all analyses except the split half analyses, which employ standard parametric statistics. Bold values indicate statistically significant at p < 0.05;
observed correlation was higher than all 10,000 correlations in the permutation distribution
Predictive models for General Ability scores specifically demonstrate strong cross-site generalizability and are robust to potential confounds
Figure 1 shows the results of BBS-based predictive models for each neurocognitive domain on a per site basis. For General Ability, results were consistent across sites, with statistically significant correlations between predicted and actual scores achieved in 14 out of 15 held-out sites (all p values < 0.05). For the other two neurocognitive scores, results were more inconsistent, with statistically significant results observed in 2 of 15 held out sites for speed/flexibility and 7 out of 15 sites for learning/memory.
Fig. 1.

Per-site results of predictive models. We built multivariate models for predicting participants’ neurocognitive scores and tested these models with leave-one-site-out cross-validation across 15 sites. Predictive models for the General Ability neurocognitive domain exhibited particularly strong generalization across sites
We next performed a number of additional analyses to assess the robustness of the predictive models for the three neurocognitive domains. First, we included a number of covariates in the BBS models, including age, gender, race/ethnicity, highest parental education, household marital status, and household income. In leave-one-site-out analysis, correlations between actual versus predicted neurocognitive scores remained statistically significant for General Ability and Learning/Memory, but not Speed/Flexibility (Table 1, row 2).
Second, we performed a split-half analysis using the exact splits used by Thompson and colleagues [36] in their original validation of the three neurocognitive domains. In their analysis, Bayesian PCA was trained on each of the splits and the learned factor structure was used to derive neurocognitive scores for the other split. By using their splits, we were able to assess prediction of neurocognitive scores when these scores are learned in an entirely independent sample. We found that the split-half analysis yielded predictions of neurocognitive scores that at were highly similar to our main leave-one-site-out results (Table 1, rows 3 and 4).
Third, we examined the robustness of our results with respect to head motion. We first identified a subset of subjects with ultra-low head motion (mean FD < 0.2). From this subset, we excluded subjects from sites with less than 75 subjects, leaving 547 subjects in 5 sites. In this subsample, motion had virtually no remaining relationship with neurocognitive scores (correlations between motion and the three neurocognitive scores were, respectively, 0.006, 0.009, −0.001; all p’s > 0.84). In leave-one-site-out analysis, General Ability results remained similar in size and highly statistically significant, but Speed/Flexibility and Learning/Memory were no longer statistically significant (Table 1, row 5). We then re-ran the analysis with the site size threshold lowered to 50 subjects. This analysis involved 906 subjects across 11 sites (correlations between motion and the three neurocognitive scores were, respectively, −0.05, −0.03, −0.01; all p’s > 0.15). Leave-one-site-out analysis again revealed similarly strong results for General Ability, but Speed/Flexibility and Learning/Memory remained statistically insignificant (Table 1, row 6).
The preceding analyses demonstrate that results for General Ability are generalizable across sites and robust to a number of potential confounds including demographic covariates and head motion. In contrast, correlations for Speed/Flexibility and Learning/Memory were smaller in the main analysis and did not survive one or more subsequent robustness checks.
Connections within and between task control networks and DMN play a prominent role in prediction of General Ability scores
Figure 2 displays a consensus map that highlights connections that were weighted more heavily in predictive models for General Ability. Connections within and between task control networks and DMN are notably prominent in this map. More precisely, we use the term “task control-DMN intersection” to refer to: (i) connections within a task control network; (ii) connections within DMN, and (iii) connections that link a task control network node with a DMN node. Such connections represent roughly 20% of the total number of connections (6754 out of 34716 total) in the connectome. They represent, however, 43% of the suprathreshold connections in the consensus map for General Ability (Fig. 2, where a z = 2 threshold is used).
Fig. 2.
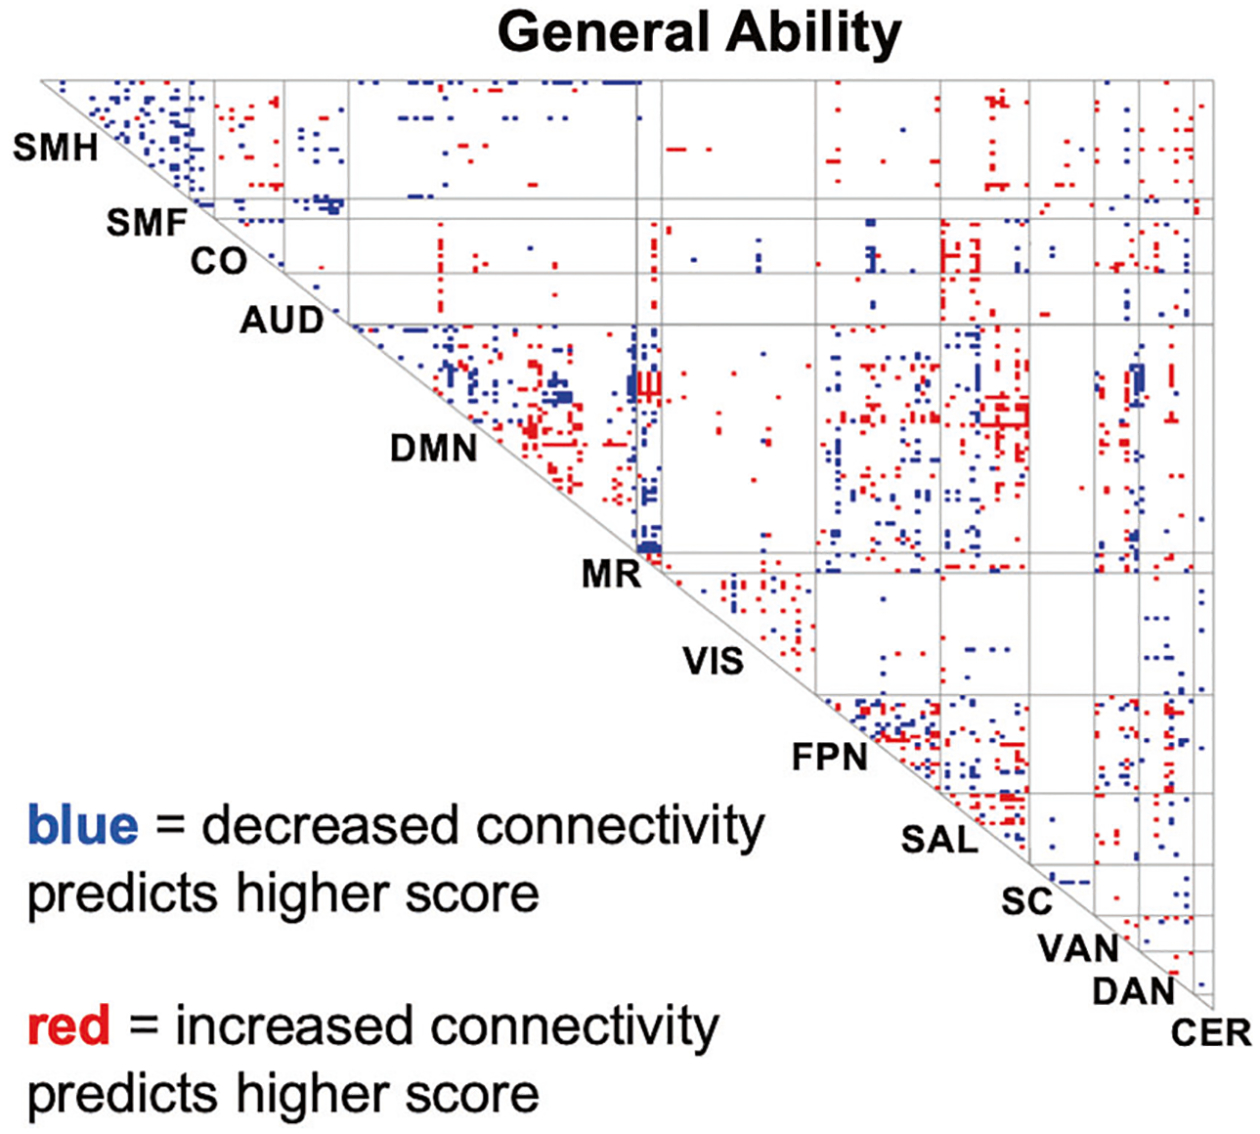
Consensus maps of connections that are predictive of general ability scores. Our predictive model for General Ability neurocognitive scores yielded reliable predictions across held out sites. Visualization of the predictive model reveals that connections in task control networks and DMN are especially well represented. SMH somatomotor-hand, SMF somatomotor-faces, CO cingulo-opercular, AUD auditory, DMN default mode network, MR memory retrieval, VIS visual, FPN fronto-parietal, SAL salience, SC subcortical, VAN ventral attention, DAN dorsalattention, CER cerebellum
To further assess the importance of connections in the task control-DMN intersection, we dropped all connections outside this intersection and redid our BBS-based predictive modeling. The correlation between actual versus predicted neurocognitive scores, averaging across folds of the cross-validation, were: General Ability r = 0.26 (permutation p value < 0.0001, i.e., observed correlation was higher than all 10,000 correlations in the permutation distribution).
We in addition assessed whether predictions for General Ability were better than could be achieved using 1000 randomly selected sets of six networks that excluded DMN and the five task control networks. Results showed that our observed prediction success using the task control-DMN intersection exceeded all 1000 values when these networks were excluded. Finally, we examined prediction of General Ability scores retaining just two networks, and we computed summary statistics that quantify the importance of each network (Fig. 3). We found that DMN and frontoparietal network emerged as the top two most important networks, with other task control networks (e.g., salience network and dorsal attention network) also showing high importance.
Fig. 3.
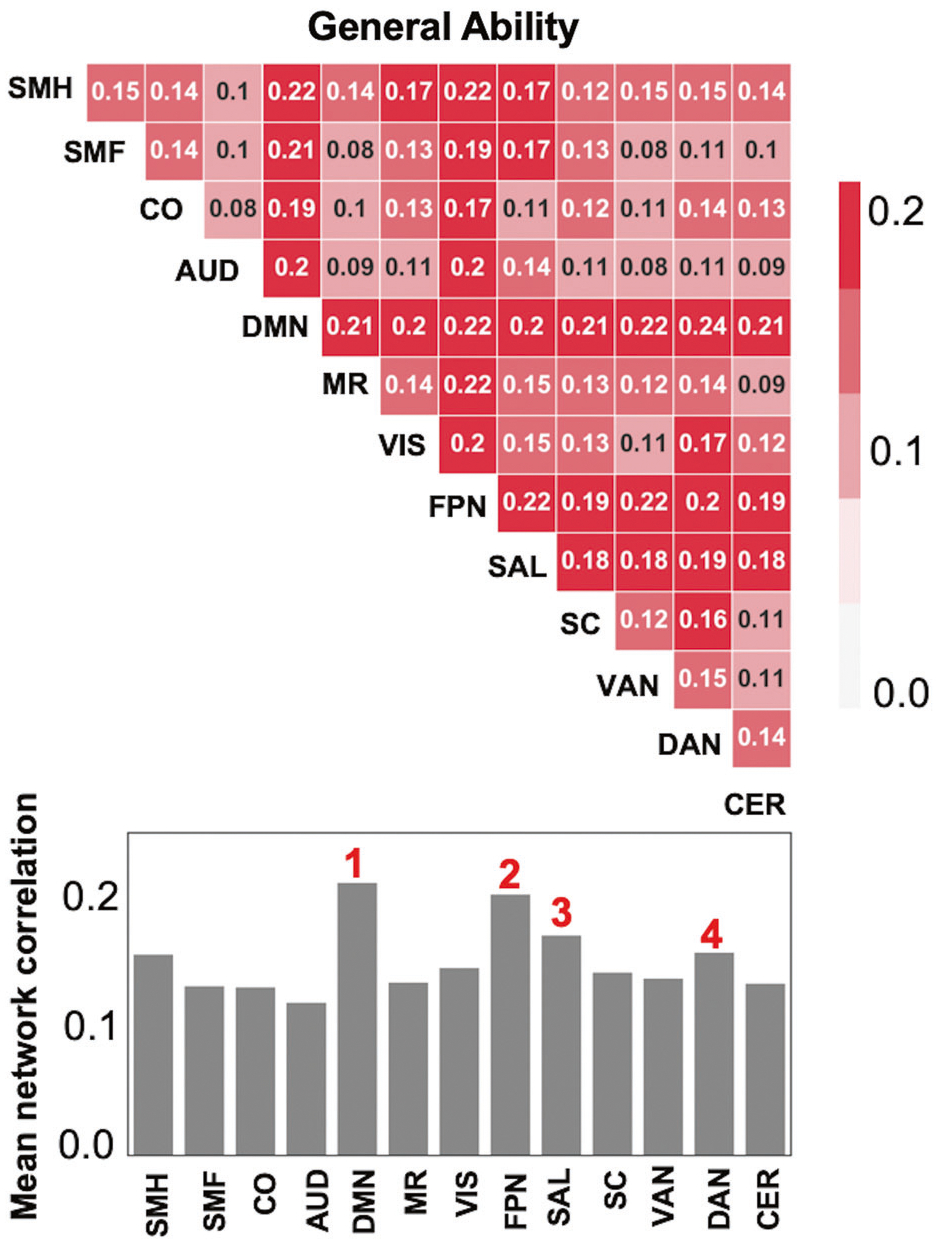
Prediction of general ability neurocognitive scores with two networks. To assess the importance of specific networks for the success of the BBS predictive models for General Ability, we trained new BBS models with just two networks (top row). We also calculated the mean performance for each network (bar graphs in bottom row). Values indicate correlations between actual and predicted scores, averaged across folds of the cross-validation analysis. These analyses revealed prominent roles for DMN as well as three task control networks: FPN, SN, and DAN. SMH somatomotor-hand, SMF somatomotor-faces, CO cingulo-opercular, AUD Auditory, DMN default mode network, MR memory retrieval, VIS visual, FPN fronto-parietal, SAL salience, SC subcortical, VAN ventral attention, DAN dorsal attention, CER cerebellum
Discussion
This study examines behavioral and imaging data from 9 to 10 year old participants in the ABCD Consortium study whose data were included in the first data release [35, 40]. Using a multivariate predictive modeling approach, we sought to identify resting state connectivity patterns that are predictive of three major domains of higher-order cognitive functions: General Ability, Speed/Flexibility, and Learning/Memory. Our first main finding is that resting state connectivity patterns yield predictions for scores in the General Ability neurocognitive domain that are generalizable across sites and robust to potential confounds. Our second main finding is that connections within and between task control networks and DMN are particularly important for individual-differences in the General Ability domain. There is a critical window in mid-adolescence when youth start experimenting with substances and a number of serious mental illnesses have their onset [1]. Our findings elucidate a neural basis for higher-order cognitive functions in youth prior to entering this window, and could potentially inform efforts at earlier detection and more tailored interventions for vulnerable youth.
Resting state fMRI has emerged as a leading method for mapping the brain’s intrinsic network architecture [41–43] and predicting individual differences in phenotypes [44, 45]. An important open question has been whether predictive models based on resting state connectivity patterns trained in one dataset can effectively generalize to unseen data, in particular when the unseen data is collected at a different sites using different MRI scanners. Results observed with General Ability scores—statistically significant predictions in 14 out of 15 held-out sites—demonstrate that successful generalization using imaging data from unseen sites and scanners can indeed be achieved. Moreover, the size of the effect (roughly 10% of the variance in General Ability scores, a potentially clinically meaningful amount) and the robustness of the effect (correlations are nearly unchanged after extensive demographic controls and restriction to an ultra-low motion subsample) suggest that resting state connectomes hold promise as objective measures of at least some components of neurocognition.
In contrast, for the other two neurocognitive domains, Speed/Flexibility and Learning/Memory, effect sizes were much smaller, results were not generalizable across sites, and results did not survive robustness checks involving demographic covariates and head motion. In explaining this result, it is possible that these two neurocognitive domains do not have sizable signatures in resting state connectomes, or that the BBS classifiers used for the present analysis are not sensitive to their signatures, or a combination of both. For example, if resting state signatures of these neurocogntive domains are mainly localized in small, spatially discrete structures (e.g., the caudate nucleus or the hippocampus), classifiers that rely on distributed whole-connectome information, including the BBS method used in the present report, will be unlikely to recover them. In future studies, alternative classifiers (e.g., supervised methods), modalities (e.g., task-based methods), or search strategies (e.g., regions of interest approaches) could be utilized.
For the General Ability neurocognitive domain, we found that connections involving task control networks and DMN played a disproportionate role in explaining the success of BBS predictive models. This finding can potentially be interpreted in terms of recent theories of adaptive task control [19, 46]. These accounts propose that task control networks modulate activity in distributed brain regions to facilitate cognitive control during complex tasks. In addition, a number of lines of evidence point to the DMN as an important target of these top-down adaptive control signals. Modulation of the DMN is required in cases where task control networks must cooperate with DMN for coordinated processing, such as during complex problem-solving and prospective decision-making [27–29]. It is also required to avoid interference by DMN [30] during externally focused, cognitively demanding tasks, with inadequate regulation of the DMN by task control networks sometimes leading to impaired task performance [47, 48].
It is notable that previous cross-sectional studies provide evidence that connections involving task control networks and DMN exhibit substantial maturation during youth [32–34, 49, 50]. The DMN initially takes shape as early as the fetal period [51], and, in addition, there is apronounced increase in intra-DMN connectivity from early childhood to the mid-20’s [34, 49]. During this time, DMN also segregates from certain task control networks, especially DAN and VAN, though there is substantial fine-grained variation across nodes in the respective networks in terms of where segregation is observed [33, 34]. Given these observations of substantial maturational changes in task control-DMN interconnections, a major strength of the ABCD study is that it will let us examine these same children through adolescence over the next 10 years, allowing us to address a number of critical open questions.
For example, we do not currently know the natural history of the connectomic differences we observed in task control networks and DMN that are associated with reduced higher-order cognitive functions in early adolescence. That is, are these connectivity differences ones that tend to “catch-up”, ones that stay consistently behind, or ones that increasingly deviate from normative trajectories (i.e., get worse) across age [52, 53]? Longitudinal data will also support stronger inferences about causality. For example, it will be possible to assess whether changes in connectivity patterns within a child over time predict changes in higher-order cognitive functions and associated mental health outcomes in that individual.
In sum, results from this study establish that resting state connectivity patterns are associated with higher-order cognitive functions in youth and underscore the special importance of connections within and between task control networks and DMN for the General Ability domain. Future studies of subsequent waves of ABCD data will be well positioned to assess longitudinal maturational trajectories of task control-DMN connections, a potentially important locus of individual differences in cognition in health and disease.
Methods
Sample and data
The ABCD study is a multisite longitudinal study established to investigate how individual, family, and broader socio-cultural factors shape brain development and health outcomes. The study has recruited 11,875 children between 9–10 years of age from 21 sites across the United States for longitudinal assessment. The study conforms to the rules and procedures of each site’s Institutional Review Board, and all participants provide informed consent (parents) or informed assent (children). At each assessment wave, children undergo assessments of neurocognition, physical health, and mental health, and also participate in structural and functional neuroimaging. Detailed description of recruitment procedures [54], neurocognition battery [55], and imaging protocols [40] are available elsewhere. The ABCD data repository grows and changes over time. The ABCD data used in this report came from NDA Study 576, DOI 10.15154/1412097, which can be found at https://ndar.nih.gov/study.html?id=576.
Data acquisition, fMRI preprocessing, and connectome generation
Imaging protocols were harmonized across sites and scanners. High spatial (2.4 mm isotropic) and temporal resolution (TR = 800 ms) resting state fMRI was acquired in four separate runs (5 min per run, 20 min total). For the current analysis, minimally preprocessed resting-state fMRI data from the curated ABCD annual release 1.1 were used, and full details are described in [56]. This data reflects the application of the following steps: (i) gradient-nonlinearity distortions and inhomogeneity correction for structural data; and (ii) gradient-nonlinearity distortion correction, rigid realignment to adjust for motion, and field map correction for functional data. Additional processing steps were applied by our group using SPM12, including co-registration using the CAT12 toolbox application, smoothing with a 6 mm FWHM Gaussian kernel, and application of ICA-AROMA [57]. Resting state processing steps were then applied including linear detrending, CompCor [58], bandpass filtering from 0.1–0.01 Hz, and motion scrubbing of frames that exceed a framewise displacement of 0.5 mm. We next applied the parcellation of Power et al. [59], calculated Pearson’s correlation coefficients between each ROI, and applied Fisher’s r to z-transformation.
Constructing neurocognitive component scores
Component scores for three neurocognitive domains were derived through procedures described in detail in Thompson et al. [36], and presented here in brief. Bayesian Probabilistic Principal Components Analysis (BPPCA) was applied to ABCD release 1.1 neurocognitive data to yield a three component solution: (a) General Ability; (b) Speed/Flexibility; and (c) Learning/Memory. Details of the factor loadings are also available in the Supplement.
Inclusion/exclusion
There were 4521 subjects in the ABCD Release 1.1 dataset. Of these, 3575 subjects had usable T1w images and one or more resting state runs that passed ABCD quality checking standards (fsqc_qc = 1). Next, 3544 passed preprocessing and were subsequently visually checked for registration and normalization quality, where 197 were excluded for poor quality. Motion was assessed based on number of frames censored, with a framewise displacement threshold of 0.5 mm, and only subjects with two or more runs with at least 4 min of good data were included (n = 2757). To remove unwanted sources of dependence in the dataset, only one sibling was randomly chosen to be retained for any family with more than 1 sibling (n = 2494). Finally, in order to implement leave-one-site-out cross validation, sites with fewer than 75 subjects that passed these quality checks were dropped, leaving 2206 subjects across 15 sites to enter the PCA step of BBS predictive modeling. Thompson et al. [36] excluded 428 children due to incomplete neurocognitive data, and our prediction analyses was correspondingly restricted to only those subjects that had the three neurocognitive factors from their analysis. This left 2013 subjects across the 15 sites for the prediction step of BBS, and the demographic characteristics of this sample are shown in Table S2. For the analysis including more covariates (described in section 6) 1858 subjects were included due to additional missing data in the covariates.
Brain basis set modeling (BBS)
BBS is a validated multivariate predictive method that uses dimensionality reduction to produce a basis set of components to make phenotypic predictions (see Fig. 4 for an overview) [34, 38]. For the dimensionality reduction step, we submitted an n subjects × p connections matrix from a training dataset for principal components analysis using the pca function in MATLAB, yielding n-1 components ordered by descending eigenvalues (note that that p > n). We select the top 75 components for our basis set based on our previous work showing that somewhere between 50 to 100 components yields optimal prediction of a broad array of behavioral phenotypes [38, 39], with inclusion of additional components typically reducing performance due to overfitting.
Fig. 4.

Main steps of brain basis set (BBS) modeling. BBS is a multivariate predictive modeling method. It utilizes dimensionality reduction with principal components analysis (PCA) to construct a basis set for predicting phenotypes of interest
Next, in the training dataset, we calculate the expression scores for each of the 75 components for each subject by projecting each subject’s connectivity matrix onto each principal component. We then fit a linear regression model with these expression scores as predictors and the phenotype of interest as the outcome, saving B, the 75 × 1 vector of fitted coefficients, for later use. In a test dataset, we again calculate the expression scores for each of the 75 components for each subject. Our predicted phenotype for each test subject is the dot product of B learned from the training dataset with the vector of component expression scores for that subject.
Leave-one-site-out cross validation
To assess of the performance of BBS-based prediction models, we used leave-one-site-out cross-validation, which was performed separately for each of the three neurocognitive component scores. In each fold of the cross-validation, data from one of the 15 sites served as the held-out test dataset and data from the other 14 sites served as the training dataset. Additionally, at each fold of the cross-validation, we did the following: (1) PCA was performed on the training dataset yielding a 75-component basis set; (2) a BBS model was trained to predict the relevant neurocognitive factor as the outcome variable. These BBS models included covariates for head motion (mean FD and mean FD squared), and in applying these trained BBS models to the held-out test dataset, the level of these covariates was set at zero. In a secondary analysis, we used a more extensive set of covariates in these BBS predictive models, including age, gender, race/ethnicity, highest parental education, household marital status, and household income. We assessed the significance of all cross-validation-based correlations with non-parametric permutation tests [60] in which we randomly permuted the 2013 subjects’ neurocognitive scores 10,000 times, as described in detail in the Supplement.
Consensus component maps for visualization
We used BBS with 75 whole-connectome components to make predictions about neurocognitive component scores. To help convey overall patterns across the entire BBS predictive model, we constructed “consensus” component maps. We first fit a BBS model to the entire dataset consisting of all participants across the 15 included sites. We then multiplied each component map with its associated beta from this fitted BBS model. Next, we summed across all 75 components yielding a single map, and thresholded the entries at z = 2. The resulting map indicates the extent to which each connection is positively (red) or negatively (blue) related to the outcome variable of interest.
Supplementary Material
Acknowledgements
Data used in the preparation of this article were obtained from the Adolescent Brain Cognitive Development (ABCD) Study (https://abcdstudy.org), held in the NIMH Data Archive (NDA). This is a multisite, longitudinal study designed to recruit more than 10,000 children age 9–10 and follow them over 10 years into early adulthood. The ABCD Study is supported by the National Institutes of Health and additional federal partners under award numbers U01DA041022, U01DA041028, U01DA041048, U01DA041089, U01DA041106, U01DA041117, U01DA041120, U01DA041134, U01DA041148, U01DA041156, U01DA041174, U24DA041123, U24DA041147, U01DA041093, and U01DA041025. A full list of supporters is available at https://abcdstudy.org/federal-partners.html. A listing of participating sites and a complete listing of the study investigators can be found at https://abcdstudy.org/Consortium_Members.pdf. ABCD consortium investigators designed and implemented the study and/or provided data but did not necessarily participate in analysis or writing of this report. This manuscript reflects the views of the authors and may not reflect the opinions or views of the NIH or ABCD consortium investigators. This work was supported by the following grants from the United States National Institutes of Health, the National Institute on Drug Abuse, and the National Institute on Alcohol Abuse and Alcoholism: R01MH107741 (CS), U01DA041106 (CS, LH, MH), 1U24DA041123-01 (WT), U01DA041120 (ML), T32 AA007477 (AW). In addition, CS was supported by a grant from the Dana Foundation David Mahoney Neuroimaging Program. This research was supported in part through computational resources and services provided by Advanced Research Computing at the University of Michigan, Ann Arbor.
Footnotes
Conflict of interest The authors declare that they have no conflict of interest.
Publisher’s note: Springer Nature remains neutral with regard to jurisdictional claims in published maps and institutional affiliations.
Supplementary information The online version of this article (https://doi.org/10.1038/s41380-019-0481-6) contains supplementary material, which is available to authorized users.
References
- 1.Paus T, Keshavan M, Giedd JN. Why do many psychiatric disorders emerge during adolescence? Nat Rev Neurosci. 2008;9:947–57. [DOI] [PMC free article] [PubMed] [Google Scholar]
- 2.Frith C, Dolan R. The role of the prefrontal cortex in higher cognitive functions. Cogn Brain Res. 1996;5:175–81. [DOI] [PubMed] [Google Scholar]
- 3.Diamond A Executive functions. Annu Rev Psychol. 2013;64:135–68. [DOI] [PMC free article] [PubMed] [Google Scholar]
- 4.Casey BJ, Tottenham N, Fossella J. Clinical, imaging, lesion, and genetic approaches toward a model of cognitive control. Dev Psychobiol. 2002;40:237–54. [DOI] [PubMed] [Google Scholar]
- 5.Banich MT. Executive function: the search for an integrated account. Curr Dir Psychol Sci. 2009;18:89–94. [Google Scholar]
- 6.Barkley RA. Behavioral inhibition, sustained attention, and executive functions: constructing a unifying theory of ADHD. Psychol Bull. 1997;121:65. [DOI] [PubMed] [Google Scholar]
- 7.Pennington BF, Ozonoff S. Executive functions and developmental psychopathology. J Child Psychol Psychiatry. 1996;37:51–87. [DOI] [PubMed] [Google Scholar]
- 8.Ogilvie JM, Stewart AL, Chan RC, Shum DH. Neuropsychological measures of executive function and antisocial behavior: a meta‐analysis. Criminology. 2011;49:1063–107. [Google Scholar]
- 9.Fossati P, Ergis AM, Allilaire JF. Executive functioning in unipolar depression: a review. L’encéphale. 2002;28:97–107. [PubMed] [Google Scholar]
- 10.Banich MT, Mackiewicz KL, Depue BE, Whitmer AJ, Miller GA, Heller W. Cognitive control mechanisms, emotion and memory: a neural perspective with implications for psychopathology. Neurosci Biobehav Rev. 2009;33:613–30. [DOI] [PMC free article] [PubMed] [Google Scholar]
- 11.Barrett PM, Healy LJ. An examination of the cognitive processes involved in childhood obsessive–compulsive disorder. Behav Res Ther. 2003;41:285–99. [DOI] [PubMed] [Google Scholar]
- 12.Goodkind M, Eickhoff SB, Oathes DJ, Jiang Y, Chang A, Jones-Hagata LB, et al. Identification of a common neurobiological substrate for mental illness. JAMA Psychiatry. 2015;72:305–15. [DOI] [PMC free article] [PubMed] [Google Scholar]
- 13.McTeague LM, Huemer J, Carreon DM, Jiang Y, Eickhoff SB, Etkin A. Identification of common neural circuit disruptions in cognitive control across psychiatric disorders. Am J Psychiatry. 2017;174:676–85. [DOI] [PMC free article] [PubMed] [Google Scholar]
- 14.McTeague LM, Goodkind MS, Etkin A. Transdiagnostic impairment of cognitive control in mental illness. J Psychiatr Res. 2016;83:37–46. [DOI] [PMC free article] [PubMed] [Google Scholar]
- 15.Mill RD, Ito T, Cole MW. From connectome to cognition: the search for mechanism in human functional brain networks. NeuroImage. 2017;160:124–39. [DOI] [PMC free article] [PubMed] [Google Scholar]
- 16.Rosenberg MD, Finn ES, Scheinost D, Papademetris X, Shen X, Constable RT, et al. A neuromarker of sustained attention from whole-brain functional connectivity. Nat Neurosci. 2016;19:165–71. [DOI] [PMC free article] [PubMed] [Google Scholar]
- 17.Finn ES, Shen X, Scheinost D, Rosenberg MD, Huang J, Chun MM, et al. Functional connectome fingerprinting: identifying individuals using patterns of brain connectivity. Nat Neurosci. 2015;18:1664–71. [DOI] [PMC free article] [PubMed] [Google Scholar]
- 18.Dubois J, Galdi P, Paul LK, Adolphs R A distributed brain network predicts general intelligence from resting-state human neuroimaging data. Philos Trans R Soc B Biol Sci. 2018;373 10.1098/rstb.2017.0284. [DOI] [PMC free article] [PubMed] [Google Scholar]
- 19.Cole MW, Reynolds JR, Power JD, Repovs G, Anticevic A, Braver TS. Multi-task connectivity reveals flexible hubs for adaptive task control. Nat Neurosci. 2013;16:1348–55. [DOI] [PMC free article] [PubMed] [Google Scholar]
- 20.Cole MW, Schneider W. The cognitive control network: integrated cortical regions with dissociable functions. NeuroImage. 2007;37:343–60. [DOI] [PubMed] [Google Scholar]
- 21.Dosenbach NUF, Fair DA, Cohen AL, Schlaggar BL, Petersen SE. A dual-networks architecture of top-down control. Trends Cogn Sci. 2008;12:99–105. [DOI] [PMC free article] [PubMed] [Google Scholar]
- 22.Dosenbach NUF, Fair DA, Miezin FM, Cohen AL, Wenger KK, Dosenbach RAT, et al. Distinct brain networks for adaptive and stable task control in humans. Proc Natl Acad Sci USA. 2007;104:11073–8. [DOI] [PMC free article] [PubMed] [Google Scholar]
- 23.Sridharan D, Levitin DJ, Menon V. A critical role for the right fronto-insular cortex in switching between central-executive and default-mode networks. Proc Natl Acad Sci USA. 2008;105:12569–74. [DOI] [PMC free article] [PubMed] [Google Scholar]
- 24.Menon V, Uddin LQ. Saliency, switching, attention and control: a network model of insula function. Brain Struct Funct. 2010;214:655–67. [DOI] [PMC free article] [PubMed] [Google Scholar]
- 25.Buckner RL, Andrews-Hanna JR, Schacter DL. The Brain’s Default Network. Ann N Y Acad Sci. 2008;1124:1–38. [DOI] [PubMed] [Google Scholar]
- 26.Andrews-Hanna JR, Reidler JS, Sepulcre J, Poulin R, Buckner RL. Functional-anatomic fractionation of the brain’s default network. Neuron. 2010;65:550–62. [DOI] [PMC free article] [PubMed] [Google Scholar]
- 27.Spreng RN, Stevens WD, Chamberlain JP, Gilmore AW, Schacter DL. Default network activity, coupled with the frontoparietal control network, supports goal-directed cognition. NeuroImage. 2010;53:303–17. [DOI] [PMC free article] [PubMed] [Google Scholar]
- 28.Spreng RN, Sepulcre J, Turner GR, Stevens WD, Schacter DL. Intrinsic architecture underlying the relations among the default, dorsal attention, and frontoparietal control networks of the human brain. J Cogn Neurosci. 2012;25:74–86. [DOI] [PMC free article] [PubMed] [Google Scholar]
- 29.Gerlach KD, Spreng RN, Gilmore AW, Schacter DL. Solving future problems: default network and executive activity associated with goal-directed mental simulations. NeuroImage. 2011;55:1816–24. [DOI] [PMC free article] [PubMed] [Google Scholar]
- 30.Sonuga-Barke EJS, Castellanos FX. Spontaneous attentional fluctuations in impaired states and pathological conditions: a neurobiological hypothesis. Neurosci Biobehav Rev. 2007; 31:977–86. [DOI] [PubMed] [Google Scholar]
- 31.Menon V Large-scale brain networks and psychopathology: a unifying triple network model. Trends Cogn Sci. 2011;15:483–506. [DOI] [PubMed] [Google Scholar]
- 32.Anderson JS, Ferguson MA, Lopez-Larson M, Yurgelun-Todd D. Connectivity gradients between the default mode and attention control networks. Brain Connect. 2011;1:147–57. [DOI] [PMC free article] [PubMed] [Google Scholar]
- 33.Fair DA, Dosenbach NUF, Church JA, Cohen AL, Brahmbhatt S, Miezin FM, et al. Development of distinct control networks through segregation and integration. Proc Natl Acad Sci USA. 2007;104:13507–12. [DOI] [PMC free article] [PubMed] [Google Scholar]
- 34.Kessler D, Angstadt M, Sripada C. Brain network growth charting and the identification of attention impairment in youth. JAMA Psychiatry. 2016;73:481–9. [DOI] [PMC free article] [PubMed] [Google Scholar]
- 35.Luciana M, Bjork JM, Nagel B, Barch DM, Gonzalez R, Nixon SJ, et al. Adolescent neurocognitive development and impacts of substance use: overview of the adolescent brain cognitive development (ABCD) baseline neurocognition battery. Dev Cogn Neurosci. 2018;32:67–79. [DOI] [PMC free article] [PubMed] [Google Scholar]
- 36.Thompson WK, Barch DM, Bjork JM, Gonzalez R, Nagel BJ, Nixon SJ et al. The structure of cognition in 9 and 10 year-old children and associations with problem behaviors: findings from the ABCD study’s baseline neurocognitive battery. Dev Cogn Neurosci. 2019;36:100606. [DOI] [PMC free article] [PubMed] [Google Scholar]
- 37.Power JD, Mitra A, Laumann TO, Snyder AZ, Schlaggar BL, Petersen SE. Methods to detect, characterize, and remove motion artifact in resting state fMRI. NeuroImage. 2014;84:320–41. [DOI] [PMC free article] [PubMed] [Google Scholar]
- 38.Sripada C, Angstadt M, Rutherford S, Kessler D, Kim Y, Yee M, et al. Basic units of inter-individual variation in resting state connectomes. Sci Rep. 2019;9:1900. [DOI] [PMC free article] [PubMed] [Google Scholar]
- 39.Sripada C, Angstadt M, Rutherford S. Towards a ‘treadmill test’ for cognition: reliable prediction of intelligence from whole-brain task activation patterns. bioRxiv 2018. 10.1101/412056. [DOI] [Google Scholar]
- 40.Casey BJ, Cannonier T, Conley MI, Cohen AO, Barch DM, Heitzeg MM, et al. The adolescent brain cognitive development (ABCD) study: imaging acquisition across 21 sites. Dev Cogn Neurosci. 2018;32:43–54. [DOI] [PMC free article] [PubMed] [Google Scholar]
- 41.Biswal BB, Kylen JV, Hyde JS. Simultaneous assessment of flow and BOLD signals in resting-state functional connectivity maps. NMR Biomed. 1997;10:165–70. [DOI] [PubMed] [Google Scholar]
- 42.Buckner RL, Krienen FM, Yeo BTT. Opportunities and limitations of intrinsic functional connectivity MRI. Nat Neurosci. 2013;16:832–7. [DOI] [PubMed] [Google Scholar]
- 43.Smith SM, Vidaurre D, Beckmann CF, Glasser MF, Jenkinson M, Miller KL, et al. Functional connectomics from resting-state fMRI. Trends Cogn Sci. 2013;17:666–82. [DOI] [PMC free article] [PubMed] [Google Scholar]
- 44.Castellanos FX, Di Martino A, Craddock RC, Mehta AD, Milham MP. Clinical applications of the functional connectome. NeuroImage. 2013;80:527–40. [DOI] [PMC free article] [PubMed] [Google Scholar]
- 45.Kaiser M The potential of the human connectome as a biomarker of brain disease. Front Hum Neurosci. 2013; 7 10.3389/fnhum.2013.00484. [DOI] [PMC free article] [PubMed] [Google Scholar]
- 46.Cocchi L, Zalesky A, Fornito A, Mattingley JB. Dynamic cooperation and competition between brain systems during cognitive control. Trends Cogn Sci. 2013;17:493–501. [DOI] [PubMed] [Google Scholar]
- 47.Weissman DH, Roberts KC, Visscher KM, Woldorff MG. The neural bases of momentary lapses in attention. Nat Neurosci. 2006;9:971–8. [DOI] [PubMed] [Google Scholar]
- 48.Fassbender C, Zhang H, Buzy WM, Cortes CR, Mizuiri D, Beckett L, et al. A lack of default network suppression is linked to increased distractibility in ADHD. Brain Res. 2009;1273:114–28. [DOI] [PMC free article] [PubMed] [Google Scholar]
- 49.Fair DA, Cohen AL, Dosenbach NUF, Church JA, Miezin FM, Barch DM, et al. The maturing architecture of the brain’s default network. Proc Natl Acad Sci. 2008;105:4028–32. [DOI] [PMC free article] [PubMed] [Google Scholar]
- 50.Sripada C, Kessler D, Angstadt M. Lag in maturation of the brain’s intrinsic functional architecture in attention-deficit/hyperactivity disorder. Proc Natl Acad Sci USA. 2014;111:14259–64. [DOI] [PMC free article] [PubMed] [Google Scholar]
- 51.van den Heuvel MI, Thomason ME. Functional connectivity of the human brain in utero. Trends Cogn Sci. 2016;20:931–9. [DOI] [PMC free article] [PubMed] [Google Scholar]
- 52.Shaw P, Eckstrand K, Sharp W, Blumenthal J, Lerch JP, Greenstein D, et al. Attention-deficit/hyperactivity disorder is characterized by a delay in cortical maturation. Proc Natl Acad Sci USA. 2007;104:19649–54. [DOI] [PMC free article] [PubMed] [Google Scholar]
- 53.Shaw P, Malek M, Watson B, Greenstein D, de Rossi P, Sharp W. Trajectories of cerebral cortical development in childhood and adolescence and adult attention-deficit/hyperactivity disorder. Biol Psychiatry. 2013;74:599–606. [DOI] [PMC free article] [PubMed] [Google Scholar]
- 54.Garavan H, Bartsch H, Conway K, Decastro A, Goldstein RZ, Heeringa S, et al. Recruiting the ABCD sample: design considerations and procedures. Dev Cogn Neurosci. 2018;32:16–22. [DOI] [PMC free article] [PubMed] [Google Scholar]
- 55.Luciana M, Bjork JM, Nagel B, Barch DM, Gonzalez R, Nixon SJ, et al. Adolescent neurocognitive development and impacts of substance use: Overview of the Adolescent Brain and Cognitive Development (ABCD) baseline neurocognition battery. Dev Cogn Neurosci. 2018;32:67–79. [DOI] [PMC free article] [PubMed] [Google Scholar]
- 56.Hagler DJ, Hatton SN, Makowski C, Cornejo MD, Fair DA, Dick AS, et al. Image processing and analysis methods for the Adolescent Brain Cognitive Development Study. bioRxiv. 2018;457739. [DOI] [PMC free article] [PubMed] [Google Scholar]
- 57.Pruim RH, Mennes M, van Rooij D, Llera A, Buitelaar JK, Beckmann CF. ICA-AROMA: a robust ICA-based strategy for removing motion artifacts from fMRI data. Neuroimage. 2015;112:267–77. [DOI] [PubMed] [Google Scholar]
- 58.Behzadi Y, Restom K, Liau J, Liu TT. A component based noise correction method (CompCor) for BOLD and perfusion based fMRI. NeuroImage. 2007;37:90–101. [DOI] [PMC free article] [PubMed] [Google Scholar]
- 59.Power JD, Cohen AL, Nelson SM, Wig GS, Barnes KA, Church JA, et al. Functional network organization of the human brain. Neuron. 2011;72:665–78. [DOI] [PMC free article] [PubMed] [Google Scholar]
- 60.Good P Permutation Tests: A Practical Guide to Resampling Methods for Testing Hypotheses 2nd edn. Springer, 2000. [Google Scholar]
Associated Data
This section collects any data citations, data availability statements, or supplementary materials included in this article.