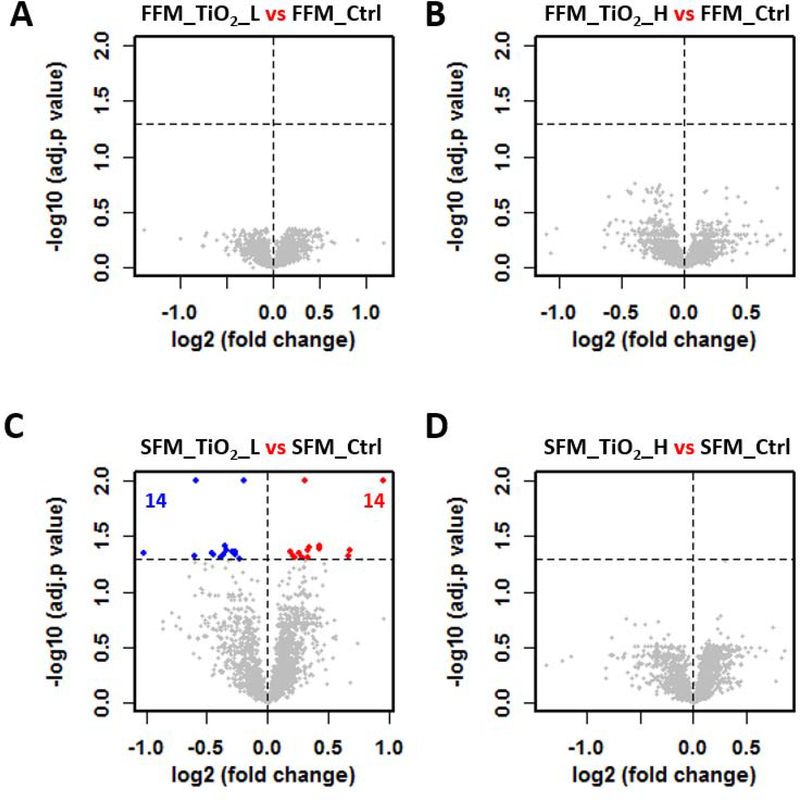
Figure 4.
TiO2 induce little to no impact on the cellular proteome of the triculture system. Volcano plots were used to show the proteome difference involving four TiO2 effect comparisons (A-D). Abbreviation scheme of comparing groups: food matrix (F for fasting and S for standard), followed by treatment (TiO2_L and TiO2_H for low and high dose of TiO2 treatment, respectively, and Ctrl for the controls). x axis: the extent of fold change in protein intensity (in log2 scale); y axis: the level of statistical significance of the comparisons (-log adjusted p value). Red and blue dots represent significantly down- and up-regulated proteins, respectively. Grey dots represent non-significant regulated proteins. Black dotted horizontal line at y = 1.3, the cutoff to define significant proteins. The number of significantly down- and up-regulated proteins were shown in blue and red, respectively.

