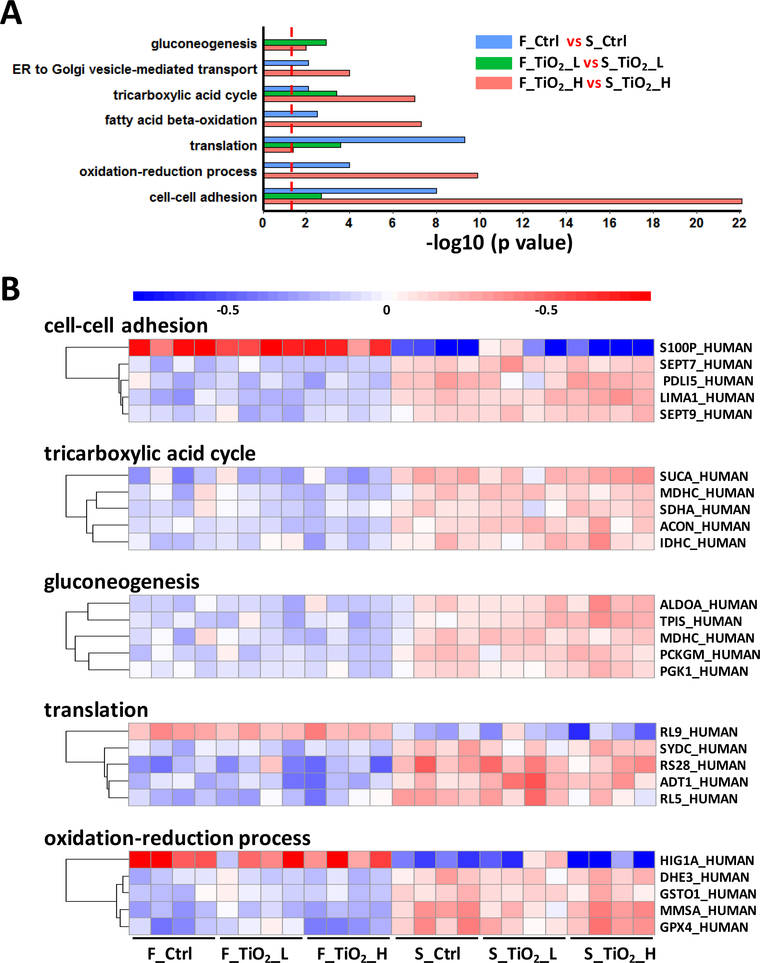
Figure 6.
Pathways and proteins in response to different food matrices. (A) Biological processes enriched from three food matrix effect comparisons. Significant proteins from each comparison were subjected to gene ontology enrichment, and the figure illustrated biological processes (p < 0.01) found from at least two out of the three comparisons. (B) Protein abundance changes in selected biological processes. Significant proteins in each biological process were subjected to t test between the two food matrix groups, and proteins with top 5 smallest p values were selected for plotting.

