

Abstract
BACKGROUND:
Prediabetes may be improved or reversed with lifestyle interventions. A worksite wellness program offering financial incentives for participation may be effective in improving the health of employees with prediabetes. We studied the effect of employee health plan financial incentives on health outcomes for employees with prediabetes.
METHODS:
We conducted a retrospective cohort study using electronic medical record data from January 2008 to December 2012. Our study participants were employees with prediabetes and propensity-matched non-employees with prediabetes and commercial health insurance, all receiving care within one health system. Exposures included fixed annual financial incentives for program participation and later a premium discount divided between program participation and achievement of goals. We used longitudinal linear mixed models to assess yearly changes in glycosylated hemoglobin (HbA1c), weight, and low-density lipoprotein cholesterol in employees versus non-employees. We also compared outcomes of employees by ever- versus never- program participant status.
RESULTS:
Our study population included 1005 employees and 1005 matched non-employees. The yearly reduction in HbA1c for employees versus matched non-employees did not differ in 2008–2010 but was greater in 2010–2012, when incentives were tied to program participation as well as achievement of goals (−0.10% vs −0.08 %, respectively; P for difference in change [DIC] = .01 from 2010 to 2012). Analyses from both periods showed that employees lost more weight per year than matched non-employees (−1.85 vs −0.21 lb [1 lb=0.45 kg] from 2008 to 2010; P for DIC < .001 and −2.35 vs −0.65 lb from 2010 to 2012; P for DIC < .001). Employees who participated in disease management lost more weight than those who did not (−2.14 vs 0.79 lb yearly before 2010 and −2.82 vs −0.91 after January 1, 2010, P for DIC < .01 and < .001, respectively).
CONCLUSION:
A worksite wellness program offering health plan financial incentives for participation and outcomes was associated with improvements in weight and HbA1c.
Keywords: Employee health, Incentive plans, Prediabetes
Employer-sponsored wellness programs are common1 and most often focus on lifestyle management, including nutrition and weight.1 Although the offering of financial incentives may promote change in healthy behaviors,2 less than 10% of employers have been reported to use results-based incentives in wellness programs.1 We previously reported that the offering of employee health plan financial incentives encouraged participation in disease management for employees with diabetes and improved diabetes and cardiovascular risk factor control compared with matched non-employees.3
Prediabetes, defined as a glycosylated hemoglobin (HbA1c) level between 5.7% and 6.4% or a fasting glucose level between 100 and 125 mg/dL,4 affected 86 million adults in 2012.5 Prediabetes may be improved or reversed with lifestyle interventions including exercise and weight loss6 or may progress to diabetes. We hypothesized that a worksite wellness program that offers financial incentives for participation in wellness activities or disease management would also be effective in improving the health of employees with prediabetes at a population level. Thus we studied the effect of offered employee health plan financial incentives in our health system on outcomes for employees with prediabetes.
METHODS
We conducted a retrospective cohort study using electronic medical record data from January 2008 to December 2012. Our study participants were employees with prediabetes, defined as having an HbA1c measurement between 5.7% and 6.4% or 2 fasting glucose values between 100 and 125 mg/dL and no previous diagnosis of diabetes in the electronic medical record (defined as HbA1c >6.5% or 2 International Classification of Diseases, Ninth Revision codes for diabetes and a diabetes medication prescribed). We created a comparison group of non-employee patients with prediabetes and commercial health insurance who received care within our integrated health care system. Analyses were restricted to patients who had at least 2 HbA1c values within the time frame of the study. Exposures included fixed annual health plan financial incentives offered in 2009 ($100) through 2010 ($300) for program participation only, and then a 30% premium discount starting in 2011 ($600-$1200) divided evenly between wellness program participation (15%) and achievement of goals (15%). Although there was no specific disease management program offered for prediabetes, there were available programs for management of diabetes (in which patients with prediabetes could participate) and for management of other cardiovascular risk factors, including obesity, hypertension, and hyperlipidemia, that could impact prediabetes. For patients without identified risk factors, the incentives were tied to participation in regular exercise (visiting a gym or walking 100,000 steps per month), which might also improve prediabetes.
A total of 1005 employees were identified with prediabetes from 2008 to 2012 and assigned to yearly cohorts by the year prediabetes was diagnosed. These employees were matched by year to 5705 non-employee patients with commercial insurance. Matching was done using propensity scores, based on a logistic regression model that included baseline HbA1c, age, race (black, white, other), gender, body mass index (≤25, >25–29, >29–35, and >35 kg/m2), and practice site as covariates, with employee status as the outcome. We then created longitudinal linear mixed models using the data for all employees and non-employees to assess yearly changes in HbA1c, weight, and low density lipoprotein (LDL) cholesterol. To assess for differences in outcomes based on increasing incentives tied to achievement of goals as well as program participation, we assessed changes in employees versus matched non-employees from 2008 to 2010, then from 2010 to 2012, and compared the changes in these 2 time periods. We also assessed the proportion of employees who lost ≥5% of their body weight compared with non-employees in the entire study period, because changes of this magni tude are often accompanied by improvements in cardiovascular risk factors in patients with type 2 diabetes.7 To determine the effect of employee participation in disease management programs on outcomes, we additionally compared outcomes of employees by ever-versus never-program participant status from 2008 to 2012. This study was approved by the institutional review board at Cleveland Clinic.
RESULTS
Our study population included 1005 employees and 1005 non-employees matched 1:1 on propensity scores. Baseline characteristics appear in Table 1. The mean age of the population was <60 years, and mean HbA1c in each year for both the employees and matched non-employees was <6%. Most of the population was overweight or obese, with body mass index >25 kg/m2, and at least 60% were female in all years. In longitudinal linear mixed modeling, the yearly reduction in HbA1c for employees compared with matched non-employees did not differ from 2008 to 2010, but was greater from 2010 to 2012 (−0.10% vs −0.08%, respectively, P for difference in change = .01) (Table 2). In both time periods, employees lost more weight than matched non-employees (−1.85 lb vs −0.21 lb [1 lb=0.45 kg], respectively, from 2008 to 2010, P for difference in change < .001; and −2.35 lb vs −0.65 lb, respectively, from 2010 to 2012, P for difference in change < .001). In contrast, non-employees had a greater drop in LDL cholesterol than employees from 2008 to 2010 (−3.13 vs −1.96 mg/dL, P for difference in change = .03), but there was no difference in change from 2010 to 2012. Compared with 2008–2010, when incentives were minimal and not tied to outcomes, employees had a greater change from 2010 to 2012 than non-employees for all 3 outcomes: HbA1c, weight, and LDL cholesterol (Table 2).
Table 1.
Patient Characteristics of Matched Employees and Non-employees, by Year
| Year | Variable | Employee | Non-employee | P Value |
|---|---|---|---|---|
| Mean (SD) or n (%) | Mean (SD) or n (%) | |||
| 2008 (n = 225) | HbalC | 5.95 (0.21) | 5.95 (0.19) | .71 |
| Age (y) | 56.7 (8.9) | 57.1 (9.9) | .66 | |
| BMI (kg/m2) | .85 | |||
| ≤25 | 33 (15) | 32 (14) | ||
| >25–29 | 52 (23) | 45 (20) | ||
| >29–35 | 73 (32) | 79 (35) | ||
| >35 | 67 (30) | 69 (31) | ||
| Race | .84 | |||
| Other | 28 (12) | 26 (12) | ||
| White | 144 (64) | 150 (67) | ||
| Black | 53 (24) | 49 (22) | ||
| Gender | 1 | |||
| Female | 145 (64) | 144 (64) | ||
| Male | 80 (36) | 81 (36) | ||
| Site | .85 | |||
| Other site | 86 (38) | 89 (40) | ||
| Main campus | 139 (62) | 136 (60) | ||
| 2009 (n = 178) | Hba1C | 5.93 (0.21) | 5.95 (0.21) | .26 |
| Age (y) | 55.5 (8.8) | 55.7 (10.2) | .84 | |
| BMI (kg/m2) | .89 | |||
| ≤25 | 30 (17) | 25 (14) | ||
| >25–29 | 37 (21) | 37 (21) | ||
| >29–35 | 53 (30) | 57 (32) | ||
| >35 | 58 (33) | 59 (33) | ||
| Race | .87 | |||
| Other | 19 (11) | 16 (9) | ||
| White | 113 (64) | 115 (65) | ||
| Black | 46 (26) | 47 (26) | ||
| Gender | .91 | |||
| Female | 117 (66) | 119 (67) | ||
| Male | 61 (34) | 59 (33) | ||
| Site | 1 | |||
| Other site | 96 (54) | 96 (54) | ||
| Main campus | 82 (46) | 82 (46) | ||
| 2010 (n = 281) | Hba1C | 5.93 (0.21) | 5.95 (0.21) | .35 |
| Age (y) | 55.1 (9.9) | 56.1 (11.3) | .28 | |
| BMI (kg/m2) | .90 | |||
| ≤25 | 54 (19) | 51 (18) | ||
| >25–29 | 73 (26) | 67 (24) | ||
| >29–35 | 70 (25) | 74 (26) | ||
| >35 | 84 (30) | 89 (32) | ||
| Race | .54 | |||
| Other | 34 (12) | 27 (10) | ||
| White | 178 (63) | 189 (67) | ||
| Black | 69 (25) | 65 (23) | ||
| Gender | 1 | |||
| Female | 195 (69) | 195 (69) | ||
| Male | 86 (31) | 86 (31) | ||
| Site | 1 | |||
| Other site | 107 (38) | 107 (38) | ||
| Main campus | 174 (62) | 174 (62) | ||
| 2011 (n = 267) | Hba1C | 5.92 (0.20) | 5.93 (0.20) | .71 |
| Age (y) | 55.1 (10.1) | 54.6 (12.1) | .64 | |
| BMI (kg/m2) | .92 | |||
| ≤25 | 38 (14) | 36 (14) | ||
| >25–29 | 75 (28) | 70 (26) | ||
| >29–35 | 82 (31) | 89 (33) | ||
| >35 | 72 (27) | 72 (27) | ||
| Race | .62 | |||
| Other | 39 (15) | 34 (13) | ||
| White | 159 (60) | 155 (58) | ||
| Black | 69 (26) | 78 (29) | ||
| Gender | .93 | |||
| Female | 177 (66) | 179 (67) | ||
| Male | 90 (34) | 88 (33) | ||
| Site | 1 | |||
| Other site | 97 (36) | 98 (37) | ||
| Main campus | 170 (64) | 169 (63) | ||
| 2012 (n = 54) | Hba1C | 5.92 (0.21) | 5.94 (0.21) | .52 |
| Age (y) | 55.6 (11.9) | 55.2 (13.0) | .88 | |
| BMI (kg/m2) | .95 | |||
| ≤25 | 3 (6) | 2 (4) | ||
| >25–29 | 12 (22) | 11 (20) | ||
| >29–35 | 17 (32) | 19 (35) | ||
| >35 | 22 (41) | 22 (41) | ||
| Race | .45 | |||
| Other | 3 (6) | 1 (2) | ||
| White | 30 (56) | 35 (65) | ||
| Black | 21 (39) | 18 (33) | ||
| Gender | 1 | |||
| Female | 44 (82) | 44 (82) | ||
| Male | 10 (19) | 10 (19) | ||
| Site | .70 | |||
| Other site | 25 (46) | 28 (52) | ||
| Main campus | 29 (54) | 26 (48) |
BMI = body mass index; HbA1c = glycosylated hemoglobin; SD = standard deviation.
Table 2.
Longitudinal Linear Mixed Models of Yearly Changes in Glycosylated Hemoglobin (HbA1c), Weight, and Low Density Lipoprotein Cholesterol (LDL), 2008–2010 and 2010–2012
| Cohort | Parameter | Change | Standard Error | P Value |
|---|---|---|---|---|
| 2008–2010 | HbA1c (change in %) | |||
| Employee | −0.01 | 0.004 | .02 | |
| Non-employee | −0.02 | 0.004 | <.001 | |
| Difference | 0.01 | 0.005 | .12 | |
| Weight (change in lb) | ||||
| Employee | −1.85 | 0.10 | <.001 | |
| Non-employee | −0.21 | 0.11 | .04 | |
| Difference | −1.64 | 0.15 | <.001 | |
| LDL (change in mg/dL) | ||||
| Employee | −1.96 | 0.37 | <.001 | |
| Non-employee | −3.13 | 0.37 | <.001 | |
| Difference | 1.17 | 0.53 | .03 | |
| 2010–2012 | HbA1c (change in %) | |||
| Employee | −0.10 | 0.01 | <.001 | |
| Non-employee | −0.08 | 0.08 | <.001 | |
| Difference | −0.03 | 0.01 | .01 | |
| Difference in change between 2008–2010 and 2010–2012, employee | 0.11 | 0.01 | <.001 | |
| Difference in change between 2008–2010 and 2010–2012, non-employee | 0.07 | 0.01 | <.001 | |
| Weight (change in lb) | ||||
| Employee | −2.35 | 0.22 | <.001 | |
| Non-employee | −0.65 | 0.24 | .01 | |
| Difference | −1.70 | 0.33 | <.001 | |
| Difference in change between 2008–2010 and 2010–2012, employee | 0.63 | 0.30 | .04 | |
| Difference in change between 2008–2010 and 2010–2012, non-employee | 0.47 | 0.20 | .02 | |
| LDL (change in mg/dL) | ||||
| Employee | −4.36 | 0.83 | <.001 | |
| Non-employee | −3.41 | 0.90 | <.001 | |
| Difference | −0.94 | 1.22 | .44 | |
| Difference in change between 2008–2010 and 2010–2012, employee | 2.76 | 0.89 | <.01 | |
| Difference in change between 2008–2010 and 2010–2012, non-employee | 0.18 | 0.98 | .85 |
Additional analysis showed that during the entire study period from 2008 to 2012, a greater percentage of employees lost ≥5% of their body weight compared with non-employees (26.0% employees vs 20.2% non-employees, P = .003). However, there was only a weak positive correlation between weight and HbA1c in both 2008–2010 (0.20) and 2010–2012 (0.10).
Employee participation in disease management programs (including diabetes, hypertension, hyperlipidemia, or weight management) increased from 0.5% in 2008 to 52.3% in 2012 (Figure).
Figure.
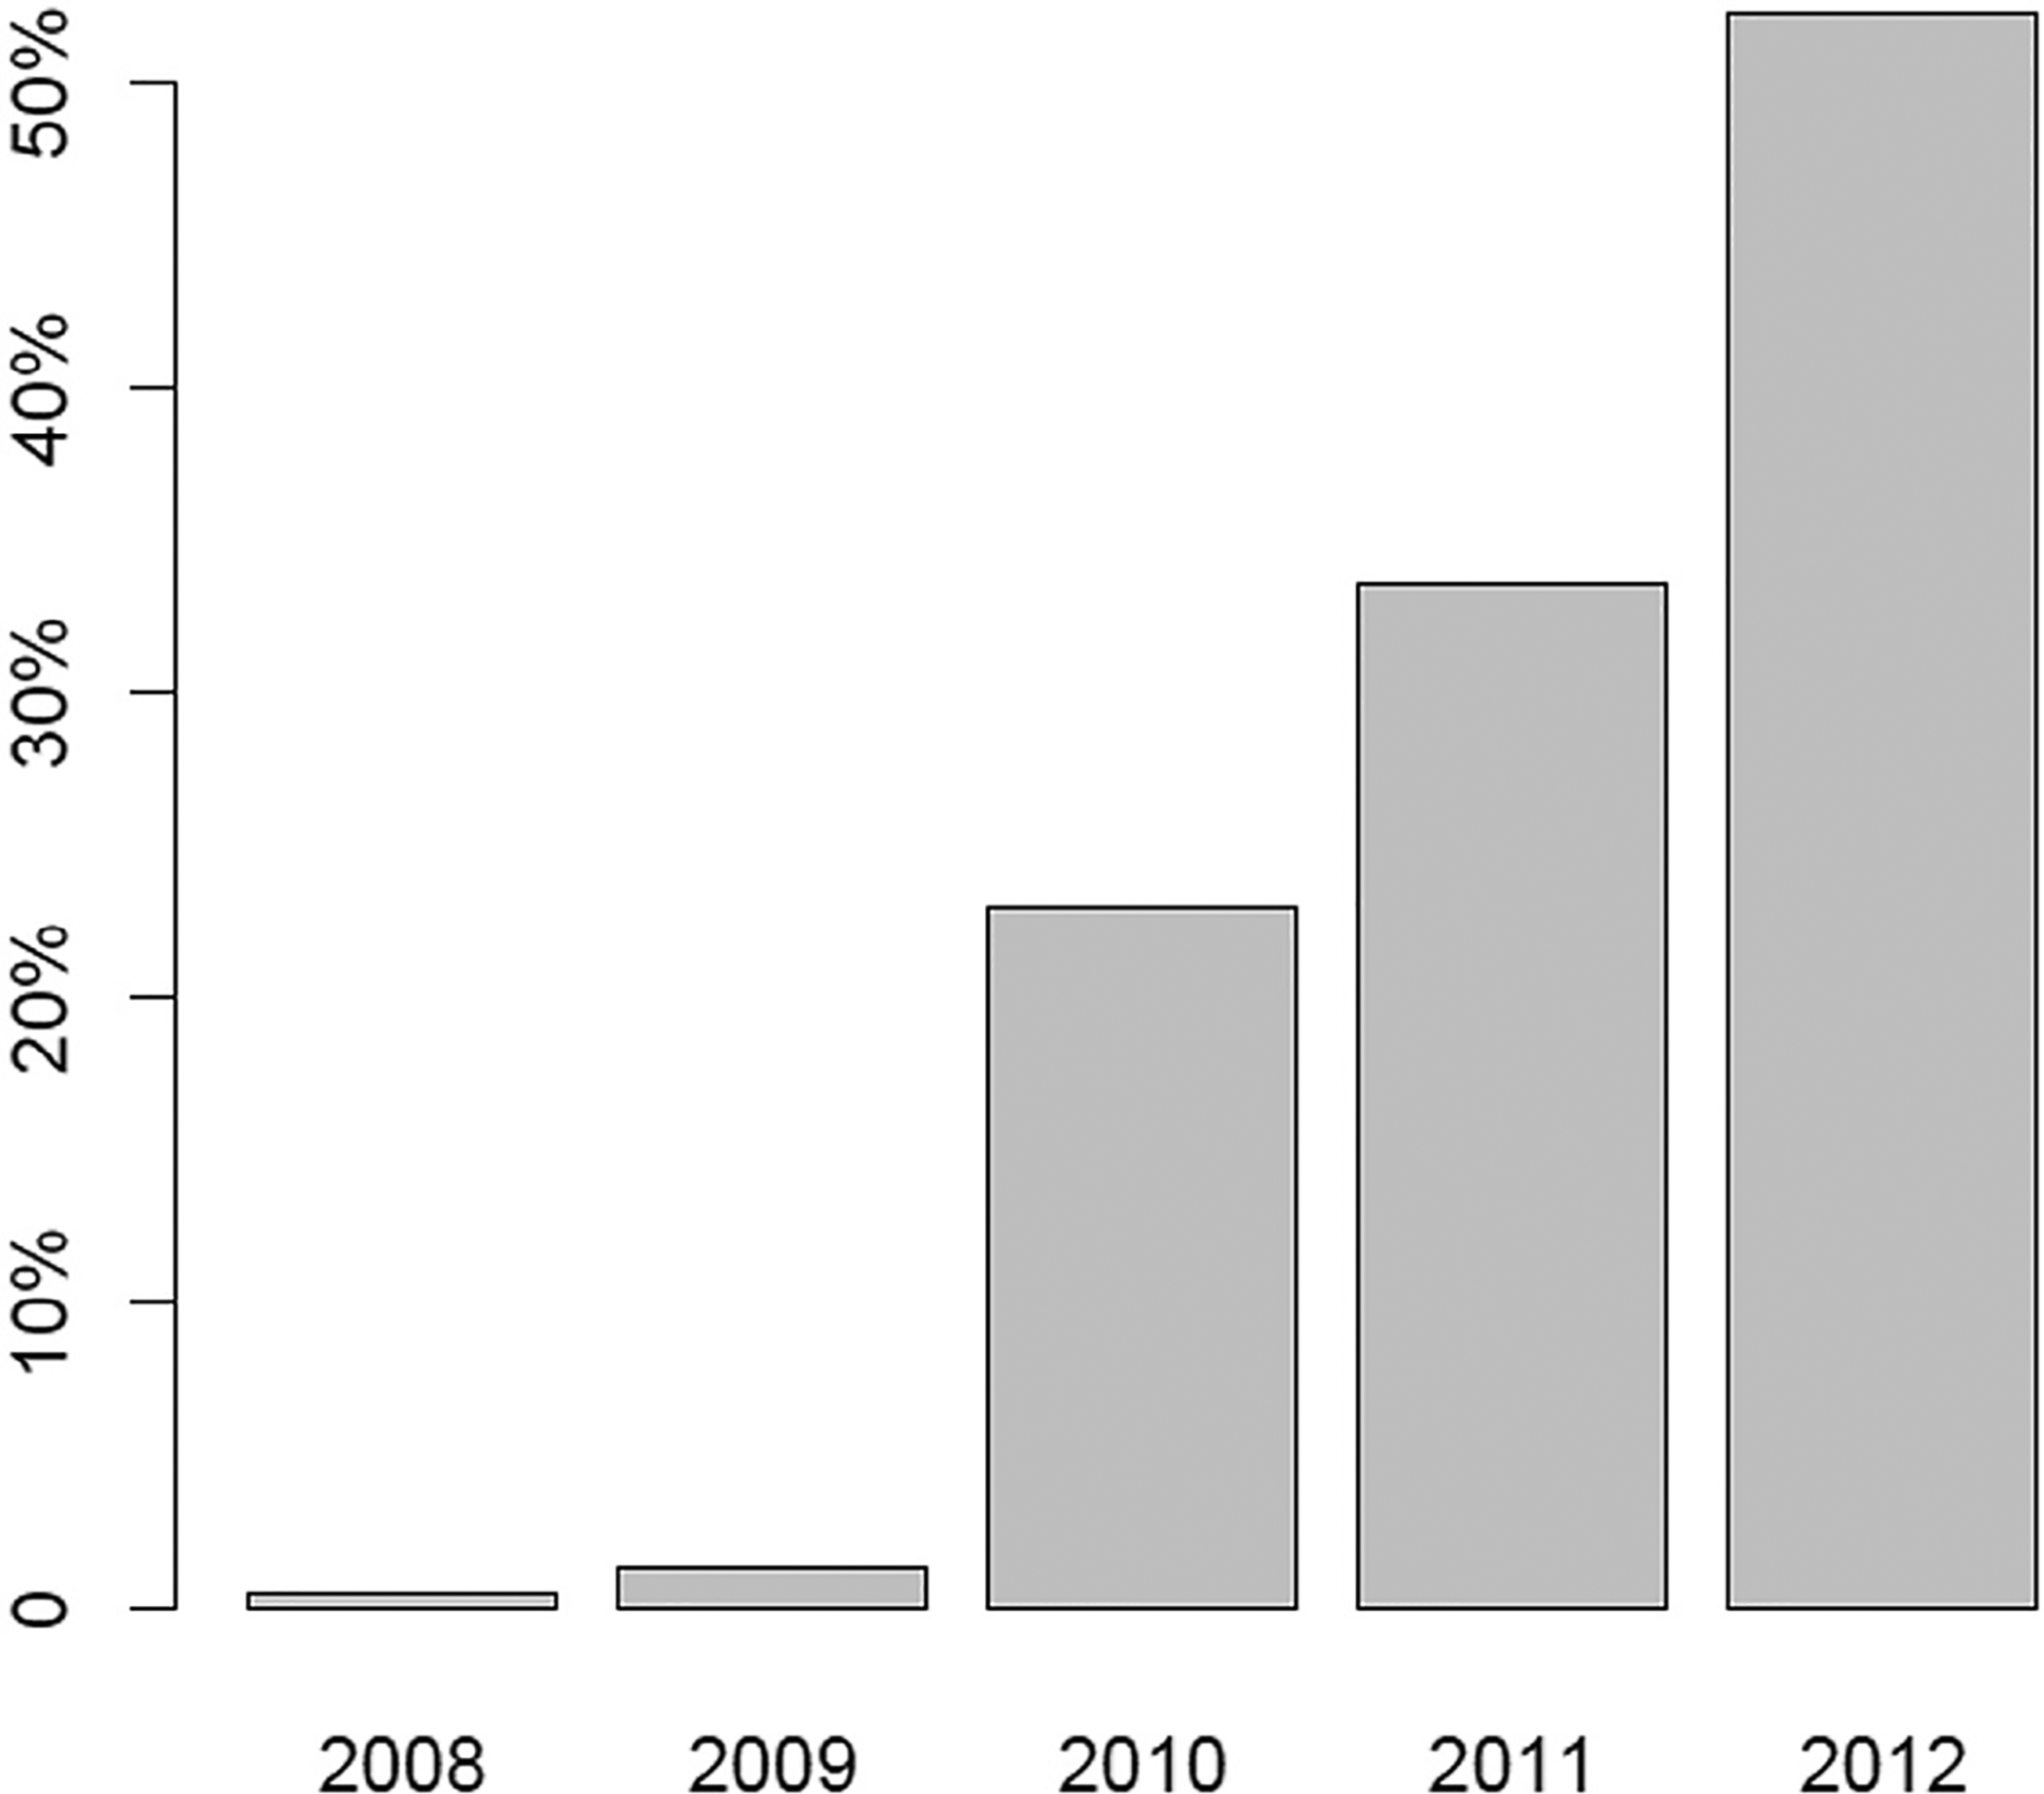
Employee disease management program participation rates, 2008–2012. Programs: diabetes, hyperlipidemia, hypertension, weight.
When comparing program participants with non-participants, employees who participated in disease management programs in at least 1 year (ever-participants) had greater weight loss compared with those who never participated (−2.14 lb vs 0.79 lb yearly before 2010 and −2.82 lb vs −0.91 lb after January 1, 2010, P for difference in change <.01 and <.001, respectively) (Table 3). The ever-participants were present in the dataset for a median time of 5 years (interquartile range [IQR] 5–5 years), or mean of 4.7 years, and participated in the disease management programs for a median time of 2 years (IQR 1–3 years) and mean of 1.85 years. Thus the ever-participants were part of the disease management programs for a median of 40% of the time in the dataset (IQR 20%–60%), and they participated in a median of 2 programs (IQR 1–3).
Table 3.
Comparison of Outcomes Between Ever-Participants and Never-Participants 2008–2012
| Parameter | Estimate | Standard Error | P |
|---|---|---|---|
| HbA1c (%)* | |||
| Yearly change before January 1, 2010 | |||
| Never participant | 0.08 | 0.02 | <.001 |
| Ever participant | 0.09 | 0.02 | <.001 |
| Difference, participant—non-participant | 0.01 | 0.02 | .64 |
| Yearly change after January 1, 2010 | |||
| Never participant | −0.07 | 0.01 | <.001 |
| Ever participant | −0.06 | 0.01 | <.001 |
| Difference, participant—non-participant | 0.01 | 0.01 | .31 |
| Weight (lb)† | |||
| Yearly change before January 1, 2010 | |||
| Never participant | 0.79 | 0.70 | .26 |
| Ever participant | −2.14 | 0.59 | <.001 |
| Difference, participant—non-participant | −2.93 | 0.91 | <.01 |
| Yearly change after January 1, 2010 | |||
| Never participant | −0.91 | 0.30 | <.01 |
| Ever participant | −2.82 | 0.22 | <.001 |
| Difference, participant—non-participant | −1.91 | 0.37 | <.001 |
| LDL cholesterol (mg/dL)‡ | |||
| Yearly change before January 1, 2010 | |||
| Never participant | −0.82 | 1.78 | .65 |
| Ever participant | −0.71 | 1.46 | .63 |
| Difference, participant—non-participant | 0.11 | 2.31 | .96 |
| Yearly change after January 1, 2010 | |||
| Never participant | −3.00 | 0.84 | <.01 |
| Ever participant | −2.07 | 0.63 | <.01 |
| Difference, participant—non-participant | 0.93 | 1.05 | .38 |
Mean HbA1c (%) (standard error) at January 1, 2010: never participant 5.99 (0.02), ever participant 5.99 (0.02).
Mean weight (lb) (standard error) at January 1, 2010: never participant 194.13 (2.23), ever participant 207.64 (1.99).
Mean LDL (mg/dL) (standard error) at January 1, 2010: never participant 112.77 (1.89), ever participant 112.44 (1.54).
DISCUSSION
In this study of financial incentives offered to employees with prediabetes at one health care system, compared with matched non-employees, improvements in weight were seen both before and after increasing financial incentives for wellness program participation, delivered as insurance premium reductions. These were accompanied by small improvements in HbA1c at the population level only when financial incentives were increased and partially tied to outcomes. Importantly, over the entire study period, a greater percentage of employees lost ≥5% of their body weight compared with non-employees.
Although prediabetes was not specifically targeted for disease management by the employee health plan, employees with obesity, hyperlipidemia, and hypertension were encouraged to join disease management. The effect of program participation on weight loss, at least, is supported by our analysis of employees with prediabetes who “ever participated” in any disease management programs (for hypertension, diabetes, weight management, or hyperlipidemia) compared with those who “never participated.” No significant differences in HbA1c or LDL cholesterol were noted, but ever-participants had greater weight loss than never-participants.
Although it is plausible that the lifestyle changes recommended in these programs, especially those resulting in weight loss, would also improve prediabetes, we found only a weak correlation between changes in weight and HbA1c in the study period. It is possible that other factors related to program participation—such as diet or exercise advice—may have led to the decreases in HbA1c independent of weight loss.
Although the improved HbA1c for employees may be explained by the offering of increasing financial incentives and wellness program participation, the HbA1c of non-employees improved as well. One possible explanation is greater awareness of cardiovascular risk factors, especially prediabetes, in later years (2010 or later). Despite improvements in the overall population, the financial incentives seemed to accelerate this trend among employees by increasing rates of participation in the disease management programs. Our findings of ever-participants versus never-participants are based on a median program participation time of 2 years in our dataset. With longer follow-up, it is possible that the greater changes in HbA1c for prediabetes may be demonstrated if weight loss persists.
Our study suggests that worksite wellness programs that include sizeable financial incentives and focus on lifestyle changes may be effective for diabetes prevention. While acknowledging concern for over-identifying prediabetes as an early diagnosis,8,9 we found that financial incentives for lifestyle change offered to employees may represent one effective strategy to slow the increasing incidence of diabetes, even without specifically targeting a prediabetes diagnosis for program participation. These types of innovative programs to address diabetes prevention have been advocated.10
The changes in HbA1c and weight we observed when employees were offered financial incentives were small, and we do not know whether these changes will eventually translate into preventing diabetes. The reductions in weight, however, were encouraging. Previous studies have shown a positive effect of a diabetes prevention program in the workplace11–13 specifically related to weight, similar to our findings. Interest remains in the use of incentives to prevent diabetes in different populations. For example, a randomized trial is in progress to assess the role of financial incentives in engaging patients with Medicaid insurance in lifestyle change.14 However, although diabetes prevention programs in the community have been associated with weight loss,15 our finding of greater weight loss in employees exposed to incentive offerings is different from what was recently found in a randomized trial of financial incentives in the workplace at 12 months.16 The difference may be related to the types of disease management programs offered to our study population or the size of the incentives. In addition, we analyzed changes at the population level and over longer (3-year) time frames. Even much longer follow-up may be needed to realize the benefits of lifestyle changes and to determine whether they are sustained, both in terms of measurable long-term clinical outcomes related to prediabetes as well as effects on health care costs.17 For example, on the basis of data from the Diabetes Prevention Program and the subsequent Diabetes Prevention Program Outcomes Study, the 10-year analysis did show the cost-effectiveness of lifestyle change with consideration of the costs of the intervention. However, in that analysis, most of the benefits were noted after 3 years.18
The fact that the difference in change for all 3 outcomes— HbA1c, weight, and LDL cholesterol—was greater with larger incentives partially tied to outcomes suggests that either the size of the incentive or the conditions attached to it had an impact on the outcomes. Unfortunately, our study could not separate the effect of the size of the incentive versus the fact that the incentive was related to achieving treatment goals in later years. Further study is needed to understand more clearly what best motivates patients to improve health.
Our study has several limitations. It was performed in a single health system and therefore may not be generalizable to other health systems or geographic areas, given the possibility of variability in practice patterns or lifestyle norms. Additionally, our employees were matched to non-employees cared for by the same providers, who likely offered the same treatment recommendations to all patients. Because of the large number of employees in our health system, providers may have been influenced in their general practice by the incentives of the employee health plan, possibly limiting our ability to find larger differences in outcomes related to the incentive program. Finally, we had no information regarding incentive programs that may have been offered to our comparison patients by their own employers or insurers or what types of lifestyle changes were initiated by our study population during this time frame.
CONCLUSIONS
A worksite wellness program offering employee health plan financial incentives for participation in wellness activities or disease management was associated with significant improvements in weight. Small improvements in HbA1c were also noted. Health benefits of large financial incentives for employees with prediabetes beyond 3 years are not known.
CLINICAL SIGNIFICANCE.
A worksite wellness program offering health plan financial incentives for participation and outcomes was associated with improvements in weight and glycosylated hemoglobin in employees with prediabetes at a population level compared with matched non-employees.
Worksite wellness programs that include financial incentives and focus on lifestyle changes may be effective for diabetes prevention.
ACKNOWLEDGMENTS
These data were presented in part as a poster presentation at the Society of General Internal Medicine national meeting, April 21, 2017, in Washington, DC.
Funding: ADM-H is funded by Agency for Healthcare Research and Quality grant K08HS024128.
Footnotes
Conflict of Interest: ADM-H has received grant funding from the Merck Investigator Studies Program and Novo Nordisk, Inc., both unrelated to this study.
References
- 1.Mattke S, Liu H, Caloyeras JP, et al. Workplace wellness programs study final report. Rand Health Q. 2013;3(2):7 Available at: www.rand.org/pubs/research_reports/RR254.html. Accessed February 14, 2015. [PMC free article] [PubMed] [Google Scholar]
- 2.Giles EL, Robalino S, McColl E, Sniehotta FF, Adams J. The effectiveness of financial incentives for health behaviour change: systematic review and meta-analysis. PLoS One. 2014;9(3):e90347. [DOI] [PMC free article] [PubMed] [Google Scholar]
- 3.Misra-Hebert AD, Hu B, Taksler G, Zimmerman R, Rothberg MB. Financial incentives and diabetes disease control in employees: a retrospective cohort analysis. J Gen Intern Med. 2016;31(8):871–877. doi: 10.1007/s11606-016-3686-2. [DOI] [PMC free article] [PubMed] [Google Scholar]
- 4.American Diabetes Association. Diagnosing Diabetes and Learning About Prediabetes. Available at: http://www.diabetes.org/diabetes-basics/diagnosis/. Accessed January 29, 2017.
- 5.American Diabetes Association. Statistics About Diabetes. Available at: http://www.diabetes.org/diabetes-basics/statistics/. Accessed February 1, 2017.
- 6.Knowler WC, Barrett-Connor E, Fowler SE, et al. Reduction in the incidence of type 2 diabetes with lifestyle intervention or metformin. N Engl J Med. 2002;346(6):393–403. doi: 10.1056/NEJMoa012512. [DOI] [PMC free article] [PubMed] [Google Scholar]
- 7.Wing RR, Lang W, Wadden TA, et al. Benefits of modest weight loss in improving cardiovascular risk factors in overweight and obese individuals with type 2 diabetes. Diabetes Care. 2011;34(7):1481–1486. doi: 10.2337/dc10-2415. [DOI] [PMC free article] [PubMed] [Google Scholar]
- 8.Shahraz S, Pittas AG, Kent DM. Prediabetes risk in adult Americans according to a risk test. JAMA Intern Med. 2016:1861–1863. doi: 10.1001/jamainternmed.2016.5919. [DOI] [PubMed] [Google Scholar]
- 9.Yudkin JS, Montori VM. The epidemic of pre-diabetes: the medicine and the politics. BMJ. 2014;349. doi: 10.1136/bmj.g4485. [DOI] [PMC free article] [PubMed] [Google Scholar]
- 10.Vojta D, Sa JD, Prospect T, Stevens S. Effective interventions for stemming the growing crisis of diabetes and prediabetes: a national payer’s perspective. Health Aff (Millwood). 2012;31(1):20–26. doi: 10.1377/hlthaff.2011.0327. [DOI] [PubMed] [Google Scholar]
- 11.Aldana S, Barlow M, Smith R, et al. A worksite diabetes prevention program: two-year impact on employee health. AAOHN J. 2006; 54(9):389–395. [DOI] [PubMed] [Google Scholar]
- 12.Barham K, West S, Trief P, Morrow C, Wade M, Weinstock RS. Diabetes prevention and control in the workplace: a pilot project for county employees. J Public Health Manag Pract. 2011;17(3):233–241. doi: 10.1097/PHH.0b013e3181fd4cf6. [DOI] [PubMed] [Google Scholar]
- 13.Kramer MK, Molenaar DM, Arena VC, et al. Improving employee health: evaluation of a worksite lifestyle change program to decrease risk factors for diabetes and cardiovascular disease. J Occup Environ Med. 2015;57(3):284–291. doi: 10.1097/JOM.0000000000000350. [DOI] [PMC free article] [PubMed] [Google Scholar]
- 14.Desai J, Taylor G, Vazquez-Benitez G, et al. Financial incentives for diabetes prevention in a medicaid population: study design and baseline characteristics. Contemp Clin Trials. 2017;53:1–10. doi: 10.1016/j.cct.2016.11.007. [DOI] [PubMed] [Google Scholar]
- 15.Jackson L Translating the diabetes prevention program into practice a review of community interventions. Diabetes Educ. 2009;35(2):309–320. doi: 10.1177/0145721708330153. [DOI] [PubMed] [Google Scholar]
- 16.Patel MS, Asch DA, Troxel AB, et al. Premium-based financial incentives did not promote workplace weight loss in a 2013–15 study. Health Aff (Millwood). 2016;35(1):71–79. doi: 10.1377/hlthaff.2015.0945. [DOI] [PubMed] [Google Scholar]
- 17.Caloyeras JP, Liu H, Exum E, Broderick M, Mattke S. Managing manifest diseases, but not health risks, saved PepsiCo money over seven years. Health Aff (Millwood). 2014;33(1):124–131. doi: 10.1377/hlthaff.2013.0625. [DOI] [PubMed] [Google Scholar]
- 18.The Diabetes Prevention Program Research Group. The 10-year cost-effectiveness of lifestyle intervention or metformin for diabetes prevention: an intent-to-treat analysis of the DPP/DPPOS. Diabetes Care. 2012;35(4):723–730. doi: 10.2337/dc11-1468. [DOI] [PMC free article] [PubMed] [Google Scholar]